BTC.D Update – Monday 29.09.2025📊 📊 BTC.D Update – Monday 29.09.2025
Alright Members, let’s talk Alts! 🚀
As I mentioned in my last analysis, Bitcoin Dominance started a retracement last week and reached our black line (Arrow #3) perfectly ✅. So far, everything is moving according to plan.
We even saw dominance break below the black area for a moment, but the very next day it reversed right back inside. That tells us one thing 👉 dominance is still in a downtrend.
⚡ Here’s the key:
* If Bitcoin continues its uptrend and BTC.D breaks below our black line (Arrow #4 downside) → this would be a strong bull run signal for ALTS. 🌊
* Until then, expect accumulation near Arrow #3 and distribution near Arrow #4.
👉 My view hasn’t changed: Patience is power. Better to wait for a clear direction before jumping into new trades. The market is setting up something big — timing it right will make all the difference.
Stay sharp, stay motivated, and remember: discipline now = profits later. 💪🔥
Alright Memebrs, let’s talk Alts! 🚀
As I mentioned in my last analysis, Bitcoin Dominance started a retracement last week and reached our black line (Arrow #3) perfectly ✅. So far, everything is moving according to plan.
We even saw dominance break below the black area for a moment, but the very next day it reversed right back inside. That tells us one thing 👉 dominance is still in a downtrend.
⚡ Here’s the key:
* If Bitcoin continues its uptrend and BTC.D breaks below our black line (Arrow #4 downside) → this would be a strong bull run signal for ALTS. 🌊
* Until then, expect accumulation near Arrow #3 and distribution near Arrow #4.
👉 My view hasn’t changed: Patience is power. Better to wait for a clear direction before jumping into new trades. The market is setting up something big — timing it right will make all the difference.
Stay sharp, stay motivated, and remember: discipline now = profits later. 💪🔥
Contains IO script

BTC Update – Monday, 29.09.2025🚀 BTC Update – Monday, 29.09.2025 🚀
Bitcoin gave us some real fireworks over the weekend! 🎇 After hunting stop losses on both buy and sell sides, price quickly reversed and pumped back into the zone of indecision.
📌 In my last analysis, I mentioned two key levels:
* 113,460
* 116,310
Last week, BTC broke downside of 113,460, which was the first confirmation of a downtrend wave. But guess what? The market didn’t confirm the breakout – instead, price snapped back up, showing that bulls are still alive and fighting! 🐂🔥
👉 My view remains the same:
* If BTC breaks above the Yellow Line (Arrow #1) → we enter super bullish mode 🟢 and momentum can explode higher.
* If BTC fails to break and gets rejected from there → we could see a drop towards 100K 🔻.
* On the higher time frame, BTC is still in a range between Arrow #1 and Arrow #3. Until one side breaks cleanly, we stay patient and let the market decide the real direction.
💡 Reminder for all traders: Sometimes the best trade is no trade. Let the price confirm – don’t rush. Patience = Profits! 🧘♂️💰
⚡Stay focused, stay motivated, and remember – market shakeouts are designed to test weak hands. Strong hands win in the long run. 💪🔥

AMD forming daily wedge. Await break through and close above resAMD forming rising wedge. Await close above resistance. MACD signal up. Financials showing rising earnings. News not very favorable.

Shooting Star COT backed reversal play in EURUSDEUR/USD printed a shooting star and engulfing right at the key supply zone around 1.1768 following last week’s FOMC – a strong signal that a potential top might be in place.
The move is not just technical, it’s backed by positioning data:
EUR longs reduced (-3.4k contracts)
USD longs added (+2.5k contracts)
Smart Money is quietly shifting toward the Dollar.
With Eurozone data on deck, the stage is set for a potential catalyst to accelerate the downside. Technically, the next significant demand zone sits at 1.1460. A level that has repeatedly attracted buyers in the past.
Setup: Short bias remains valid below 1.18200
I take an entry on the current supply but would be ready to re-enter if we move into the supply above.
1.TP: 1.16500
2.TP: 1.16000
3.TP: 1.14600
SL: Above 1.1768

DOLLAR STRENGTH....this is why and how I'm selling EURUSDAll the information you need to find a high probability trade are in front of you on the charts so build your trading decisions on 'the facts' of the chart NOT what you think or what you want to happen or even what you heard will happen. If you have enough facts telling you to trade in a certain direction and therefore enough confluence to take a trade, then this is how you will gain consistency in you trading and build confidence. Check out my trade idea!!
www.tradingview.com

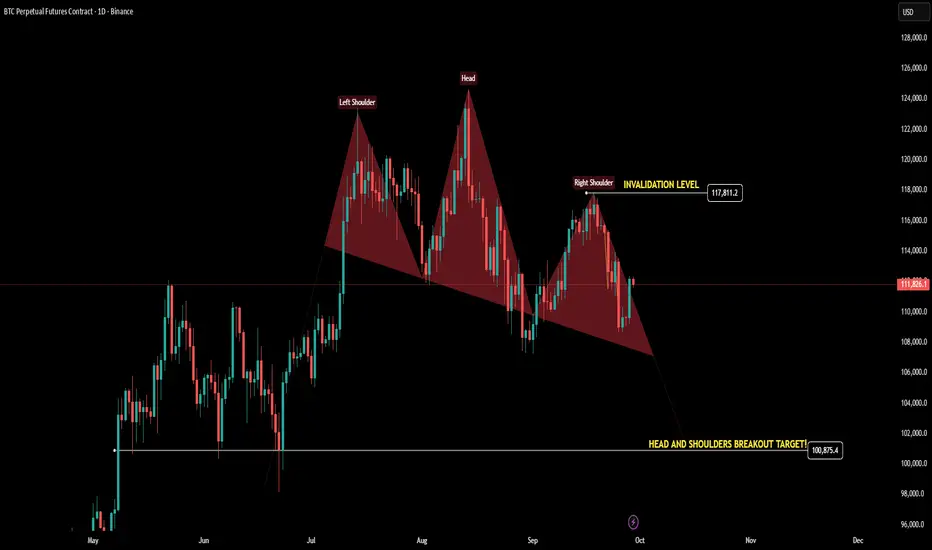
Bitcoin is forming a Head & Shoulders on the daily chart. Bitcoin is forming a Head & Shoulders on the daily chart. ⚠️
Invalidation: $117,811
Breakdown target: $100,875
If neckline breaks, expect more downside.
Stay cautious, Chill Fam!
ASAL - BUYNSE:ASAL Weekly double bottom breakout exactly at location with buyers confirmation May continue trend till swing previous high.

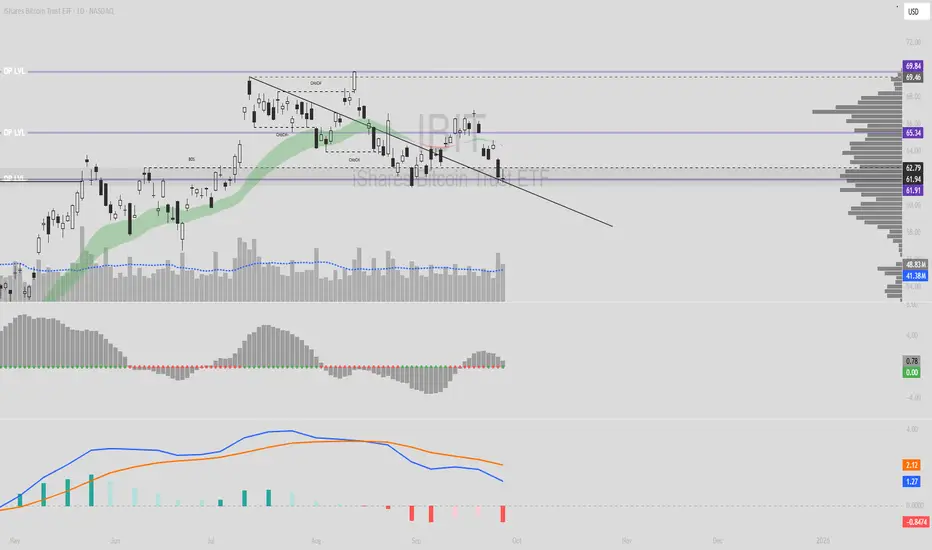
IBIT - Gap Fill PotentialDark Pool level 61.91 held as key support. If defended, setup favors an upside gap fill into the mid/high 60s, backed by rising volume and bullish call flow.
Buy Plan (OBoy Energy Limited – PSX)Buy Plan (OBoy Energy Limited – PSX)
Condition to Enter:
Buy once price closes above 12.00 (cisd level) on the weekly chart.
Entry Zone:
Enter on a confirmed weekly close above 12.00, or on a small retracement back to the breakout level.
Stop Loss (SL):
Below 7.50 (last consolidation support).
Targets:
Target 1: 26.37 (≈135% gain)
Target 2: 32.16 (major resistance zone)
Risk Management:
Risk only 1–2% of capital.
Move stop loss to breakeven once price reaches halfway to Target 1.
Notes:
Wait for weekly candle close confirmation above 12.00, not just intraday spikes.
Patience is key — don’t chase before breakout is validated.

BTC: Sharp Drop DownOn September 13, the Bitcoin market turned into a downward move on the 1-hour timeframe from the $115,267 zone. From that point, the price consistently declined, breaking through key levels and reaching a low of $108,565. The move covered more than $6,700 per coin, fully completing all four profit-taking stages.
This development shows that a disciplined approach allows traders to capture more from a trend than emotional decisions ever could. Many closed positions early, locking in only part of the result, but structured trade management made it possible to hold through the move and realize the full potential.
For investors, this becomes a tool of control — visualization of entry and exit zones allows risks to be assessed clearly and decisions to be made with confidence, even in periods of high volatility. Instead of guessing where to secure gains, they see the structure of the move and can manage capital with a calm, systematic approach.
The market will always offer opportunities, but the ability to realize them depends on discipline. Where chaos turns into structure, trading stops being a gamble and becomes a managed process.
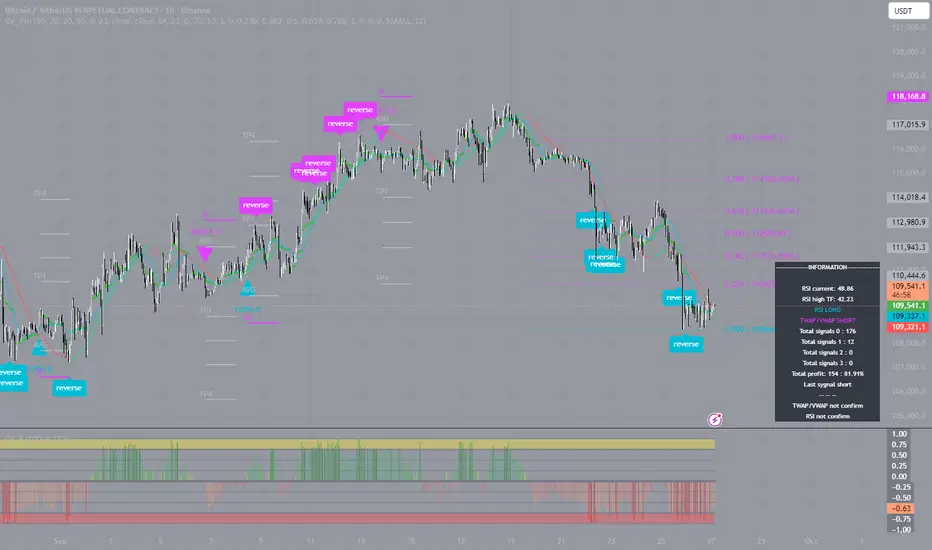
BTC: Drop from $115K"On September 19, Bitcoin turned downward on the 4-hour timeframe around $115,060. From that point, the price moved steadily lower, reaching $108,566 and creating a difference of more than $6,400 per coin. The move passed through three stages of profit-taking, making it one of the strongest setups in recent weeks.
What stands out is how long the move lasted. Many traders closed early and secured profit but left a significant portion of the potential on the table. This is where a systematic approach proves its value: step-by-step management, moving positions to breakeven, and phased profit-taking allow you to capture the move more fully.
For a mid-level trader, this approach works as an accelerator. It removes doubts, helps hold positions longer, and shields from emotional mistakes. The outcome is driven not by luck or guesswork but by discipline and clear structure.
Once again, the market has shown: those who stick to the plan take more.

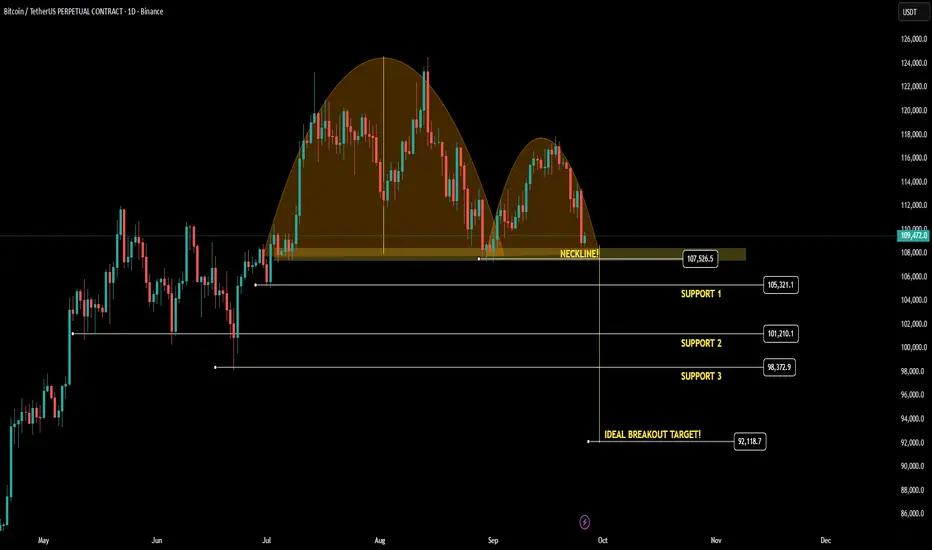
Bitcoin is forming an inverse cup & handle! Bitcoin is forming an inverse cup & handle! ⚠️
Neckline/support at 107K – if this breaks, price could slide toward 100K.
Expect possible short-term bounces at support levels 1, 2 & 3.
ElDoradoFx PREMIUM 2.0 – GOLD FORECAST 25/09/2025 (ASIA SessioN)🔍 Multi-Timeframe Technical Outlook
Daily Chart
• Price trading 3,750, consolidating just below recent high at 3,791.
• Momentum still bullish overall, but candles show rejection at highs → suggesting possible short-term retracement before continuation.
• 20EMA support at 3,727, stronger structure support at 3,705.
⸻
1H Chart
• Price has created a triangle structure, now testing resistance 3,748–3,751.
• Clear invalidation/decision levels:
• Break & Retest 3,748/3,751 = bullish continuation.
• Break & Retest 3,732 = bearish continuation.
• MACD histogram turning positive, showing early bull momentum.
• RSI mid-zone → neutral bias, awaiting breakout confirmation.
⸻
15M Chart
• Price consolidating above 3,744, respecting intraday demand zone.
• Bullish divergence forming on MACD → supports a possible bounce.
• Key resistance: 3,751–3,756 (short-term profit zone if broken).
⸻
5M Chart
• Current consolidation 3,746–3,750, coiling for Asia session move.
• Micro trend supports scalping longs if 3,748 holds as support.
• Downside scalp possible if 3,732 breaks & retests.
⸻
🎯 High Probability Scalping Entries (Asia Session)
(max 60 pips SL)
✅ Scalp Buy Setup
• Entry: Above 3,748 with retest confirmation.
• SL: 3,742 (-60 pips).
• TP Zones: 3,756 / 3,764.
• Reasoning: Break above intraday resistance aligns with bullish MACD & higher-timeframe trend.
✅ Scalp Sell Setup
• Entry: Below 3,732 with retest confirmation.
• SL: 3,738 (-60 pips).
• TP Zones: 3,722 / 3,710.
• Reasoning: Clean liquidity pocket below 3,732, bearish MACD cross on 5M supports momentum lower.
⸻
📌 Fibonacci Golden Zone Check
• Pullback from 3,791 high → 3,732 low shows golden zone at 3,748–3,755.
• Price is inside golden zone right now → high chance of reaction.
• This strengthens the importance of 3,748–3,751 breakout for bullish continuation.
⸻
⚠️ Key Asia Session Levels
• Bullish Breakout: 3,748 → target 3,756 / 3,764.
• Bearish Breakout: 3,732 → target 3,722 / 3,710.
• Intraday Pivot: 3,744–3,746 zone (control level).
⸻
✅ Summary:
For Asia, gold is coiling inside the golden zone. A break above 3,748–3,751 should open the path to 3,764, while a clean drop below 3,732 could accelerate toward 3,710. Both setups respect a 60-pip stop loss. Wait for break-and-retest confirmations on 5M & 15M before entering.

XAUUSD Deep Analysis – London Session (25/09/2025)📊 XAUUSD Deep Analysis – London Session (25/09/2025)
Daily (D1)
• Gold trades around 3,743, correcting after the 3,791 high.
• Price is holding above the 21 EMA (~3,727) – still a bullish structure, but showing signs of short-term exhaustion.
• RSI is cooling from overbought, MACD histogram is flattening → momentum is slowing but trend bias stays bullish above 3,727–3,731.
⸻
1H Chart
• Current structure: Consolidation between 3,732 support and 3,745–3,748 resistance.
• EMA alignment still favors buyers (above 200 EMA), but MACD remains negative, showing fading upside.
• A break above 3,748 can retest 3,760–3,768, while failure risks a dip to 3,732–3,717.
⸻
15M & 5M Charts (for scalping)
• 15M: Price rejected 3,745–3,748 zone twice → short-term supply is strong. MACD histogram is turning red, RSI under 50.
• 5M: Micro double-top at 3,745, rejection followed by bearish momentum toward 3,738–3,736. If this breaks, fast drop to 3,731 is likely.
⸻
🟡 Fibonacci Golden Zone
Latest swing: 3,717 low → 3,748 high
• 38.2% = 3,737
• 50% = 3,732
• 61.8% = 3,727
➡️ Golden zone = 3,737–3,727 → strong buy area for scalpers and intraday bulls.
⸻
⚡ High Probability Entries
Scalping Buys
• Buy near 3,732–3,737 (Fib zone) → SL 3,727 (≈60 pips) → TP 3,744–3,748.
• Aggressive buy breakout above 3,748 → SL 3,742 → TP 3,760–3,768.
Scalping Sells
• Sell rejection at 3,745–3,748 → SL 3,751 → TP 3,738–3,732.
• Sell breakdown below 3,732 → SL 3,738 → TP 3,727–3,717.
⸻
✅ Summary
Gold is consolidating inside 3,732–3,748 range, waiting for breakout. The Fib golden zone (3,737–3,727) remains a high-probability buy area if retested. Scalping plays are available both sides: fade rejections at 3,748 or buy dips at 3,732–3,727 with tight 60 pip stops.

XAUUSDPrice action trading is a methodology where traders make decisions based on the interpretation of actual price movements on a chart, rather than relying primarily on lagging indicators. It involves observing and analyzing candlestick patterns, trend lines, support and resistance levels, and volume to identify potential trading opportunities and manage risk. The focus is on understanding the story the market is telling through its price behavior.

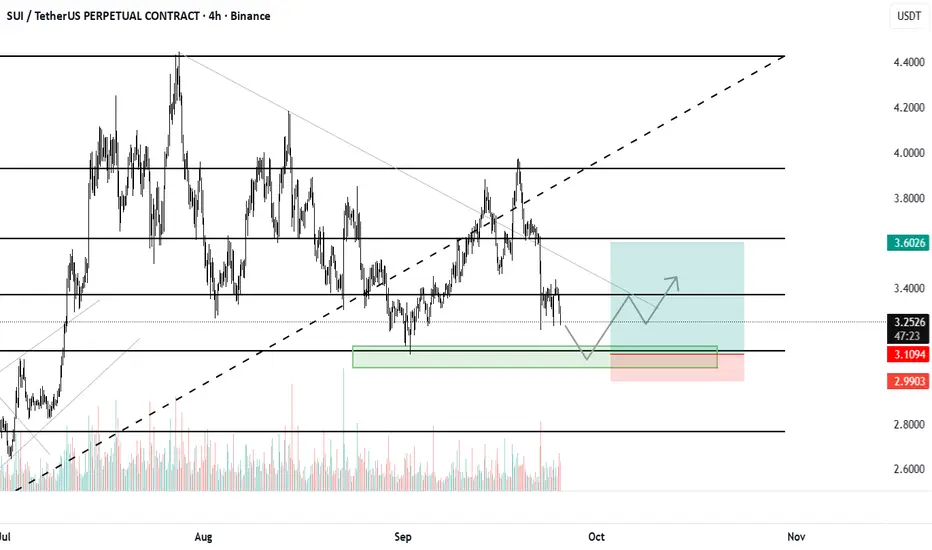
$sui chart analysis Sui correcting and almost in our entry zone i will be taking long entry with tight stop loss from marked zones. it has to flip that trend line for even bullish structure.
$SOL bearish but long entry markedSolana made double top and currently correcting and grabbing liquidations. Marked is the zone from where i will be longing and placing stoploss at 180$. however i will be taking 2x leverage maximum.

EURUSD Technical Outlook – September 25, 2025What I see!
EURUSD is consolidating after the bullish leg starting from June–July low. Price is currently sitting inside a key area, testing the Daily FVG while holding above 1.1700 support.
A clean push back above 1.1800 would open the way toward the Buy-Side Liquidity at 1.1918 and 1.1974, with a possible extension to 1.2050.
Conversely, a failure to hold the 1.1700 zone could trigger a drop into the Sell-Side Liquidity at 1.1574 and potentially 1.1390.
This analysis is for educational purposes only.

How to place your SL & TP levels according to your R:RAll the information you need to find a high probability trade are in front of you on the charts so build your trading decisions on 'the facts' of the chart NOT what you think or what you want to happen or even what you heard will happen. If you have enough facts telling you to trade in a certain direction and therefore enough confluence to take a trade, then this is how you will gain consistency in you trading and build confidence. Check out my trade idea!!
www.tradingview.com

Doge(based on NEo wave)according to last counting of doge, under 0.23$ it means its a bow-tie diametric and it takes about 1 more week for correction.

ElDoradoFx PREMIUM 2.0 – GOLD FORECAST (24/09/2025, London SessiGold is trading around 3,764–3,766, pulling back from yesterday’s high at 3,791. Momentum has slowed, with intraday charts showing corrective pressure, but the higher timeframe trend remains bullish.
⸻
🔍 Technical Outlook
Daily (D1):
• Still bullish, holding above 21 EMA (3,731) and 50 EMA (3,665).
• Price rejected at 3,791 resistance, forming a short-term top.
• As long as 3,731 holds, structure favors higher continuation.
1H Chart:
• Range developing between 3,791 high resistance and 3,750 intraday support.
• Price retesting dynamic trendline support near 3,760–3,756.
• MACD still negative, histogram showing bearish momentum building.
• RSI ~40, confirming corrective bias.
15M Chart:
• Clear rejection at 3,779–3,782 zone, now acting as intraday resistance.
• Support forming around 3,756–3,750.
• Structure lower highs / lower lows → short-term bearish pressure.
• MACD bearish crossover aligned with momentum.
5M Chart:
• Price broke minor support at 3,766–3,763, now testing lower zone 3,759–3,756.
• MACD histogram negative, RSI oversold → possible bounce setup.
• Price approaching strong demand cluster at 3,752–3,750.
⸻
🟡 Fibonacci Golden Zone
Using swing low 3,741 to swing high 3,791:
• 38.2% Fib = 3,772
• 50% Fib = 3,766
• 61.8% Fib = 3,760
➡️ Golden zone = 3,772–3,760 → price is currently inside this zone, a potential high-probability area for reversal/buy scalps.
⸻
⚖ High-Probability Entries
Buy Setup (preferred if Fib zone holds):
• Entry: 3,766–3,760 (Fib support)
• SL: 3,754 (≈60 pips)
• TP: 3,775 → 3,782 → 3,791
Sell Setup (only on rejection at resistance):
• Entry: 3,779–3,782 rejection
• SL: 3,788 (≈60 pips)
• TP: 3,770 → 3,766 → 3,760
⸻
⚡ Scalping Signals (5M & 15M, ≤60 pips SL)
• Buy scalp: 3,763–3,760 → TP 3,770–3,775 (SL 3,754)
• Sell scalp: 3,779–3,782 → TP 3,770–3,766 (SL 3,788)
⸻
📅 Key Breakout Levels
• Bullish continuation: Break & hold above 3,791 → targets 3,800–3,808.
• Bearish retracement: Break & hold below 3,750 → exposes 3,741–3,731.
⸻
✅ Summary
Gold is currently consolidating inside the Fibonacci golden zone (3,772–3,760). This area is crucial for bulls to defend and attempt another push toward 3,782–3,791. If 3,760–3,754 breaks, expect deeper pullback toward 3,741–3,731. Scalpers can trade both sides of the range with tight stops, but the Fib zone remains the high-probability demand for buys.
— ElDoradoFx PREMIUM 2.0 Team

$ENGN Monster in the making-Daily downtrend breakout
-Weekly ema crossover
-Biggest monthly volume in the company's history
-Monthly price closed over the 10 for the first time in years
-Monthly rsi leaving overbought for the first time in years
-Monthly macd positive
-Float & OS 36M / 51M
-79% Tutes
-Received RMAT designation from the FDA for detalimogene
-Catalysts: Q4 2025 preliminary data from LEGEND trial pivotal cohort (100 patients), Q4 2025 Trial in progress updates from LEGEND study's additional cohorts, H2 2026 BLA filing with the FDA based on cohort data.
-Average analyst 1-year price target: $21.00–$24.00
-Sitting on 12 months of cash after receiving $260M in PIPEs last year.
www.tradingview.com

FOMC 100% Breakout (Check) - Key Resistance and 6500 Gamma PinFOMC was in fact a NOISE candle
So I measured the candle, projected a 100% breakout bullish and bearish
Bulls took the bait and ran higher, but still resistance @ 6700 seen today and hopefully
a short-term window to see a bit of a slide lower into some technical levels
EMA support levels
-watching the 21 period daily EMA
-watching the 50 period daily EMA
6550 FOMC candle lows from last week
6500 Gamma Pin with JP Morgan's quarterly collar trade
This is the first day in several weeks where I've seen some actual follow through
in negative gamma option flows
If futures grinds prices lower, the cascade may take hold and we can see a 100-200 point
selloff quickly in the S&P
I still like scooping up premium and buying the dips, but hopefully at more attractive levels
like 4-5% lower or even 8-10% lower
Let's see how it plays out. I'll be in the markets grinding per usual.
Thanks for watching!!!
