Today's zones for bitcoin chart Bit coin has given false break out of liquidity sweep zone . It shows liquidity was taken above the level . Now we can see a good bearish moment in bitcoin.
Contains IO script

ETCUSDT positionEthereum Classic Price Analysis:
Trend & Behavior: Price has dropped from 22.33 and is near support at 19.68. If it rebounds from this level, we could see an upward move, but if it breaks below 19.68, the downtrend could continue.
Support & Resistance:
Support: 19.68 is the key level. A bounce here may lead to an upward move toward 21.88 or 22.33.
Resistance: 22.33 and 21.88 are key resistances. If price fails to break them, expect a possible retracement.
Scenarios:
Bullish: If price reacts positively at 19.68, consider buying with targets at 21.88 or 22.33.
Bearish: If price breaks below 19.68, watch for further support at 18.87 or 17.36.
Strategy: Best to enter long if the price bounces from 19.68, but be cautious if it breaks below, as further declines could follow.

$AR still not confirmed yet.Previously NYSE:AR made perfect W (double bottom) however was not able to breakout. I am still not sure what it is trying to do here lol. I will wait for further clarifications

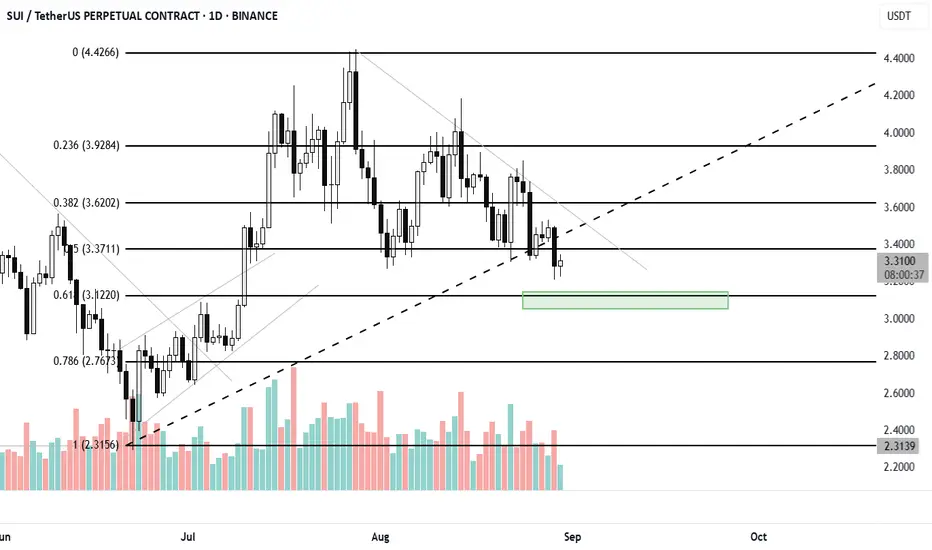
$SUI lower low and lower highs. About to flip soonCRYPTOCAP:SUI
keeps making lower low and lower High about time it flips.
Looking to long it again from 0.6 FIB level considering the ALT season is around and CRYPTOCAP:SUI
is yet to make another ATH. I will wait for it to reach 3.12$ and enter long.
$BTC to fall further I am still bearish on CRYPTOCAP:BTC that it will touch 105k which is 0.38 FIB level and then retest the upper resistance zone.
Super bullish on ALTS. I stand firm on my previous call and those who did not agree, Congrats for getting rekt on longs.
Trade it not gamble it!

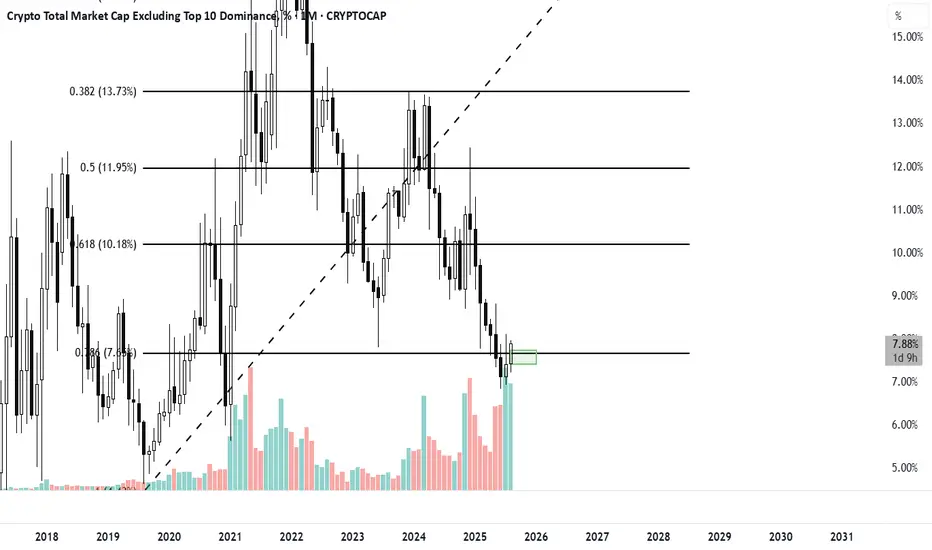
$ALTs expected to go upBased on ALT's Market cap dominance it is on support based on FIB 0.7 level from where it is supposed retrace back up atleast 3% which is unbiased call.
I will then further wait for it to flip the next FIB level for further clarifications/Calls.

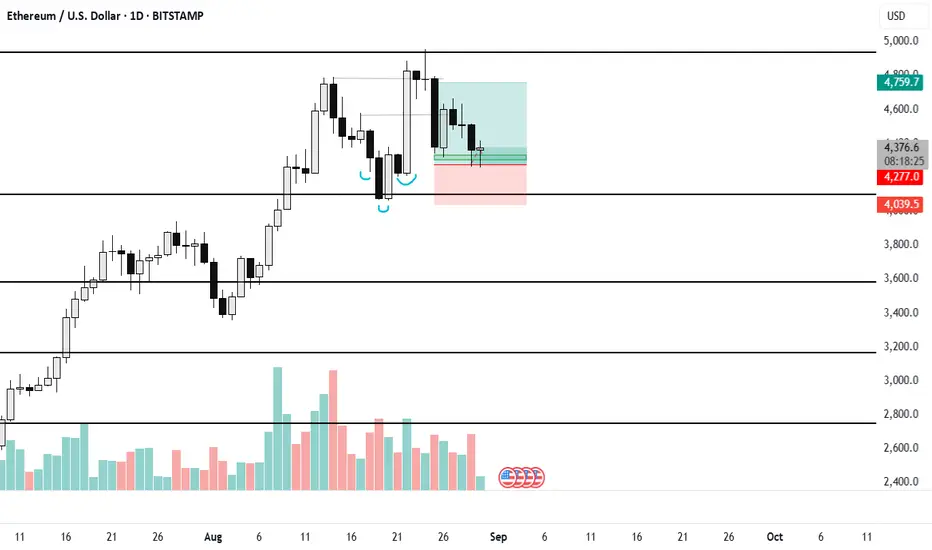
$ETH in entry zone once again I am going to play a long from here over a simple support and resistance zone.
CRYPTOCAP:ETH pumped earlier from my Entry and went up those who followed should have made good profits. This is another opportunity to enter a long before the ALT season starts in September.
CRYPTOCAP:BTC dominance keeps falling as predicted.
Aave Falters at Key Resistance, All Eyes on $227 Defensive ZoneAave (AAVE) failed to break above the $390 resistance level and has since turned lower. The market is now watching closely as price approaches the $227 support area, a zone that could determine whether the broader bullish structure holds or breaks down.
Price Rejection at Resistance
AAVE attempted to extend higher but was firmly rejected at $390, a level that has capped momentum before. The rejection sparked a corrective move, shifting sentiment short term and forcing the asset back toward mid-range support. This rejection confirms $390 as a major ceiling in the current structure.
$227 as the Critical Line in the Sand
The decline has brought price action toward the $227 region, which carries strong technical significance. This level aligns with the 0.618 Fibonacci retracement of the recent move, as well as the prior structural higher low. The confluence here makes $227 the most important level for bulls to defend if they want to maintain the upward narrative.
Volume and Market Structure
One notable observation is that bullish volume has faded during this pullback. Previous rallies in AAVE were supported by consistent spikes in demand, fueling continuation. For a reversal from $227 to gain traction, the market needs to see a clear return of strong buy-side activity. Without this, any bounce risks being short-lived.
Scenarios to Watch
Bullish Case: If $227 holds with renewed volume, AAVE could rotate higher and retest the $390 resistance. A successful breakout from there would mark a significant continuation of the uptrend.
Bearish Case: If $227 breaks with conviction, the bullish structure of higher lows would collapse, opening the door to a deeper retracement toward lower support zones.
Outlook
Aave sits at a decisive juncture. The rejection at $390 has confirmed overhead resistance, but the upcoming reaction at $227 will dictate the next chapter. Hold the level, and a path back toward $390 remains alive. Lose it, and momentum shifts firmly in favor of sellers.

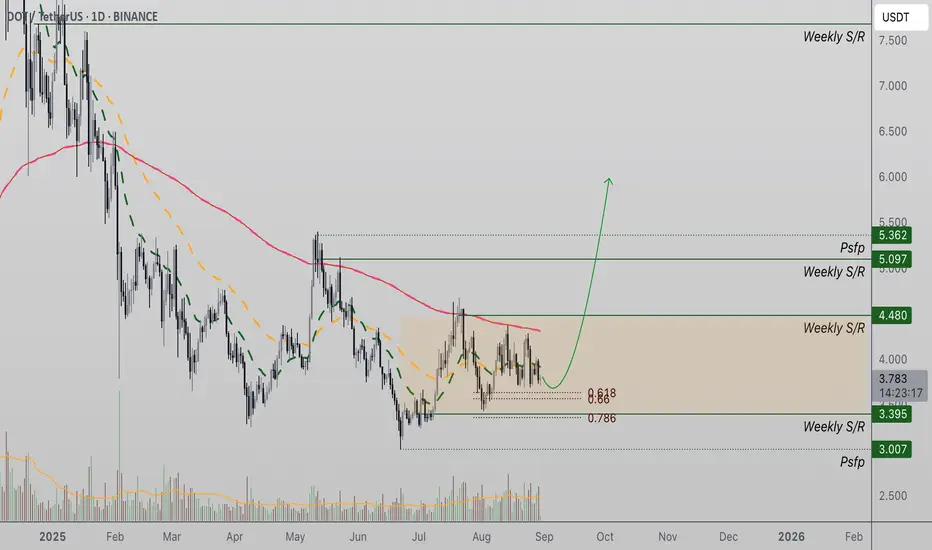
Polkadot Holds $3.75 Support - Buyers Defend Key Technical LevelPolkadot (DOT) has maintained its position above the crucial $3.75 support, a level that continues to highlight strong buyer activity despite recent market pullbacks. This area is shaping up as a pivotal battleground for bulls, potentially setting the stage for further upside if momentum returns.
Market Context
After dipping as low as $3.00, DOT staged a rebound that allowed it to reclaim and consolidate above $3.75. This level has since emerged as a technical anchor for price action, where repeated defenses have reinforced the bullish outlook. Holding above this zone strengthens the case for continuation higher, as it preserves the structure of higher lows on the chart.
Key Technical Observations
- Critical Support at $3.75: A zone repeatedly defended by bulls, establishing itself as the current demand floor.
- Higher Lows Structure: The trend remains constructive, with DOT carving out a sequence of higher lows and showing resilience after corrections.
- Volume Dynamics: Trading activity has declined during consolidation, a typical sign of a market preparing for a potential expansion in either direction.
- Upside Path: A clean defense of $3.75 opens the possibility of an advance toward the $5.00 region, aligning with prior structural resistance.
Analysis
From a structural perspective, DOT’s defense of $3.75 suggests accumulation by buyers at this level. Each retest has been met with renewed interest, keeping the market from breaking lower and signaling that demand is active. This aligns with the broader pattern of higher lows, which often precedes continuation rallies.
However, the muted state of volume is worth noting. A sustainable move higher will likely require stronger participation from market participants, reflected in larger bullish inflows on the volume profile. Without this confirmation, price may remain bound within its current range, consolidating between $3.75 support and the overhead resistance zone.
Should the $3.75 level give way on decisive volume, it could trigger a deeper retracement, potentially retesting areas closer to the $3.20–$3.00 range. Such a breakdown would undermine the current bullish structure and shift momentum back into bearish hands.
What to Expect in the Coming Price Action
As long as DOT holds above $3.75, the market retains a constructive bias with the potential for an upward rotation. A pickup in bullish volume would be the clearest sign of a push toward the $5.00 resistance zone. Conversely, a breakdown beneath $3.75 would expose the lower ranges and delay any bullish recovery attempt.
Bitcoin level for today .Bitcoin has taken rejection from golden reversal level . If sustains we can see a bearish moment till liquidity sweep top level .

BTC - 1DI see BTC dipping to around 104,000 first after jumps toward 123,000
a quick swoop hunt and gather liquidity around a strong demand zone near 100 and 105k that should fill the FVG. once liquidity is pockted, I see in the heatmap liquidity hovering at 122K and wit the ETF pressure can create a long squeeze up, to the biggest supply zone wich is in the 122 to 124K and a BOS should occur at that level. However given that historically September is bearish before the big run, so a risk of BTC breaking 104 will make fall deep under 100K, so far sellers are winning in the orderflow however I believe institutionas might defend the 98-100 level hard.

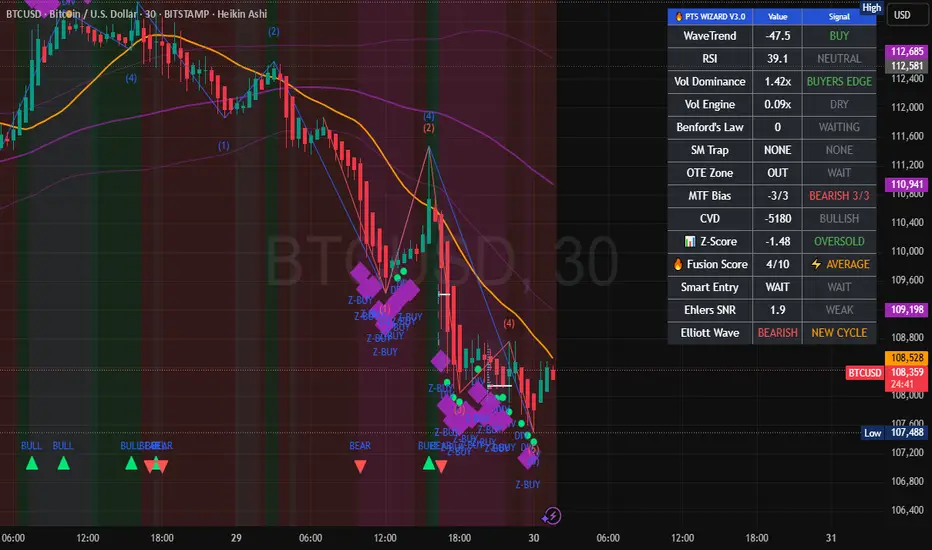
Trade Setup AnalysisSHORT
Entry Price: 108,590 (limit on pullback)
Stop Loss: 108,840
Take Profit(s): TP1 108,200 · TP2 107,900 · TP3 107,500
Risk-to-Reward (RR): ~1.6:1 (TP1) · ~2.8:1 (TP2) · ~4.4:1 (TP3)
Asset: BTCUSD (3-min, Heikin Ashi)
Market Type: Crypto
Session (if visible): NY overlap
Rationale:
Structure: Clean intraday downtrend; price trades below fast & slow MAs with a sequence of lower highs/lows.
Smart Money / Flow: MTF Bias shows bearish 3/3; CVD deeply negative (strong sell) confirming dominant sell pressure; Vol Dominance favors sellers.
Momentum/Stats: WaveTrend sell, Z-Score & RSI oversold → expect reactive bounces; therefore prefer fade-the-bounce rather than chase lows.
Execution Logic: Enter on retest of the 108,560–108,650 supply/EMA pocket (fair-value gap fill from the impulsive drop). SL above the most recent LH/EMA cluster (108,840) to avoid noise.
Management: Reduce risk at TP1 (move SL to BE), scale at TP2, leave a runner to TP3 targeting the liquidity shelf below 107,600–107,500.
🔒 DISCLAIMER
This analysis is for educational purposes only and does not constitute financial advice. Trading involves risk. Always do your own research before making investment decisions.
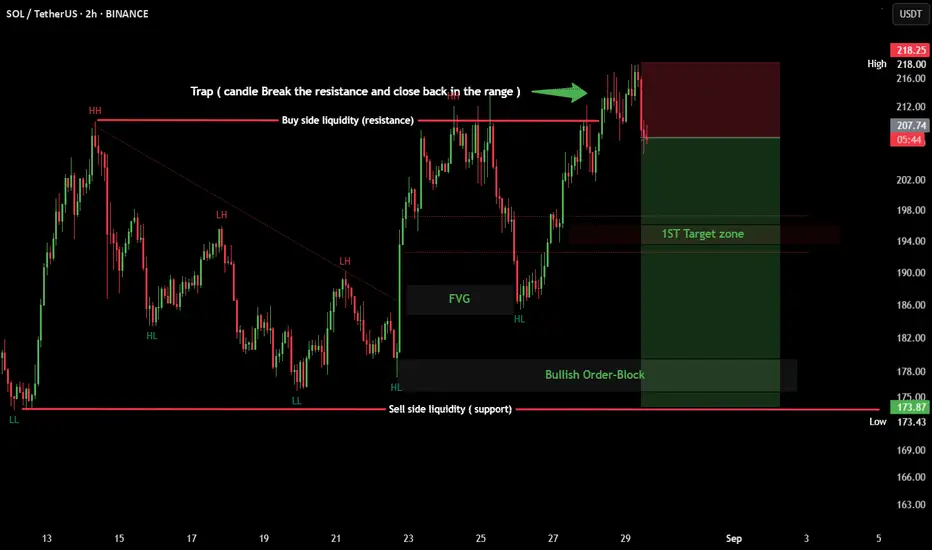
SOL/USDT | Liquidity TrapPrice broke above resistance but quickly closed back in the range, signaling a potential bull trap. Liquidity was grabbed at the highs, and now sellers may target the first demand zone near $194. If momentum extends lower, the bullish order block at $175 becomes the key support.
False breakout above resistance, liquidity grabbed – eyes on $194 first, then $175 bullish OB

XAUUSD Technical OutlookWhat I see!
XAUUSD Technical Daily Outlook
Gold (XAUUSD) is forming a falling wedge after the sharp drop from the 3,430s high - - a structure that often signals a potential bullish reversal.
Price is consolidating inside the wedge, rejecting from the Daily FVG while holding the H4 demand zone at 3,320. A break above the wedge trend-line could spark an impulsive move toward the 3,375 BSL, with further upside into 3,439 if liquidity is cleared.
The wedge has already completed five legs, adding confluence for a possible breakout soon. Conversely, failure to hold 3,320 may invite deeper retracement before bulls re-enter.
This chart is presented for educational discussion of market structure and technical patterns only. It is not a trade signal or financial advice.
Learn before earning!

Sonic Consolidates at Point of Control With Eyes on $0.50Sonic (SUSDT) is trading at the point of control of its current range, a region in confluence with the 0.618 Fibonacci and value area low. Sonic’s reaction here could set the tone for its next move.
Sonic has been consolidating around a major support cluster for an extended period. This region, which aligns with the point of control, the 0.618 Fibonacci retracement, and the value area low, has acted as a structural base. If this zone holds, it creates conditions for a rotation higher, with the $0.50 level emerging as the next technical target.
SONIC Price Technical Points:
- Point of Control Support: Sonic is holding at the POC in confluence with the 0.618 Fibonacci and value area low.
- Volume Profile Foundation: Prolonged trading in this region has built significant volume support.
- Upside Objective: A breakout from the current channel could accelerate toward $0.50.
Main Analysis:
Sonic’s current price action reflects a prolonged period of accumulation within its trading channel. The point of control, which represents the most actively traded volume level, has emerged as a pivotal area. Combined with the 0.618 Fibonacci retracement and value area low, the region highlights a strong confluence of support.
From a structural standpoint, this setup favors continuation higher once momentum returns. A breakout from the current channel would serve as the catalyst for a bullish expansion, with the $0.50 level representing the next logical upside target. However, the sustainability of such a move will rely heavily on market participation.
The volume profile confirms this dynamic. While Sonic has established a strong base through extended consolidation, a surge in bullish inflows will be required to validate the next rotation upward. Without volume confirmation, price could remain range-bound, delaying the breakout despite strong technical foundations.
What to expect in the coming price action:
If Sonic defends its current confluence zone and volume inflows increase, a breakout toward $0.50 becomes the most probable scenario. Failure to generate demand would risk continued consolidation within the range.

Bitcoin Tests Key Support as Market Eyes $132,000 TargetBitcoin (BTC) is testing its 0.618 Fibonacci retracement, a region in confluence with VWAP-SI support and the range-low channel. Bitcoin’s reaction here could define its path toward $132,000.
Bitcoin has reached a pivotal inflection point, consolidating around one of its most significant technical supports. The current zone aligns with the 0.618 Fibonacci retracement, VWAP-SI support, and the range-low boundary of its higher trend channel. Holding this region will be crucial, as a defense could set the stage for an aggressive push higher.
BITCOIN Price Technical Points:
- Critical Support Cluster: Confluence of 0.618 Fibonacci, VWAP-SI support, and channel range low.
- Structural Pivot: Holding this level maintains the bullish channel and uptrend momentum.
- Upside Target $132,000: A defense here opens the probability of rotation toward new all-time highs.
The confluence of Fibonacci retracement, VWAP-SI support, and channel structure makes the current support level one of the most important in Bitcoin’s recent history. Each of these indicators individually holds technical weight, but when aligned together, they form a region of strong demand. This makes the next few daily and weekly closes especially significant.
If Bitcoin can hold this zone, it would establish another higher low within the broader bullish channel. This would reinforce the market’s existing structure and provide a springboard for continuation. Conversely, a failure to defend this cluster would weaken the higher trend channel and shift focus toward deeper supports, undermining the bullish case in the short term.
The upside target for a successful defense lies at $132,000, where the next high-time frame resistance has been marked. This level represents not just a psychological milestone but also a structural cap aligned with Fibonacci extensions. Testing this region would effectively mean Bitcoin breaking into uncharted territory, further cementing its bullish trend.
What to expect in the coming price action:
If Bitcoin holds the confluence support on a closing basis, the probability of a rotation toward $132,000 increases substantially. Losing this region would threaten the bullish channel and open the door to corrective downside.

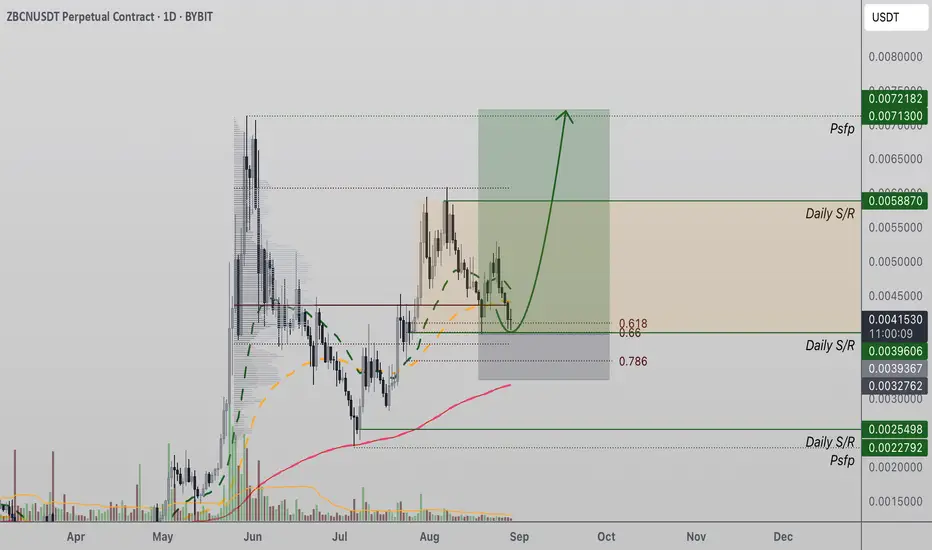
ZBCN Tests Key Daily Support With Potential for BreakoutZBCN price action is consolidating at a critical daily support zone, a level reinforced by the value area low and the 0.618 Fibonacci retracement. This region has already been retested multiple times, highlighting its importance as a structural pivot. Despite the repeated pressure, bulls remain in control as long as this support is maintained. A sustained defense could provide the catalyst for continuation higher.
ZBCN Price Technical Points:
- Daily Support Zone: ZBCN is trading at daily support aligned with the value area low.
- 0.618 Fibonacci Confluence: Price action has breached this level intraday, but bulls continue defending it.
- Volume Confirmation Needed: A rally requires bullish inflows to reverse the current volume decline.
The daily support zone currently being tested by ZBCN is critical for maintaining its bullish trajectory. Its alignment with both the value area low and the 0.618 Fibonacci retracement creates a high-confluence region. Price briefly breached this level on a closing basis, but the market has so far failed to generate follow-through selling pressure, suggesting that buyers remain active.
From a structural perspective, this support test provides an opportunity for another higher low to form. Such retests are often healthy within bullish trends, as they confirm the strength of demand zones. However, the absence of volume confirmation is concerning. A clear decline in the volume profile suggests that participation is thinning, which may delay a strong upside reaction until inflows return.
For ZBCN to initiate a move toward its all-time high, volume will be the decisive factor. Strong bullish inflows paired with decisive candles are necessary to confirm conviction and momentum. Without this validation, the market risks extended consolidation around the current level, testing the patience of participants before a breakout occurs.
What to expect in the coming price action:
If ZBCN holds the current daily support and volume inflows return, the probability of a rotation toward the all-time high increases significantly. Failure to attract demand could see price stall or retest lower supports.
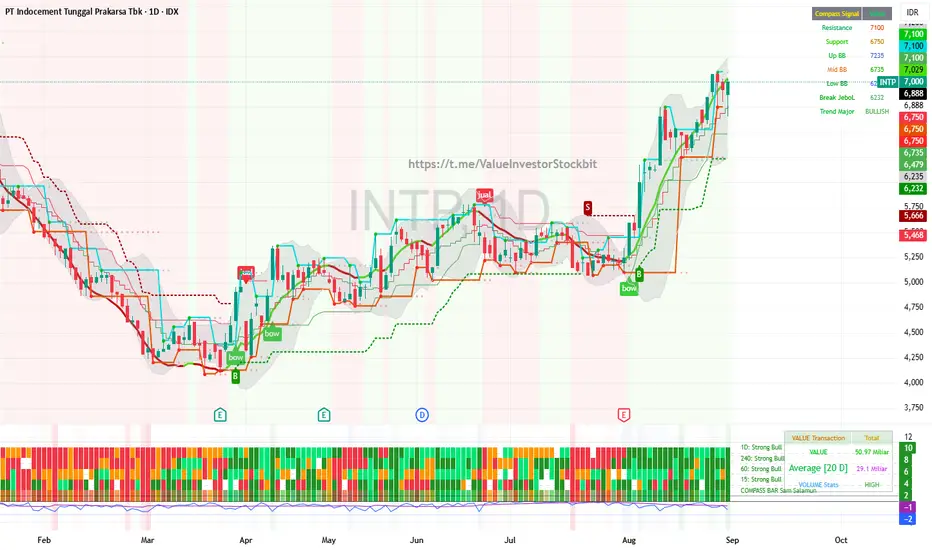
INTP masih strong bullish, stay HOLD sampai muncul signal sellINTP is still strongly bullish, stay HOLD until a sell signal appears.
For those who don't have one yet, consider an automatic buy in installments of 6650-6800
PENDLE Buy Prices For a DCA Strategy & Fib Take Profit TargetsPENDLE is a great coin for this Bull run, which I think can easily push up to $10 - $20.
In this video, I cover where I'm placing limit buy orders below to dollar cost average in and build a bigger position, while lowering my overall cost.
Then we'll look at a few reasons why, showing that PENDLE is oversold and likely to push higher here, and into AltSeason.
I'm also sharing my 4 Take Profit Targets of $7 (Previous ATH), and the Fib Targets of $10 (F1.618), $15 (F2.618) and $20 (F3.618) as well as hold a Moonbag in case Pendle Moons!
We're up 70% on PENDLE already since recommending it in July and expect higher targets in the coming weeks and months, into the Bull Peak.
What are your thoughts and comments?
- Brett

LTC in a bullflag LTC is creating a bull flag to finally get to the breakout. This move shall bring LTC to the resistance and allow its price to break it with lower volatility. A breakout with low volatility is the best thing that can happen so that PA can accelerate once the resistance is broken and we get the volume. IMO, over the weekend we will see important PA to the upside.

8/28/2025 Trade review 8/28/2025 SPX trade review .. Nive push up at the open and then rejection down to fill previous day gap. Bounce at support and opening range breakout to make new ATHs
