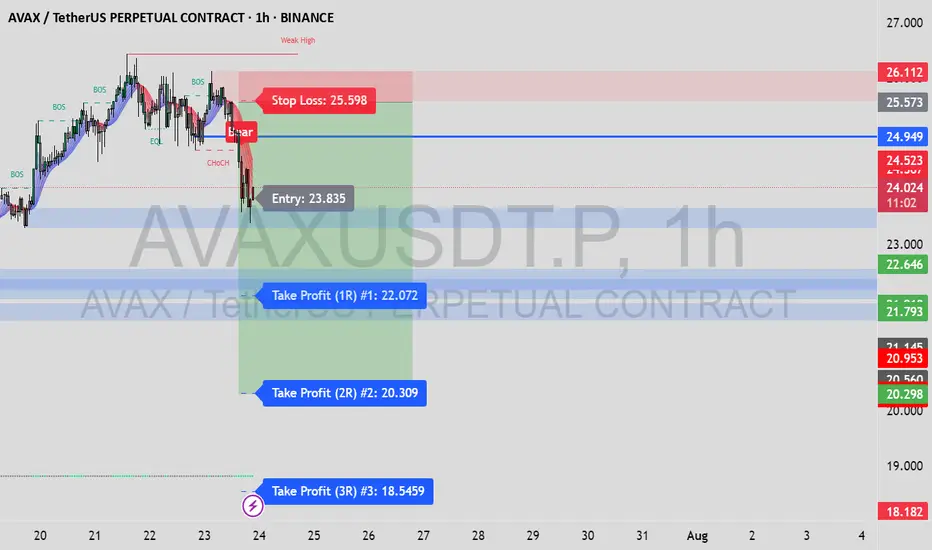
AVAXUSDT.P – High-Risk/Reward Short Setup | Smart Money Play (1H📉 AVAXUSDT.P – High-Risk/Reward Short Setup | Smart Money Play (1H)
🔍 Trade Type: Short
🕐 Timeframe: 1-Hour (1H)
📊 Entry Trigger: Change of Character (CHoCH) after Equal Highs
🎯 Target: 20.298
🛑 Stop Loss: 25.573
💰 Risk/Reward Ratio: 9.79
📌 Trade Breakdown:
This AVAX short was taken based on Smart Money Concepts, using a combination of liquidity structures and market psychology:
✅ Key Confluences:
Equal Highs (EQL) formed above internal structure – clear inducement/liquidity pool.
CHoCH confirmed as price broke below a major internal low → bearish intent confirmed.
Retracement into Bearish Order Block in the Premium Zone offered an optimal entry.
Strong follow-through from institutional selling after liquidity grab.
🧠 Why I Took This Trade:
This setup offered a clean narrative:
Liquidity above = taken
Internal structure = broken
OB in premium = respected
Imbalance/fair value gap below = price magnet
This alignment made it a high-confluence short with an excellent R:R ratio.
🎯 Target Zone (20.298–20.953):
This area contains unmitigated demand and prior support. I anticipate price to:
Tap into this zone to rebalance price inefficiency
Potentially react from there (watch for reversal setups)
⚠️ What I'm Watching:
Possible reaction around 21.793 support – consider partial profits
Maintain awareness of higher timeframe trend (H4/D1)
Volume shift or bullish CHoCH may signal exit before TP
Contains IO script
EUR/USD Set to Fly – Don’t Miss This Perfect Channel Breakout!Hi traders!, Analyzing EUR/USD on the 30-minute timeframe, we can observe that price is respecting the ascending channel and reacting to the dynamic trendline support (green dashed lines). A recent bounce suggests a potential bullish continuation within this structure.
🔹 Entry: 1.17399
🔹 Take Profit (TP): 1.17640
🔹 Stop Loss (SL): 1.17056
Price remains above the 200 EMA, confirming a bullish environment. The bounce aligns with the lower boundary of the channel and follows a short consolidation period, indicating buying pressure. The RSI also shows signs of recovery after approaching oversold levels, supporting the idea of upward momentum.
This long setup offers a favorable risk/reward ratio and aims to capture continuation toward upper channel resistance.
⚠️ DISCLAIMER: This is not financial advice. Trade at your own risk and always use proper risk management.

Tariffs incoming...July 23: Markets are booming.
August 1st: Tariffs.
I'm just saying, it might be a nice discount...
#market #finance #tariff #trump #crypto #forex #stocks #economy #trading
Gold going for ath again?Im looking for another long on gold! Dollar is dumping so gold should go up.. right? If it close above 3431 my long will be entered! So i will be sitting on my hands till than!

GME Stop Bullish Watching for a pullback and entry or a break over the last resistance and re-test and an entry to fill the gap up. (Not financial advice, just posting my thoughts and plan)

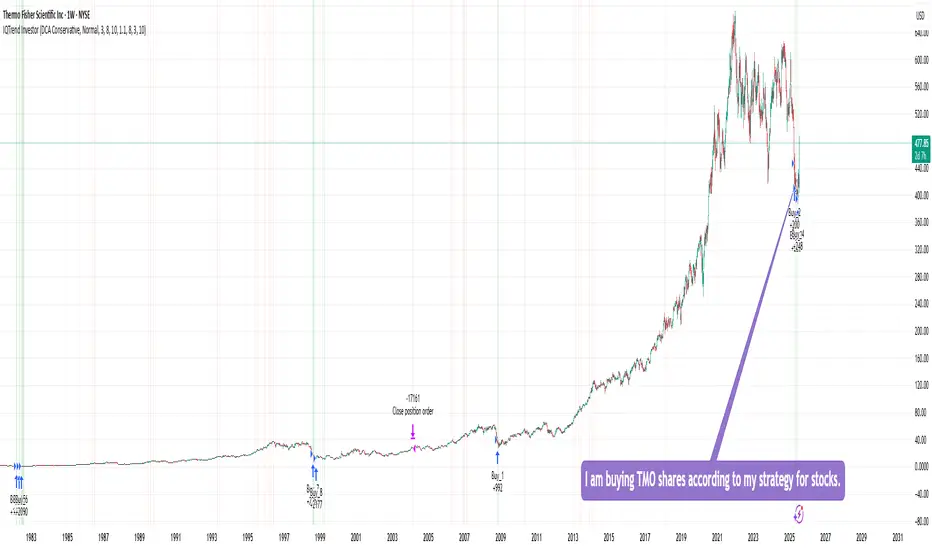
Buying TMO sharesI am buying TMO shares according to my strategy for stocks, ETFs, and precious metals.
This strategy shows 100% performance on this stock on a weekly timeframe. Therefore, I am investing a small percentage of my deposit in it and will wait for it to perform. I hope that everything will work out this time too :)
Of course, the price may go even lower, but I will buy more if the strategy shows a buy signal. In the long run, I think there will be an excellent profit.
DYOR
Potential 14% Gain in CLANKER/USD PairUsing Dual Time Frame (1HR and 5HR charts), we can see that the 5HR chart shows custom indicator, Data Distribution with Extreme Clusters in extreme price (overextended to the downside), as shown by the yellow dots. This is also shown using the shorter time frame of 1HR as shown with yellows dots as well.
Also, another custom indicator, Zero-Lag USI Quantum Pulse PRO has changed on 1HR chart to green background, showing an entry point. Also, Zero-Lag USI shows confluence on the 5HR chart as the background changed from red to black, showing a potential change in momentum.

PAGE INDUSTRIES - ready to fly ?? looking strong on hourlyPAGE INDUSTRIES----HOURLY counts indicate Excellent bullish wave structure.
Both appear to be optimistic and this stock invalidation number (S L) wave 2 low
target short / long term are already shared as per charts
correction wave leg seems completed (C)
Investing in declines is a smart move for short/ long-term players.
Buy in DIPS recommended
Long-term investors prepare for strong returns over the next two to five years.
one of best counter
Every graphic used to comprehend & LEARN & understand the theory of Elliot waves, Harmonic waves, Gann Theory, and Time theory
Every chart is for educational purposes.
We have no accountability for your profit or loss.

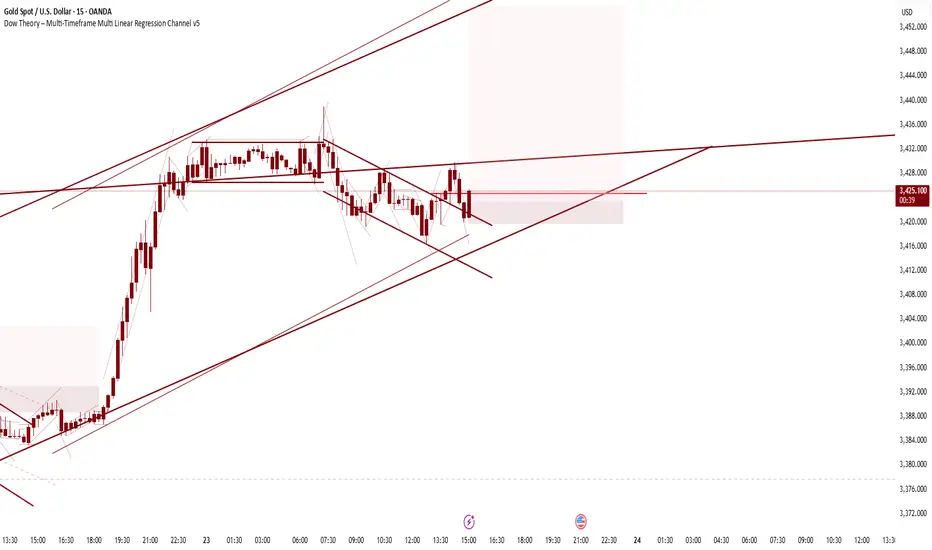
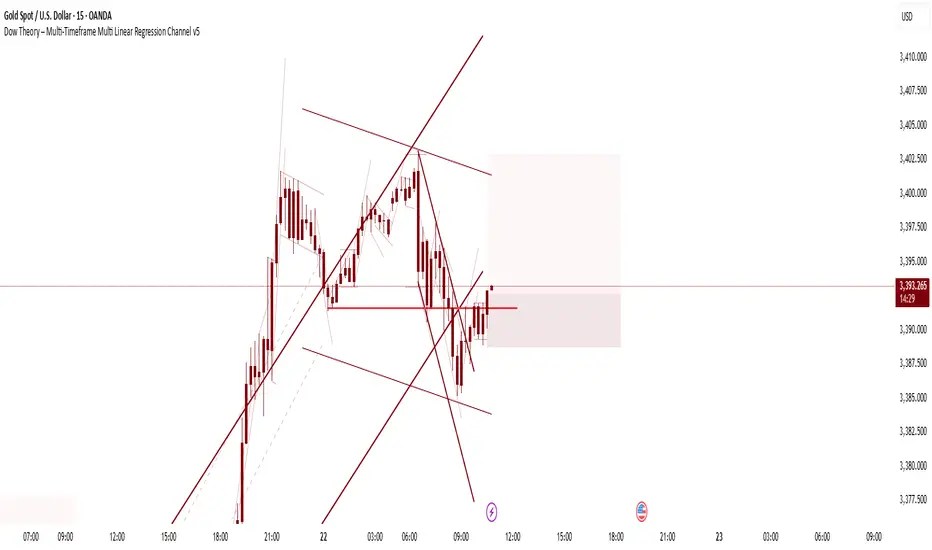
LONG XAUUSDI observe that the overall trend is up — both the secondary and primary trends are bullish. This pullback has created a failed swing high but hasn’t formed a new lower low, and price has now entered a value zone for buying.
I'm waiting for this candlestick to break the minor trend, which would provide bullish confluence across the primary, secondary, and minor trends according to Dow Theory
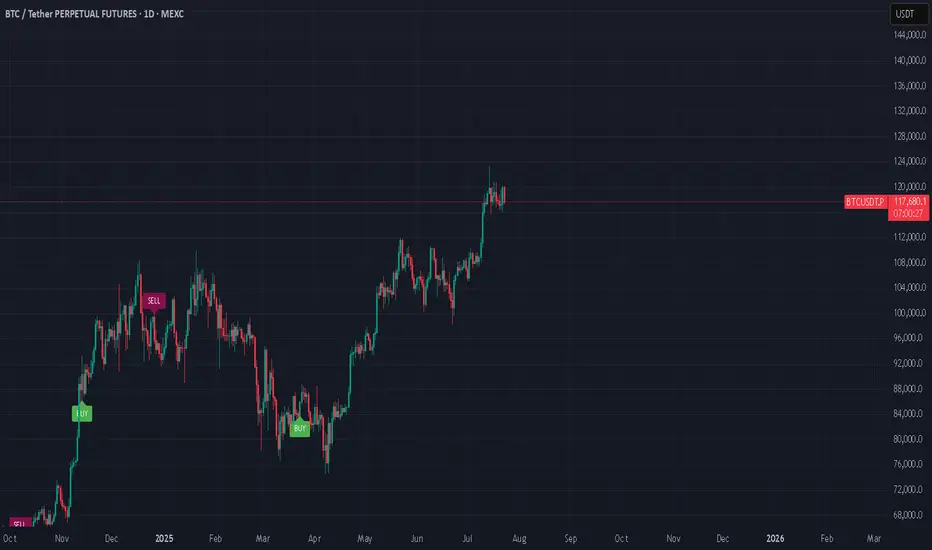
Bitcoin is OverheatedI’m observing the current situation in the BTC market and want to share a brief reflection. The latest upward impulse doesn’t just look confident—it’s starting to resemble overheating.
The price has detached from its averages, and the movement is accompanied by local euphoria. I see the community piling in “at the highs,” hoping for continuation. But it’s crucial to understand: markets don’t grow forever. Especially when the growth lacks proportional volume and fundamental support.
I use a comprehensive technical approach, and one of my indicators has given a clear signal—the market is overheated. We’re currently seeing a classic state of overbought conditions: the price is moving too far, too fast.
This doesn’t mean you should immediately short or panic. But as a trader, I understand that in such a phase, it’s wiser to:
– Partially take profits,
– Move stops closer to the market,
– And absolutely avoid entering new longs on emotions.
Typically, after such surges, the market either consolidates or corrects by 10–20% to shake off the overheating and provide an opportunity to enter at fairer levels. Personally, I’m waiting for a return to balance and a reset. I don’t rule out a final “explosive” move upward on news, but such breakouts usually end as quickly as they begin.

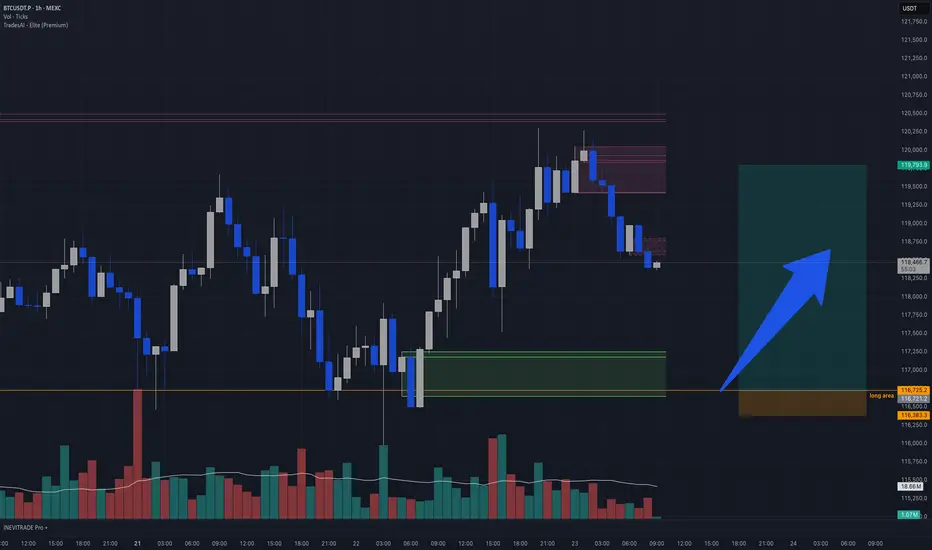
BTC intraday long idea BTCUSDT Intraday Idea | 1H Chart
Price recently pushed into a key supply zone and is now pulling back after a strong impulsive move. The highlighted green box marks a demand block or breakout origin, with confluence from high volume and previous rejection.
🟩 Long Area:
116,725 – 116,300
This area acted as a bullish breaker and low-volume node. Price previously wicked deep into this zone before a strong bullish push, suggesting unfilled orders remain. If price retests this zone, a reaction is likely.
Reason for Entry:
• Strong displacement from demand
• Price forming lower highs into potential mitigation
• Decreasing sell volume on the pullback → signs of absorption
• Clean R/R with tight invalidation
📉 Short-term Sell-off:
This retracement is likely a liquidity grab or order block mitigation, pulling into the long zone to refill institutional orders.
📈 Target Zone:
119,750+ – aligned with recent inefficiency and prior high.
Title: Buy Trade Strategy for ACH: Powering the Future of CryptoDescription:
This trading idea highlights ACH, the native token of the Alchemy Pay ecosystem, a project focused on bridging the gap between fiat and crypto through seamless payment solutions. ACH enables fast, low-cost transactions and supports real-world utility by integrating with global merchants and payment gateways. With partnerships spanning major platforms and growing adoption in Asia and beyond, Alchemy Pay positions itself as a key player in driving cryptocurrency adoption for everyday use. The project’s mission to enable crypto-to-fiat conversions for businesses and consumers gives ACH strong utility and growth potential.
Still, the crypto market remains highly volatile, and the value of ACH can be influenced by global economic trends, competition, regulatory frameworks, and evolving market sentiment. Like all digital assets, ACH carries risks that must be carefully considered.
Disclaimer:
This trading idea is for educational purposes only and should not be considered financial advice. Investing in cryptocurrencies such as ACH involves significant risk, including the potential for total capital loss. Always perform your own research, assess your financial situation, and consult a licensed financial advisor before making investment decisions. Past performance is not indicative of future results.

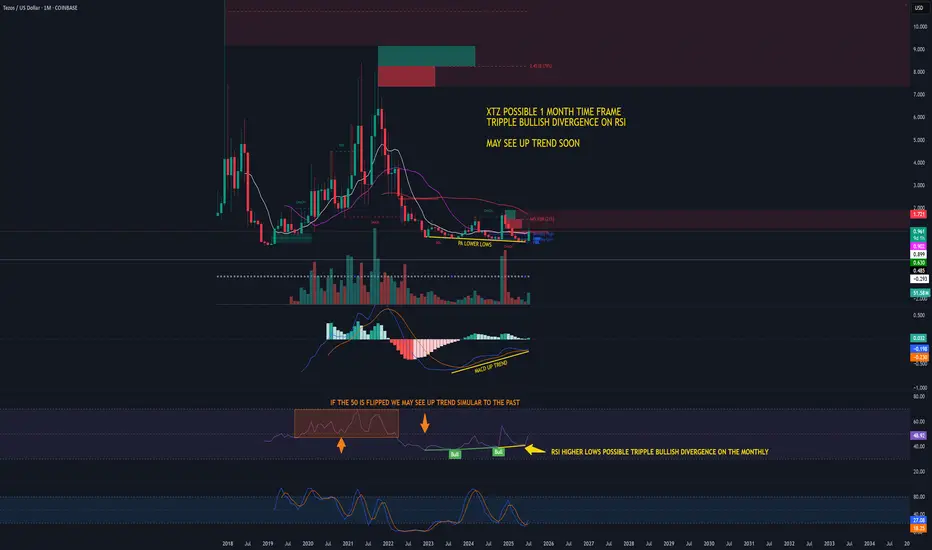
XTZ bullish ideaXTZ possible 1 month triple bullish divergence on RSI. Possibly a good one to keep an eye on, may see higher lows soon.
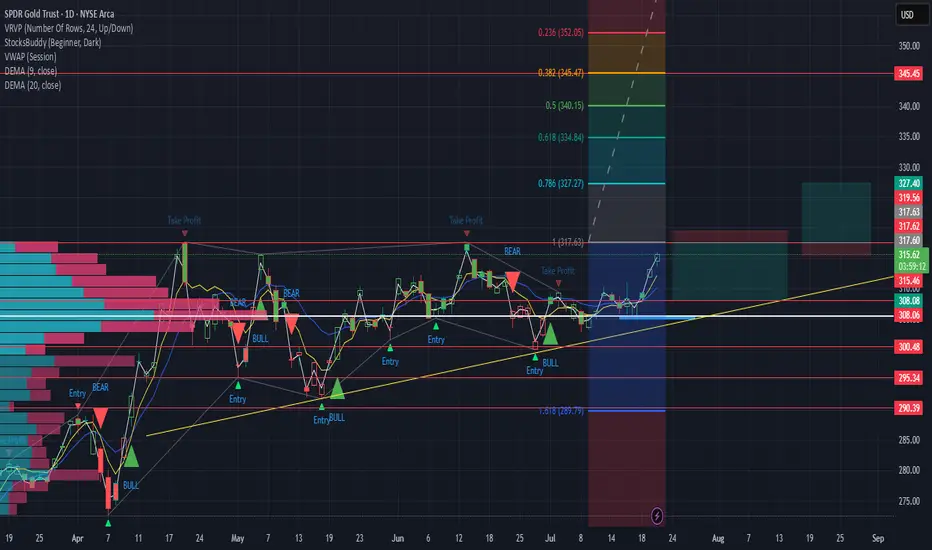
GLD up or down plan OK, tell me if this makes sense. if it rejects off of the 317.60ish area i would trade back to the down side to $308.10 ish - 4.80 R/R. If it breaks out and retests I would be trading to 327 area. 4.5 R/R - Let me know what you see and your thoughts. i'll try to share what i did.
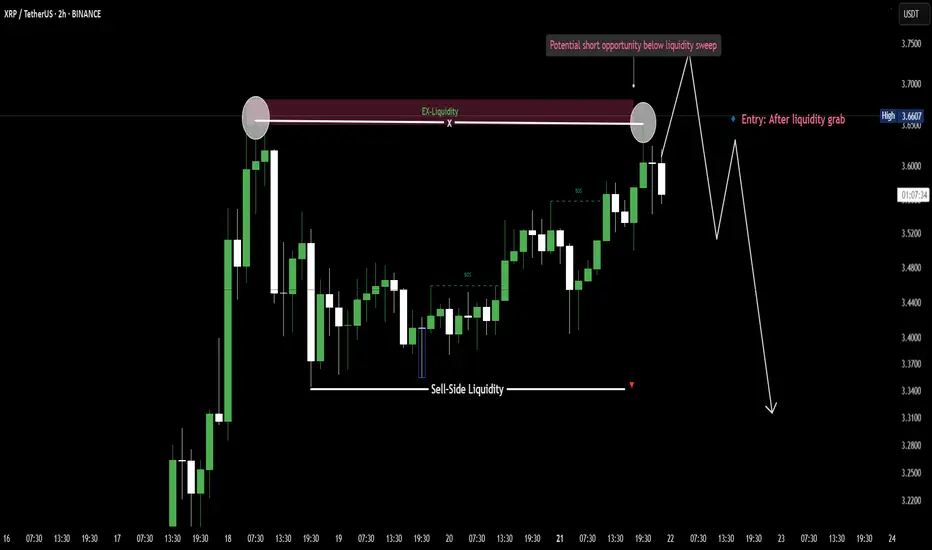
Double Top = liquidity trap?XRP formed a clear double top, tapping into external liquidity.
Price swept the highs, triggering stop hunts above resistance.
A Break of Structure (BOS) confirms bearish intent.
Expecting a sell-off toward the $$ liquidity zone below. 📉
Its a NIO thingin 2025 we made a run on the 2024 lows- is this indication of further lows to come or have we reached a tilting point. My thesis looks at the bull case, with the engineered equal lows representing a trap play - both for excited early buyers and greeds bears.
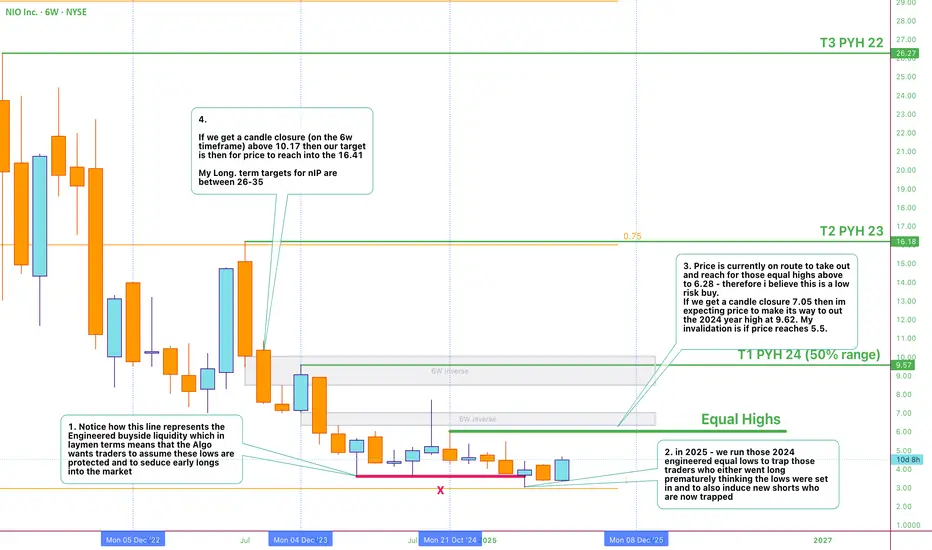

Nio - Best caseHere my best term scenario on Nio
We may have bottomed out as we have started to see bullish price action but tread with caution. once we have candle closure on weekly above that weekly breaker block i am looking ath this level to be our launchpad higher with the best case; is that we reach our long term target between 25-37

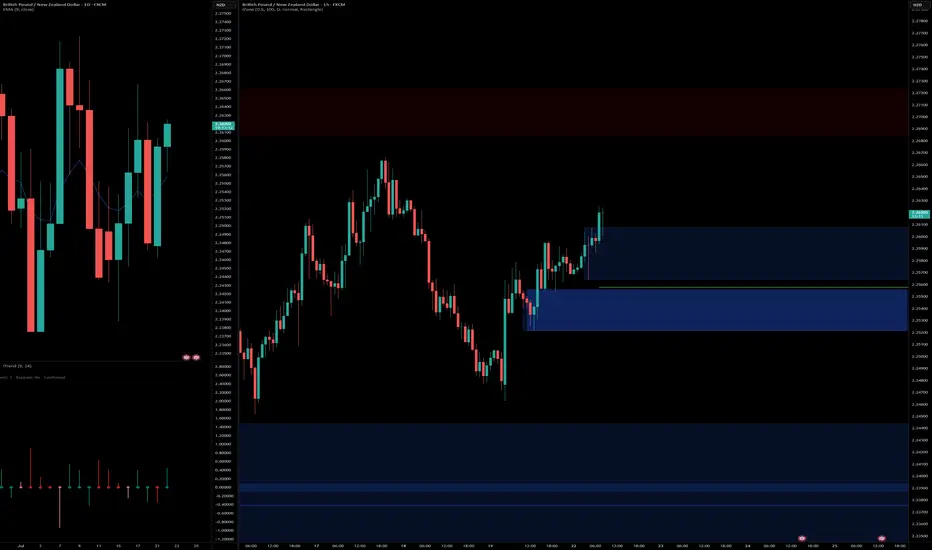
gbpnzd long idea Buying from fresh demand zone after bullish structure break.
Daily showing strong momentum, 1H confirms continuation with clean break and retest zone.
📍Entry: Demand zone
🎯 Target: 2R
🛑 SL: Below demand zone
Risk-Reward: Favorable setup aligning with higher timeframe bias.
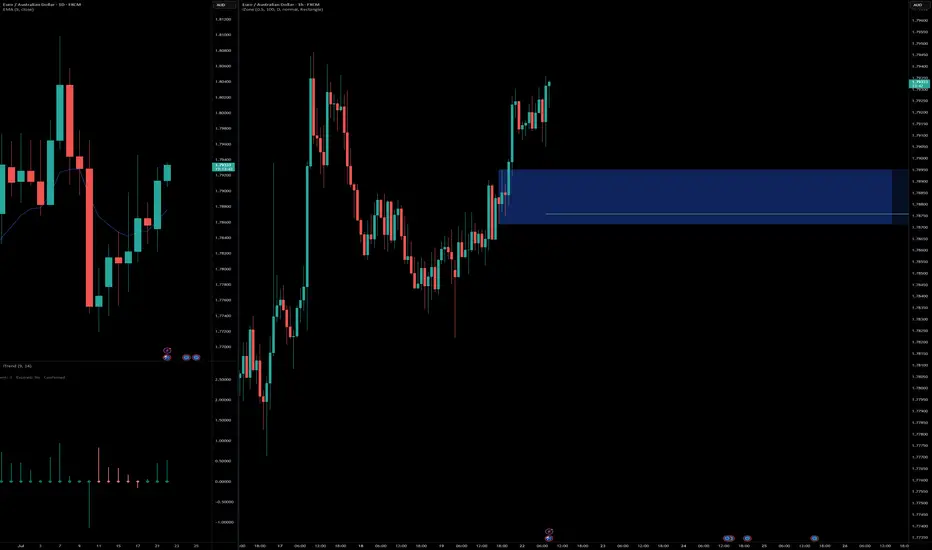
euraud long ideaBuying from fresh demand zone after bullish structure break.
Daily showing strong momentum, 1H confirms continuation with clean break and retest zone.
📍Entry: Demand zone
🎯 Target: 2R
🛑 SL: Below demand zone
Risk-Reward: Favorable setup aligning with higher timeframe bias.
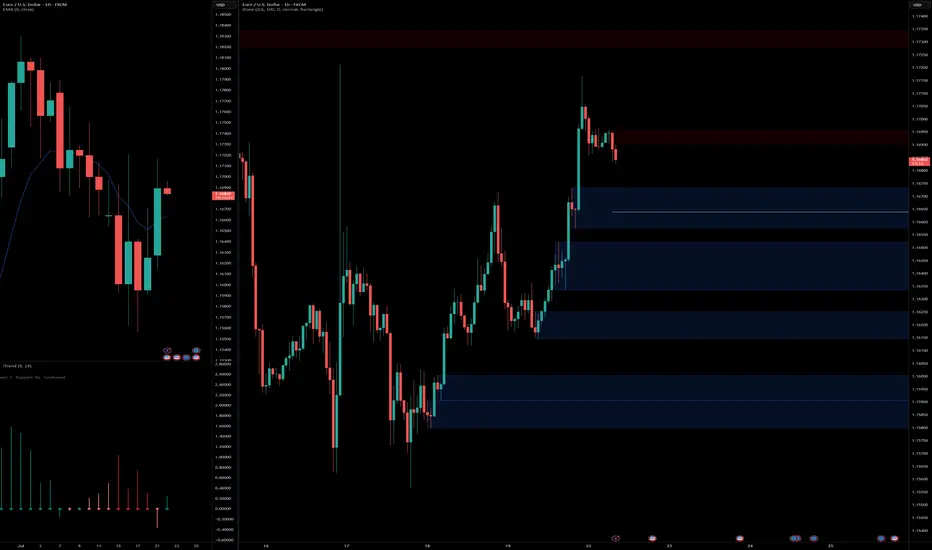
eurusd lopngBuying from fresh demand zone after bullish structure break.
Daily showing strong momentum, 1H confirms continuation with clean break and retest zone.
📍Entry: Demand zone
🎯 Target: 2R
🛑 SL: Below demand zone
Risk-Reward: Favorable setup aligning with higher timeframe bias.
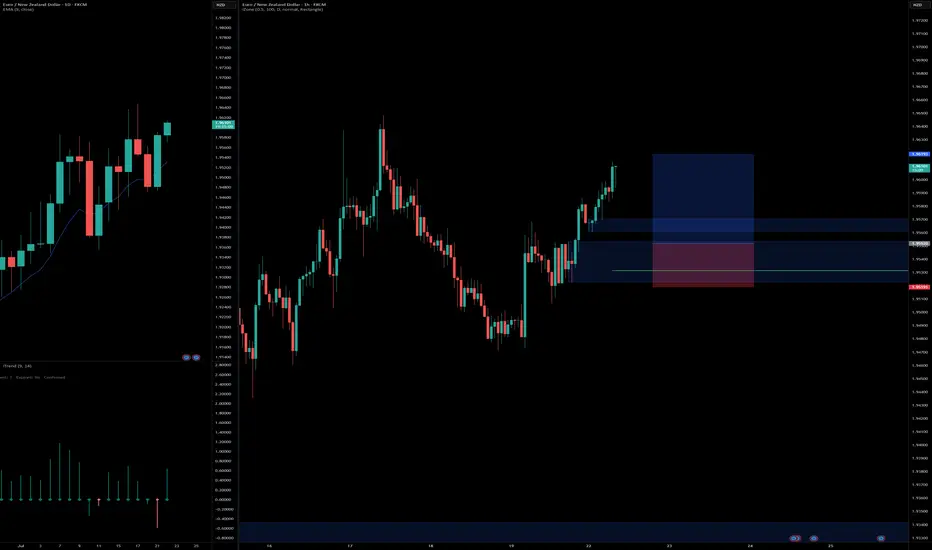
EURNZD long setupBuying from fresh demand zone after bullish structure break.
Daily showing strong momentum, 1H confirms continuation with clean break and retest zone.
📍Entry: Demand zone
🎯 Target: 2R
🛑 SL: Below demand zone
Risk-Reward: Favorable setup aligning with higher timeframe bias.
#trading #forextrading #EURNZD #priceaction #smartmoney #demandzone #tradingsetup #forexanalysis