CopperXCUUSD
- Fair Value Gap
- Demand Zone
- Fibonacci Level - 61.80%
- Order Block
- Completed " 12345 " Impulsive Waves
Copper

XAGUSD: $70 support breakdown setup🛠 Technical Analysis: On the 4-hour chart, silver (XAGUSD) is reversing from its recent peak and attempting to advance toward a key support zone near 70.0. The SMA50 is currently acting as support. The chart suggests a more reliable selling opportunity will only arise after a confirmed break below 70.0, which would signal a continuation of the bearish trend. In this case, the next bearish magnet would be the noted support at 64.515 (near the SMA200).
———————————————
❗️ Trade Parameters (SELL)
———————————————
➡️ Entry Point: Sell on a confirmed breakdown below 70.0 (approx. 69.887 – 70.00)
🎯 Take Profit: 64.515
🔴 Stop Loss: 75.276
⚠️ Disclaimer: This is a potential trade idea based on current analysis; market conditions and price direction are subject to change based on news factors and volatility.

Venezuela: The "Blue Gold" Heist (It’s Not Just Oil)If you rode the Western Digital ( NASDAQ:WDC ) trade with me, you saw what happens when the market realizes AI needs Space. We caught the bottom on WDC because the infrastructure trade was obvious. (See related idea: The Vault of the AI Era)
But the "Supercycle" doesn't stop at Storage. It goes deeper. From Bytes (Software) ➡️ to Atoms (Raw Materials).
1. The "Blue Gold" Thesis 🇺🇸🇻🇪 Everyone is debating the oil politics of the US & Venezuela. They are missing the Tech Angle. Venezuela sits on the Orinoco Mining Arc, home to massive reserves of Coltan ("Blue Gold") and Rare Earths.
The Reality Check: You cannot build an NVDA GPU, a WDC hard drive, or a TSLA robot without these minerals. Coltan is the "blood" of the electronics industry.
The Pivot: The US "Reconstruction" effort isn't just charity. It is a strategic move to secure the physical supply chain of the AI era. They are breaking the monopoly on critical tech inputs.
2. The "Hard Asset" Rotation 🔄 Smart Money is rotating from "Overvalued Tech" to "Undervalued Resources."
Silver ( NASDAQ:XAG ): The ultimate "Hybrid." It wins twice—once on inflation (Venezuela spending), and again on the massive industrial demand for the AI grid. (See my "Curse Broken" analysis)
Gold ( TVC:XAU ): The Liquidity Sponge. If they print money to rebuild, Gold goes up. Simple math.
3. The Chart: The REMX Breakout 📉 I marked up the Weekly Chart of the Rare Earth ETF ( AMEX:REMX ) because the geometry is too clean to ignore.
The Wedge: We just broke out of a multi-year Falling Wedge (Blue Channel). In my experience, this is the "Terminator" of bear markets.
The Floor: We are bouncing perfectly off the Green Support Zone ($50-$60). The "Peak Fear" is in.
The Trade: While Tech is at All-Time Highs, the inputs for Tech are at multi-year lows. That is the opportunity.
REMX 1D:
👇 The "Physical AI" Watchlist: We are playing the Supply Chain, not the noise.
The Brains: NASDAQ:NVDA (Compute)
The Vault: NASDAQ:WDC (Storage Infrastructure)
The Atoms: AMEX:REMX , NYSE:MP (Rare Earths)
The Hedge: TVC:SILVER , TVC:GOLD , $
The Question: We all own the Chips ( NASDAQ:NVDA ). But be honest—do you own a single ounce of what the chips are actually made of?
Disclaimer: Just sharing my read on the macro supply chain. Not financial advice.

XAUUSD: short-term opportunities🛠 Technical Analysis: On the H4 chart, Gold (XAUUSD) remains in a broader uptrend, but the latest swing shows a rejection from the rising resistance line, followed by a sharp pullback and consolidation. Price is now rotating back toward the key horizontal support zone around 4,350–4,365, where another test could trigger a bearish continuation move. The SMA50 and SMA100 are acting as dynamic “decision” levels, while the SMA200 aligns closely with the first downside objective. A confirmed breakdown below the 4,350 area opens the path toward 4,246.67, with the marked medium-term support area near 3,900 as an extended target.
———————————————
❗️ Trade Parameters (SELL)
———————————————
➡️ Entry Point: Sell on a confirmed breakdown 4,350–4,365 support zone (approx. 4,365.78)
🎯 Take Profit: 4,246.67 (the first target), medium-term extension toward the support area near 3,900
🔴 Stop Loss: 4,484.90
⚠️ Disclaimer: This is a potential trade idea based on current analysis; market conditions and price direction are subject to change based on news factors and volatility.

COPPER - The Metal No One Is Talking About… YetCopper just did something important, it broke above its previous all-time high. That alone puts it back on the radar from a macro perspective.
Structurally, the trend is clearly bullish. Price is respecting the rising trendline, and what we are seeing now is a normal post-breakout reaction, not weakness.
The plan from here is simple: 👇
i will be watching the intersection of the rising trendline and the prior structure zone. That confluence is where risk becomes defined and where trend-following longs make the most sense.
As long as price holds above structure and respects the trendline, the bullish thesis remains intact.
📊 Always follow your trading plan regarding entry, risk management, and trade management.
Good luck! 🍀
All Strategies Are Good; If Managed Properly!
~Richard Nasr

XAUUSD: bullish exhaustion🛠 Technical Analysis: On the 4-hour (H4) timeframe, Gold (XAUUSD) has encountered significant selling pressure after testing the major psychological and technical resistance zone between 4,520 and 4,550. While the pair previously maintained a "Global bullish signal" throughout December, the current price action indicates a structural shift.
The price has decisively broken below the steep diagonal resistance line that guided the recent impulse move higher. Currently, Gold is trading at 4,370, struggling to hold above its immediate support level. Further price pressure on support will lead to a breakout, a scenario that should be expected after the New Year holidays.
———————————————
❗️ Trade Parameters (SELL)
———————————————
➡️ Entry Point: Sell on breakdown of current support (approx. 4,336.58)
🎯 Take Profit: 4224.40 (Support)
🔴 Stop Loss: 4,411.82
⚠️ Disclaimer: This is a potential trade idea based on current analysis; market conditions and price direction are subject to change based on news factors and volatility.

COPPER IS PRIMED AND READYSo this decade precious metals have finally shown volatility. Gold and Silver have been a highlight especially with the past Administration boasting EV, GREEN-NEW DEAL, and now with AI; Precious metals are showing that people as of right now prefer a physical safe haven asset rather than “code” like cryptocurrency. Even now with the Trump administration, space exploration and the ongoing need and increasing demand for more precious metals is obviously making these assets worth looking at BUT one metal that stands out the most but no one is talking about, is COPPER (CU)!
COPPER is by far primed and ready to show what its really made of. Often overlooked, with pennies being disclosed as being “worthless,” it takes more to produce 1 penny than what its actual value is, with only 2-4% of modern day pennies being made of Copper (CU) and 96%+ being zinc and other over supplied metals. Why?
By 2026 the US Government will stop printing pennies, and any 1 cents transactions will now be rounded to the nearest Nickel.
Gold and Silver showed similar chart patterns, and experienced almost the same innovations that lead to its increase demand thus leading to price being bullish as well. One thing that leads me to believe COPPER IS VERY UNDERVALUED is the FACT that silver mining and gold mining can be done by basically any individual with an increased appetite to fund a business venture of 1mil+, and in this day and age thats more common than you think. But copper mining takes at least 10times more money, and it takes at least 15 years to get a Copper Mine up and ready before you start to dig your first ore. With that being said, and the fact that most copper mines if not all of them up to unow, are starting to show depletion…. its TIME.
Technical analysis is easy here, basic trend and resistance/support and price action on the monthly outlook. This asset will be like when your daddy or great granddaddy bought gold cheap!


Gold/Copper Signaling Recession & Market Super bubble!We're continuing to see extreme signals from Gold, and that should raise concerns.
Earlier, I highlighted the Gold/Oil ratio — now, I want to draw your attention to the Gold/Copper ratio:
🔗
Historically, such extreme readings in the Gold/Copper ratio have consistently preceded recessions. The only exception? A period of economic stagnation and sideways markets — not exactly a bullish outcome. See the chart from 2014 to 2016
🔗 www.tradingview.com
Quick recap:
Gold = Fear + Inflation hedge
Copper = Economic strength + Inflation signal
Oil = Similar to Copper; reflects growth and inflation expectations
These divergences aren't random — they’re warning signs of a recession & market Super Bubble that's about to POP!
These are not random fluctuations of prices. You can choose to view them as such. I get it. But from a macroeconomic perspective, this is bad JUJU!
Capitalism without failure is like religion without hell! Remember that!
Click boost, like, and subscribe! Let's get to 5,000 followers! ))

COPPER ~ TECHNICAL. 2H.Exiting this current channel may be accompanied by a significant price change...
So, we may have an eye on this after we buy or sell. but strongly.

IE | Copper Companies Are Going Parabolic Soon | LONGIvanhoe Electric, Inc. is a minerals exploration and development company which focuses on developing mines from mineral deposits. Its projects include Santa Cruz Copper and Tintic Copper-Gold Projects. It operates through the following segments: Santa Cruz Project, Critical Metals, Data Processing, and Energy Storage. The Santa Cruz Project and Critical Metals segment handles mineral project exploration and development with a focus on identifying and developing mineral projects, and ultimately mines, associated with the metals necessary for electrification. The Data Processing segment provides data analytics, geophysical modeling, and artificial intelligence services for mineral, oil and gas, and water exploration industries. The Energy Storage segment develops, manufactures, and installs vanadium flow batteries for grid-scale energy storage. The company was founded on July 14, 2020 and is headquartered in Tempe, AZ.

XAGUSD: breakout of the support trend line🛠 Technical Analysis: On the 4-hour timeframe, Silver (XAGUSD) has been in a sustained bullish rally, characterized by a well-defined Support trend line that has successfully propped up price action since late November. However, the pair has now reached a critical Resistance zone between $65.70 and $67.00.
The price action is currently showing signs of exhaustion at this peak, as it struggles to break higher. The analytical projection suggests a breakdown of the support trend line, which would trigger a corrective move toward the horizontal support levels below. A shift in momentum is expected as the price moves away from the overextended resistance toward the $58.50 target.
———————————————
❗️ Trade Parameters (SELL)
———————————————
➡️ Entry Point: Sell on the break of the Support trend line (approx. $64.68 - $65.72).
🎯 Take Profit: $58.496 (Support).
🔴 Stop Loss: $67.775 (Above the current resistance zone).
⚠️ Disclaimer: This is a potential trade idea based on current analysis; market conditions and price direction are subject to change based on news factors and volatility.

CopperXCUUSD
- Head and Shoulder as an corrective pattern in Short Time Frame
- Break of Structure
- Demand Zone
- Fair Value Gap
- Buy Side Liquidity

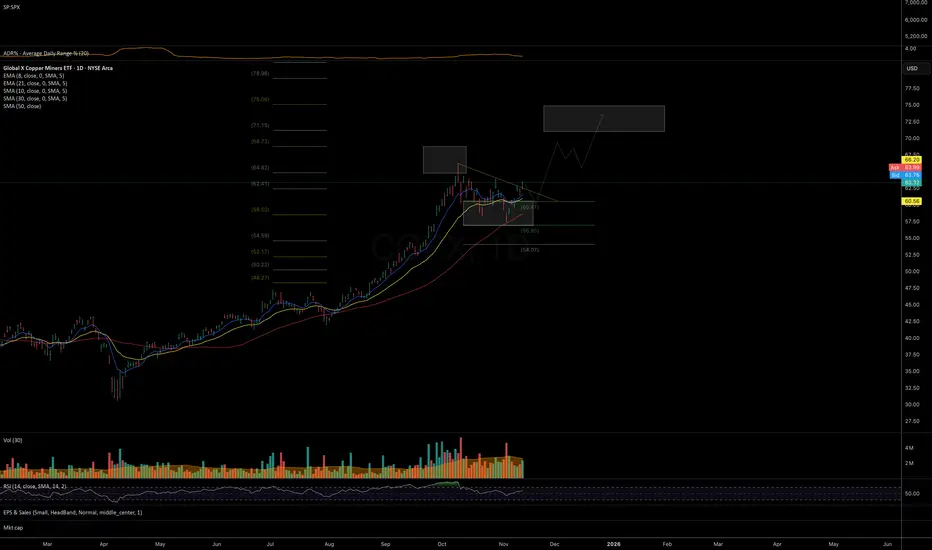
COPX: watching for upside momentum to continue Price is reacting constructively from the ideal mid-term support area established at the November bottom.
The trend structure suggests potential for at least one more leg to the upside into the 71–75 resistance zone, as long as the November lows continue to hold.
Chart:
USD/CLP Plunges: Kast Victory & AI Copper BoomMarket Reaction to Political Shift
The Chilean peso has surged following José Antonio Kast’s decisive presidential victory. Markets reacted instantly to the news. The USD/CLP exchange rate dropped to 913.58, strengthening significantly against the dollar. Kast secured 58% of the vote in the December 14 runoff. This marks Chile’s sharpest shift to the political right in decades. Investors view his platform as highly business-friendly. Consequently, capital inflows have accelerated, driving the peso’s value upward. The local stock index, S&P CLX IPSA, also hit record highs. Financial markets clearly favour this new political direction.
Geopolitics and Geostrategy: A New Stance
Kast’s victory signals a major geostrategic pivot for Chile. He campaigned on strict border controls and mass deportations. This focus on security addresses voter frustration with rising violence. However, these policies carry geopolitical risks. Aggressive border measures could strain diplomatic relations with neighbouring countries. Geostrategically, a stable Chile attracts foreign direct investment. Yet, potential social tensions from strict policing could rattle investors later. The administration must balance domestic security with regional stability to maintain market confidence.
Macroeconomics: Fiscal Discipline Returns
The new administration promises aggressive fiscal tightening. Kast plans to cut public spending by roughly $6 billion. He aims to achieve this by eliminating "political waste." This contrasts sharply with the previous administration's approach. Critics argue these cuts endanger social programs like state pensions. Supporters view them as essential for economic health. This proposed fiscal discipline reduces the risk of sovereign debt expansion. Consequently, bond yields have compressed, and credit risks have lowered. Markets interpret these moves as positive for the Chilean peso’s long-term stability.
Industry Trends: The AI and Copper Connection
Global technology trends are inadvertently boosting the Chilean peso. The Artificial Intelligence (AI) boom requires massive data processing capacity. Building data centres demands significant amounts of copper. Chile is the world’s leading copper exporter. Copper prices have rallied to near $12,000 per tonne due to this surging demand. Supply bottlenecks further drive up prices. This "science of scarcity" directly benefits Chile’s trade balance. High-tech industries effectively subsidise the Chilean peso through their raw material needs.
Technology and Innovation: Powering the Future
The intersection of high-tech innovation and mining is critical here. Clean energy infrastructure also relies heavily on copper. As patents for green technologies expand, copper demand grows structurally. Projections indicate this investment cycle will persist for years. This provides a long-term floor for the peso. The mining sector may see increased demand for advanced extraction technologies. Innovation in mining efficiency will be key to meeting global supply needs. Chile sits at the centre of this technological resource war.
Leadership and Business Models
Kast proposes a CEO-style approach to governance. His "emergency" government aims to slash bureaucracy and jump-start growth. He plans to deregulate key sectors and lower taxes. This suggests a shift toward neoliberal business models in government operations. However, management challenges loom. Kast lacks a congressional majority. He must build cross-party coalitions to pass laws. Leadership success depends on negotiation, not just executive orders. Failure to unite Congress could dilute his ambitious economic reforms.
Technical Analysis: Key Levels to Watch
Traders should monitor specific technical thresholds for USD/CLP. The 910 level acts as immediate support. Resistance sits between 945 and 965. Momentum indicators currently suggest the peso is overbought. This means the currency might weaken slightly in the short term. Global factors are expected to resume dominance soon. Once the "election euphoria" fades, U.S. interest rates will drive the pair. Traders must remain vigilant for a potential reversal.
Conclusion: A Delicate Balance
The USD/CLP outlook remains cautiously optimistic. Kast’s win provides a short-term confidence boost. Simultaneously, the global AI boom supports copper prices. These factors combine to strengthen the Chilean currency. However, governance risks persist due to a divided Congress. The administration faces a difficult balancing act between reform and social stability. For now, the trend favours the peso, but volatility remains a threat.

Copper price predictions from Wall Street Citi forecasts copper reaching USD 13,000 per tonne in early 2026, with a potential move to USD 15,000 by the second quarter, driven by energy transition and AI related demand.
ING also expects higher prices, with its outlook targeting USD 12,000 per tonne in the second quarter of next year.
Deutsche Bank points to supply constraints as a key driver, describing 2025 as a highly disrupted year for mining. The bank sees the market in clear deficit, with the tightest conditions in late 2025 and early 2026, and peak prices in the first half of 2026.
J.P. Morgan thinks demand from China will eventually come into play, too, noting signs of growing pressure on smelters to secure raw material. The bank expects prices to reach USD 12,500 per tonne in the second quarter of 2026, averaging around USD 12,075 for the year.

XCU/USD: Will This Demand Zone Hold for Bulls?🎯 XCU/USD: The Great Copper Heist Strategy | Multi-Layer Entry Setup 💰
📊 Asset Analysis
Copper vs U.S. Dollar (XCU/USD) - Metals Market
Strategy Type: Swing/Day Trade Hybrid
Market Bias: 🐂 BULLISH CONFIRMATION
🔍 Technical Setup Overview
The setup shows bullish confirmation with triangular moving averages converging in a demand zone - a classic institutional accumulation pattern. We're seeing strong support structure forming, making this an attractive risk-reward opportunity for multi-layer entries.
🎯 The "Layered Entry" Strategy Explained
This isn't your typical single-entry approach. We're using a multi-limit order layering strategy (what I call the "strategic accumulation method") to build positions gradually:
📍 Suggested Layer Entry Levels:
Layer 1️⃣: $4.9000
Layer 2️⃣: $4.9500
Layer 3️⃣: $5.0000
Layer 4️⃣: $5.0500
Layer 5️⃣: $5.1000
💡 Pro Tip: You can add more layers or adjust based on your account size and risk tolerance. The beauty of layering? You average into the position as price dips, reducing overall entry cost.
🛡️ Risk Management
🚨 Stop Loss: Below $4.8000
This level invalidates the bullish structure and protects capital if the setup fails.
⚠️ Important Disclaimer: The stop loss mentioned is based on this specific analysis. You should always determine your own risk parameters based on your account size, risk tolerance, and trading plan. Take profits at YOUR comfort level - your risk, your rules! 🎲
🎯 Profit Targets & Exit Strategy
Primary Target: $5.4000 🎊
This represents a solid risk-reward ratio from our layered entries.
⚠️ Long-Term Resistance Warning: There's a major resistance zone around $28.00 (historical supply zone acting as a strong barrier + potential overbought conditions). If you're thinking ultra-long term, be aware that this level has trapped bulls before.
💰 Exit Strategy Note: The targets provided are guideline levels. Always manage your own exits based on price action, momentum, and your personal profit goals. Lock in gains when you're comfortable - trading is personal!
🔗 Related Pairs to Watch (Correlation Analysis)
Keep an eye on these correlated assets to confirm the copper move:
HG (Copper Futures) - Direct correlation, primary benchmark
FCX (Freeport-McMoRan Inc.) - Major copper producer, equity proxy
DXY (U.S. Dollar Index) - Inverse correlation; weak dollar = stronger copper
CL (Crude Oil) - Industrial commodity correlation
AUD/USD - Australian dollar heavily tied to copper exports
CNY/USD - China is the largest copper consumer globally
💡 Key Point: If DXY weakens and AUD/USD strengthens while industrial commodities rally, this confirms the copper bullish thesis.
📈 Why This Setup Works
✅ Triangular MA convergence in demand zone = strong technical confluence
✅ Multi-layer entry reduces timing risk
✅ Clear invalidation level for risk management
✅ Favorable risk-reward ratio to first target
✅ Industrial metals showing strength in current macro environment
⚡ Final Thoughts
This is a methodical approach to capturing potential upside in copper while managing downside risk through layered entries. Remember: trading is a marathon, not a sprint. Build positions strategically, manage risk religiously, and let the market come to you.
🎭 Strategy Style Disclaimer
This analysis uses a creative "layered accumulation" approach for educational and entertainment purposes. All trading involves substantial risk of loss. This is not financial advice - trade at your own risk and always do your own research. Past performance doesn't guarantee future results. ⚠️📉
✨ If you find value in my analysis, a 👍 and 🚀 boost is much appreciated — it helps me share more setups with the community!
#XCU #Copper #MetalsTrading #SwingTrading #DayTrading #ForexTrading #CommodityTrading #TechnicalAnalysis #LayeredEntry #RiskManagement #BullishSetup #TradingStrategy #XCUUSD #CopperFutures #MultiLayerEntry

Copper continues to grow!The two price targets I envision on the chart, which indicate continued upward swings, are the powerful candles of the last two weeks that have made it easier to reach these targets in the medium term, and other than time, which requires more patience, I don't see any reason why we won't reach the desired target!

Copper At A Crossroads: Rally Exhaustion Vs Macro RiskCopper just delivered a classic volatility sequence: a blow off into the 5.89 area, followed by a fast 27% flush in six days. Since printing the 4.29 low, price has been grinding higher and is now back into my short entry around 5.40, which is roughly a 26% retrace of the drop. What matters to me here is the structure: we retraced without a clean liquidity sweep above the prior extreme, which keeps the move looking corrective, not a fresh impulse leg.
On the macro side , the tape has been pricing a lot of bullish copper narratives at once. We have seen copper trade at record levels in global benchmarks, with the rally supported by supply risk headlines and policy driven optimism. That is exactly why I am interested in fading the retrace: when supply premium and bullish positioning get crowded, even small shifts in risk appetite can trigger sharp mean reversion. Recent reporting has highlighted how sensitive flows and inventory distribution can become when policy risk enters the picture, which tends to amplify volatility rather than smooth it.
Technically, I am treating 5.40 as the “decision zone” after the rebound. As long as price holds below the prior spike region near 5.89, my base case is a rotation back toward the mid range and ultimately a retest of the 4.29 low. If we reclaim the prior extreme and hold above it, that would invalidate the correction thesis and I would reassess.
Note: Please remember to adjust this trade idea according to your individual trading conditions, including position size, broker-specific price variations, and any relevant external factors. Every trader’s situation is unique, so it’s crucial to tailor your approach to your own risk tolerance and market environment.

Copper Trend Acceleration! LSMA Pullback Supports the Move!🔥 XCU/USD — “COPPER VS U.S. DOLLAR”
🔧 Metals Market Opportunity Blueprint (Day / Swing Trade Edition)
📌 🔵 Market Plan: Bullish Structure Confirmed
Copper continues to showcase strong upside structure, and the LSMA Moving Average Pullback has now confirmed fresh bullish continuation momentum.
The price action is stabilizing above key intraday support, keeping buyers in control while maintaining trend discipline.
🎯 Entry Strategy (Flexible + Layer-Friendly)
You may enter at any price level, depending on your personal plan.
For traders using the Thief Layer Strategy, here are the structured levels:
🔹 Layer 1 → 5.3400
🔹 Layer 2 → 5.3800
🔹 Layer 3 → 5.4200
🔸 (You may extend layers based on volatility and your personal system.)
This layered approach helps average entries while staying aligned with market strength.
🛡 Stop-Loss Zone (Trader-Controlled)
Suggested SL for the thief plan: 5.2800
Dear Ladies & Gentlemen (Thief OG’s), this is NOT a mandatory level — adjust according to:
• Your risk profile
• Your system’s buffer
• Market volatility
Use your own decision-making to secure gains and protect your capital.
🎯 Target Levels (Smart Exit Zone)
Copper is approaching a strong resistance cluster combined with overbought conditions + liquidity trap zones.
So the recommended approach is to escape with profits rather than hold blindly.
🏁 Primary Target → 5.5600
Again, Dear Ladies & Gentlemen (Thief OG’s), this TP is optional — manage exits with your own discipline, risk, and style.
🌍 Related Pairs to Watch (Correlation Guide + Key Points)
🟠 1. XAU/USD — Gold vs USD
Correlation:
• Often moves inversely with USD strength
• Can highlight broader commodity demand sentiment
Why watch it:
• Gold strength can indicate commodity-wide risk-on behavior
• Helps confirm metals sector flows
🟣 2. XAG/USD — Silver vs USD
Correlation:
• Silver and Copper often rise together during industrial demand expansions
Why watch it:
• Strong silver rallies often lead or follow copper momentum
• Helpful for timing metals-based pullbacks and extensions
🟢 3. USOIL / WTI Crude
Correlation:
• Copper responds to global growth expectations — oil confirms economic activity
Why watch it:
• Rising oil typically reflects higher industrial production
• Gives early signals of demand conditions that benefit copper
🔵 4. AUD/USD — Commodity Currency
Correlation:
• Australia is a major copper producer
• AUD is strongly tied to global commodities
Why watch it:
• AUD strength often corresponds with rising metals
• Can help detect early sentiment shifts
🟤 5. DXY — U.S. Dollar Index
Correlation:
• Copper moves inversely with USD
Why watch it:
• Copper rallies strengthen when USD weakens
• A strong DXY can slow or cap copper upside near resistance
Remember:
✅ Trade with layers ✅ Adjust SL/TP to your style ✅ Watch correlated assets
🚀 Let’s catch this move, Thief OG’s!
Like, Follow, and Share if this helps! 💬⬆️🔔
Stay tuned for more high-quality setups.
#Copper #XCUUSD #TradingSetup #MetalsTrading #Bullish #SwingTrade #DayTrade #ThiefMethod #TradingView #Investing #Commodities

Arizona Metals showing positive divergence. This stock has been VERY stretched to the downside and is deeply oversold on the quarterly, monthly and weekly.
As per this chart, positive divergence on the weekly is developing.
If it can break back into the upper orange channel, that would be a great step for this to begin to rebound.
However, those weekly gaps below are concerning. If it breaks below 50 cents, those are definitely in play. Keep an eye on that!!!

BHP holds steady as copper cracksCopper has been on a rollercoaster in 2025. It broke above US$5/lb in May, driven by strong demand signals from China and clean energy projects. Then came the reversal. US tariffs on Chinese copper goods triggered a sharp selloff. Futures dropped more than 20% in days.
Traders reacted to headlines. But the long-term story remains intact.
BHP, one of the world’s largest copper miners, just delivered record output—over 2 million tonnes in FY25, up 8% year-on-year. Its Escondida and Spence mines are performing strongly. Copper is becoming a key pillar of BHP’s future production and revenue.
The stock is currently trading on the ASX near its 200-day moving average, around AU$39. This is a technical and psychological level that often acts as support in long-term trends. It’s a point where value investors typically step in.
The investment case for copper hasn’t changed. Electrification, energy transition, and AI-driven infrastructure will need vast amounts of copper. Supply remains constrained. New projects are few, and development timelines are long.
Short-term shocks create long-term opportunities. The tariff-driven selloff may shake out weak hands, but it doesn’t weaken the structural demand for copper.
BHP offers a cleaner way to invest in the copper story. It has scale, operational discipline, and a strong dividend yield. Investors get exposure to copper without the risks that come with smaller miners or speculative plays.
We believe this pullback is an entry point. BHP near its long-term average, with strong fundamentals, looks attractive for medium to long-term investors.
Copper may stay volatile. But the direction is clear. BHP is well-placed to ride the next leg higher.
The forecasts provided herein are intended for informational purposes only and should not be construed as guarantees of future performance. This is an example only to enhance a consumer's understanding of the strategy being described above and is not to be taken as Blueberry Markets providing personal advice.

Update to our BHP callBHP is up around 13% since our long call in early August . We’re maintaining our bullish position in BHP as the focus turns to cash generation businesses in 2026 and those who have operating leverage from rising commodity prices.
BHP is among the world’s most attractive diversified miners and while it has missed the recent gold and silver price rally, its core in iron ore and copper will come back to roost next year with strong earnings.
The world is increasingly looking to copper scarcity as electrification becomes an increasingly important investment theme.
The forecasts provided herein are intended for informational purposes only and should not be construed as guarantees of future performance. This is an example only to enhance a consumer's understanding of the strategy being described above and is not to be taken as Blueberry Markets providing personal advice.
