BHP holds steady as copper cracksCopper has been on a rollercoaster in 2025. It broke above US$5/lb in May, driven by strong demand signals from China and clean energy projects. Then came the reversal. US tariffs on Chinese copper goods triggered a sharp selloff. Futures dropped more than 20% in days.
Traders reacted to headlines. But the long-term story remains intact.
BHP, one of the world’s largest copper miners, just delivered record output—over 2 million tonnes in FY25, up 8% year-on-year. Its Escondida and Spence mines are performing strongly. Copper is becoming a key pillar of BHP’s future production and revenue.
The stock is currently trading on the ASX near its 200-day moving average, around AU$39. This is a technical and psychological level that often acts as support in long-term trends. It’s a point where value investors typically step in.
The investment case for copper hasn’t changed. Electrification, energy transition, and AI-driven infrastructure will need vast amounts of copper. Supply remains constrained. New projects are few, and development timelines are long.
Short-term shocks create long-term opportunities. The tariff-driven selloff may shake out weak hands, but it doesn’t weaken the structural demand for copper.
BHP offers a cleaner way to invest in the copper story. It has scale, operational discipline, and a strong dividend yield. Investors get exposure to copper without the risks that come with smaller miners or speculative plays.
We believe this pullback is an entry point. BHP near its long-term average, with strong fundamentals, looks attractive for medium to long-term investors.
Copper may stay volatile. But the direction is clear. BHP is well-placed to ride the next leg higher.
The forecasts provided herein are intended for informational purposes only and should not be construed as guarantees of future performance. This is an example only to enhance a consumer's understanding of the strategy being described above and is not to be taken as Blueberry Markets providing personal advice.
Copper

Update to our BHP callBHP is up around 13% since our long call in early August . We’re maintaining our bullish position in BHP as the focus turns to cash generation businesses in 2026 and those who have operating leverage from rising commodity prices.
BHP is among the world’s most attractive diversified miners and while it has missed the recent gold and silver price rally, its core in iron ore and copper will come back to roost next year with strong earnings.
The world is increasingly looking to copper scarcity as electrification becomes an increasingly important investment theme.
The forecasts provided herein are intended for informational purposes only and should not be construed as guarantees of future performance. This is an example only to enhance a consumer's understanding of the strategy being described above and is not to be taken as Blueberry Markets providing personal advice.

CopperXCUUSD
- Fair Value Gap
- Order Block
- Fibonacci Level - 78.60%
- Completed " 123 " Impulsive Waves
- Resistance Level

CopperXCUUSD
- Bullish Channel as an corrective pattern in Short Time Frame
- Resistance Level
- RSI - Divergence
- Completed " 1234 " Impulsive Waves
- BSL

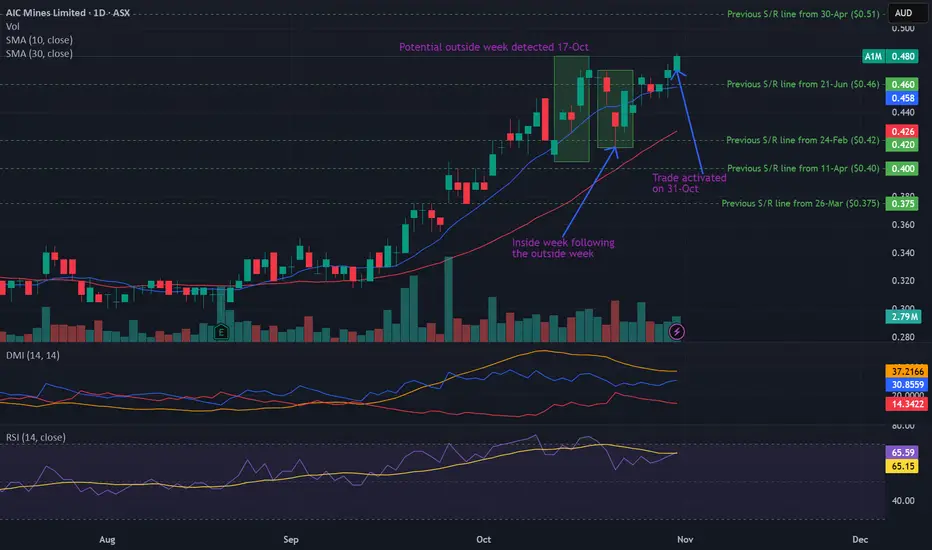
Potential outside week and bullish potential for A1MEntry conditions:
(i) higher share price for ASX:A1M above the level of the inside week following the potential outside week noted on 17th October (i.e.: above the level of $0.47).
Stop loss for the trade would be:
(i) below the low of the inside week on 22nd October (i.e.: below $0.415), should the trade activate.
CopperXCUUSD
- Fibonacci Level - 61.80% / 78.60%
- Demand Zone
- Completed " 12345 " Impulsive Waves and " AB " Corrective Wave
- Fair Value Gap
- Bullish Channel as an corrective pattern in Short Time Frame

Stop!Loss|Market View: GOLD🙌 Stop!Loss team welcomes you❗️
In this post, we're going to talk about the near-term outlook for GOLD ☝️
Potential trade setup:
🔔Entry level: 3992.755
💰TP: 3853.896
⛔️SL: 4067.971
"Market View" - a brief analysis of trading instruments, covering the most important aspects of the FOREX market.
👇 In the comments 👇 you can type the trading instrument you'd like to analyze, and we'll talk about it in our next posts.
💬 Description: Gold is moving in line with the previous sell scenario, and this medium-term trade remains relevant. In the shorter term, additional selling below the point of control (POC) level, around 3992.755, could also be considered. An alternative short-term scenario is selling near 4100, where the last accumulation is located. The downside target is currently considered to be in the 3800-3900 area, but a decline to 3600-3700 remains possible.
Thanks for your support 🚀
Profits for all ✅

CopperXCUUSD
- Completed " 12345 " Impulsive Waves
- Bullish Channel as an corrective pattern in Short Time Frame
- Break of Structure
- Order Block
- Fair Value Gap

Risk appetite will return again! With all the FUD that's going around in the market, I look back to dr. copper! Sometimes it's important to look back at the fundamentals and then you'll realize, everything is playing out the way it should.
Extreme bearish deviation from the mean on the COPPER/GOLD ratio
Massive macro pitchfork bottom reoccurring
Small caps can't catch a breath
All while talks of QE just being around the corner!
I don't believe the current liquidity strain on the system (High SOFR spreads, Large TGA build up, Lowest reverse repo reserves, Low bank reserves) will last too long before the printer restarts. Powell knows this!

Stop!Loss|Market View: SILVER🙌 Stop!Loss team welcomes you❗️
In this post, we're going to talk about the near-term outlook for SILVER ☝️
Potential trade setup:
🔔Entry level: 50.07771
💰TP: 45.90144
⛔️SL: 51.62853
"Market View" - a brief analysis of trading instruments, covering the most important aspects of the FOREX market.
👇 In the comments 👇 you can type the trading instrument you'd like to analyze, and we'll talk about it in our next posts.
💬 Description: As noted earlier regarding gold, despite the aggressive short-term strengthening of metals, medium- and long-term selling pressure remains. Both gold and silver are trading near key resistance levels, indicating a potential reversal. A further approach to 52 is not ruled out for silver, so shorter-term selling is looked for if the price approaches 50, and it's best to wait for the price to close below 50.
Thanks for your support 🚀
Profits for all ✅
❗️ Updates on this idea can be found below 👇

Stop!Loss|Market View: GOLD🙌 Stop!Loss team welcomes you❗️
In this post, we're going to talk about the near-term outlook for GOLD ☝️
Potential trade setup:
🔔Entry level: 4122.884
💰TP: 3895.119
⛔️SL: 4246.000
"Market View" - a brief analysis of trading instruments, covering the most important aspects of the FOREX market.
👇 In the comments 👇 you can type the trading instrument you'd like to analyze, and we'll talk about it in our next posts.
💬 Description: According to our previous review of this metal, the price is moving according to an alternative scenario, namely, a retest of the 4150-4200 range. Currently, short-term selling is being actively looked for, and the medium-term mood remains focused on levels of 3600-3700. We can expect additional manipulation/a slight move toward 4200 in the near future, but it's not a certain thing that we'll reach this round level, and we could reverse earlier.
Thanks for your support 🚀
Profits for all ✅
❗️ Updates on this idea can be found below 👇

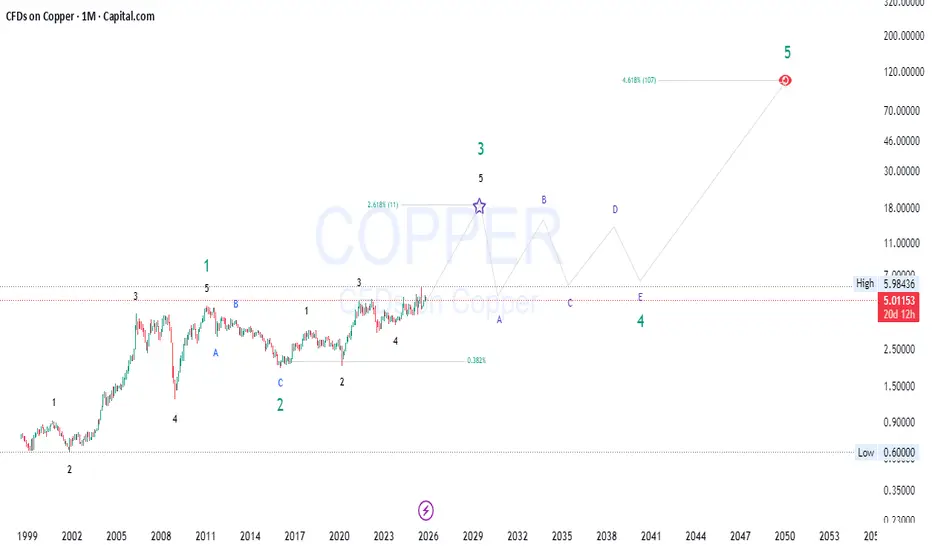
Copper(XCU/USD) Ready to Explode | Wave 3 to $10, Wave 5 to $100🧠 COPPER — The Sleeping Giant Ready for a Supercycle 🌍⚡
Copper, the “metal of electrification,” is setting up for one of the biggest macro-bull markets we’ve ever seen. From EVs to renewable grids to AI data-center power demand, copper is literally the blood of the new industrial era . Let’s break it down step-by-step 👇
🔮 Wave Theory Confluence (Elliott + Fibonacci Extensions)
Zooming out to the monthly timeframe , we can clearly see Copper finishing its Wave 3 within a long-term 5-wave impulsive supercycle.
✅ Wave 1 (2001-2008) fueled by China’s infrastructure boom.
✅ Wave 2 (2008-2016) a deep corrective phase, classic ABC zigzag.
⚡ Wave 3 (2016-2026) now unfolding with a 2.618 Fibonacci extension , targeting around $10–11 levels per pound by the late 2020s.
📉 After that, expect a macro Wave 4 correction —likely a complex ABCDE structure —before the final parabolic Wave 5 projection toward $100+ in the 2040s according to long-term fib confluence (4.618x extension).
This aligns perfectly with historical commodity supercycles—massive runs followed by decades of consolidation before exponential growth again.
🧩 Smart Money Concepts (SMC) – Liquidity & Institutional Order Flow
Smart Money has been quietly accumulating since 2016 👀
Liquidity grab below the 2020 lows cleaned out retail longs, allowing institutions to build heavy long positions.
The current structure shows higher highs (HHs) and higher lows (HLs) — the signature of a bullish market structure shift.
Premium/Discount zones show Copper still trading in the discount range of the macro leg (below the 50% equilibrium), suggesting Smart Money accumulation continues.
Expect Wyckoff-style reaccumulation as price coils between $4–$6 before the breakout into the next expansion leg 🚀
🧭 Price Action & Market Structure
Monthly BOS (Break of Structure) confirmed above $5, flipping long-term market structure bullish.
Demand zones at $4.0–$4.5 act as strong re-entry levels.
Liquidity pools above the $6 level (previous highs) likely to be taken out as price seeks expansion to the Wave 3 target zone.
Look for a final shakeout into Wave 4 later in the decade before the next true parabolic move.
This PA structure mirrors textbook “smart accumulation > markup > distribution > reaccumulation” phases seen in previous copper supercycles.
💹 Fundamentals: The Perfect Storm
⚙️ Electrification Boom – Copper is the backbone of EVs, renewable grids, AI data centers, and defense manufacturing.
🔋 Supply Constraints – Global mine production growth slowing while demand from green tech surges.
🌎 Geopolitical Tensions – Supply concentration in Chile, Peru, and DRC adds a geopolitical risk premium.
💰 Inflation Hedge – Commodities entering a reflation cycle as central banks pivot back to stimulus.
All fundamentals point to structural deficits by 2026-2030, aligning perfectly with Wave 3’s macro push.
🧮 Fibonacci Confluence & Cycle Timing
Wave 3 projection: 2.618 × Wave 1 = ~$10.7
Wave 4 retracement: likely 0.382 fib (~$6–$7 zone)
Wave 5 extension: 4.618 × Wave 1 = $100+
The time cycle between major waves (≈10–12 years) also aligns with commodity supercycles, putting Wave 5’s blow-off top around 2045-2050.
🔔 Conclusion: The Long Game
Copper isn’t just a trade — it’s a multi-decade macro opportunity .
While short-term volatility (Wave 4) will shake weak hands, the structural setup screams “supercycle incoming.”
🟢 Bias: Long-term bullish
🕰 Accumulation Zone: $4–$5
🎯 Targets:
Mid-term (2026-2028): $10–11
Long-term (2040s): $100+
⚡ “Commodities move slow… until they don’t.”
The smart money has already positioned. The rest will chase the breakout. Don’t be the last one in.
#Copper #ElliottWave #SmartMoneyConcepts #Commodities #MacroCycle #PriceAction #Fibonacci #TradingView #Investing #Metals
CopperXCUUSD
- Falling Wedge in Short Time Frame
- Demand Zone
- Order Block
- Change of Characteristics
- Bullish Channel as an corrective pattern in Long Time Frame

CopperXCUUSD
- Bullish Channel as an corrective pattern in Short Time Frame
- Sell Side Liquidity
- Change of Characteristics
- Demand Zone
- Completed " 12345 " Impulsive Waves and " A " Corrective Waves

Copper extends gains amid risk on tradeFollowing the weaker US cpi report, risk assets have all rallied and copper is among those. The metal broke out of a triangle continuation pattern yesterday and held above $5.00 key level. With optimism over US-China sending stocks to new records today, copper could follow suit and gain further ground in the days and weeks ahead. Watch out for more upside potential.
By Fawad Razaqzada, market analyst with FOREX.com

COPPER — 5.064 Long, Confluence and stacked oddsCMCMARKETS:COPPERZ2025
Fundamental: Bullish (5 Stacks) — supply disruptions and China demand.
Technical: Bullish (6 Stacks) — above EMAs, ADX 20.6, RSI 60.8.
Summary: Strong alignment; industrial momentum intact. Actionable Bullish Trade above 5.05.
Stop Loss: 4.96 Take Profit: 5.19 (~0.07 ATR × 1.52 / 2.6 R reward).

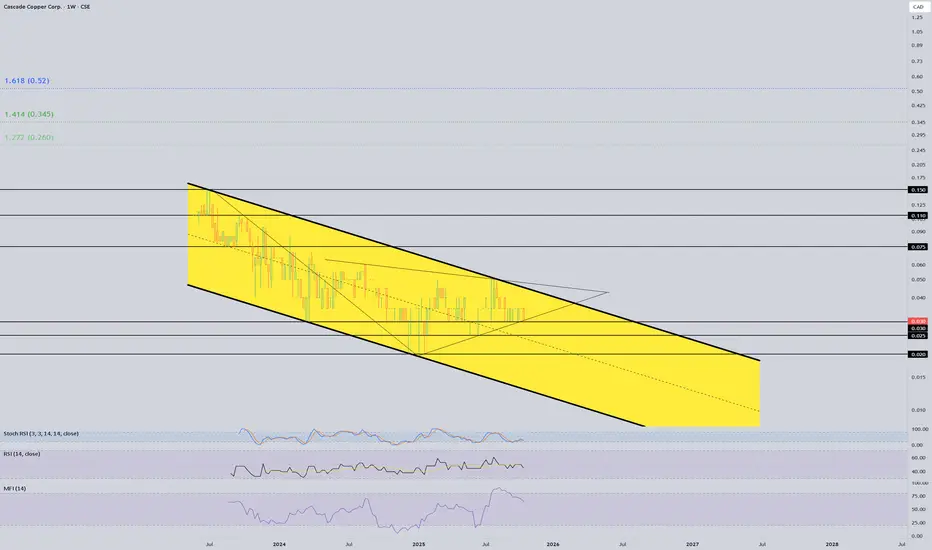
This parallel channel could resolve soonA beautiful parallel channel is continuing here.
If it breaks out, would be wise to take some profits at .075 cents, .11 and .15.
If it gets above it's all time high, .27 and.35 is in the cards.
Copper breaks outNice breakout from a triangle continuation pattern in copper prices today. It looks like the metal has found a good base around $5.000 now and after a few days trying to test waters below this level, where the bears failed to exert pressure, prices have now broken higher. Good sign about global growth, apparently. We have seen stronger Chinse data this week. Can we now see a push towards the range highs again? Key levels to watch shown on the chart.
By Fawad Razaqzada, market analyst with FOREX.com

COPPER - Following Gold?Hello TradingView Family / Fellow Traders. This is Richard, also known as theSignalyst.
📈 COPPER has been overall bullish, trading inside the rising wedge pattern in blue.
At present, COPPER is undergoing a correction phase and it is hovering around the lower bound of the wedge.
Moreover, it is retesting a massive support zone marked in green.
🏹 Thus, the highlighted blue circle is a strong area to look for buy setups as it is the intersection of the green support and lower blue trendline acting as a non-horizontal support.
📚 As per my trading style:
As #COPPER approaches the blue circle zone, I will be looking for bullish reversal setups (like a double bottom pattern, trendline break , and so on...)
📚 Always follow your trading plan regarding entry, risk management, and trade management.
Good luck!
All Strategies Are Good; If Managed Properly!
~Rich

Copper Long 5/6 Special.Fundamental: 5 | Technical: 6 StacksCAPITALCOM:COPPER COPPER We trade with the odds stacked in our favour. That's confluence. Fundamental: 5 | Technical: 6 Stacks. That was we like to call the perfect trade. No such thing however when the stars align we pull the trigger. Copper supported by infrastructure demand and tight supply; technicals show sustained strength near
$4.90.

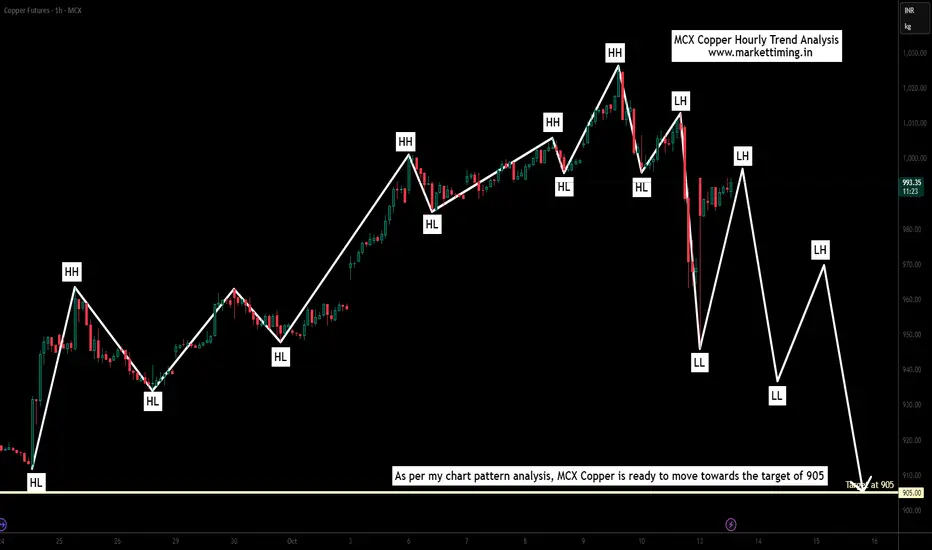
Copper Hourly Trend analysis As per my chart pattern analysis, MCX Copper is ready to move towards the target of 905.
Since this is my personal view, traders are suggested to conduct their own technical analysis for entries and exits.
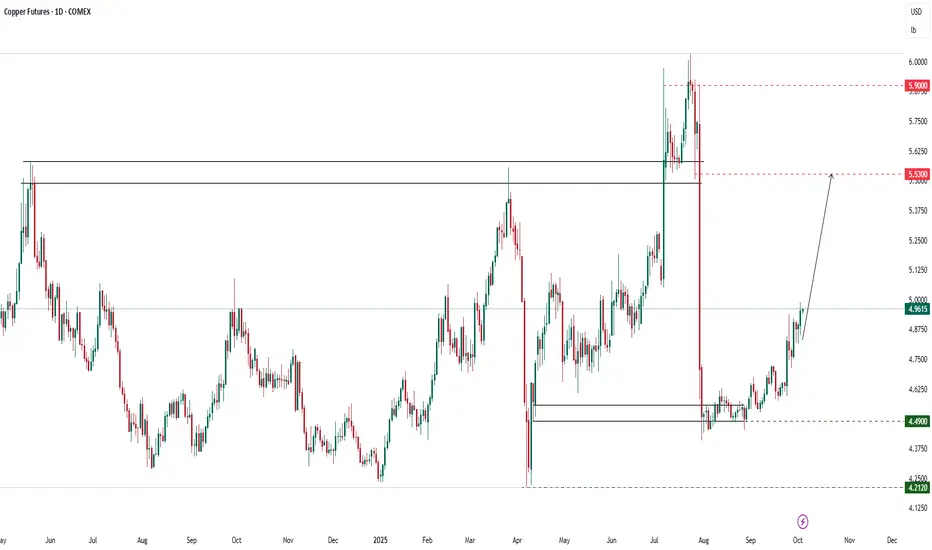
Analysis techniques – Copper Futures (Dec 2025)Analysis techniques – Copper Futures (Dec 2025)
Date: 03/10/2025 | Timeframe: D1 | Contract Code: HGZ25
1. Trend Overview and Price Structure
December copper rose slightly to 4.9610 USD/lb (+0.14%), sustaining its strong rebound from 4.49 support after a prolonged consolidation in August–September. The price has broken above short-term resistance and is approaching the psychological 5.00 mark. Medium-term structure remains bullish, targeting the key resistance zone of 5.53 – 5.90, a previous cycle high.
2. Key Technical Levels
Resistance: 5.53 – 5.90 – 6.00
Support: 4.90 – 4.49 – 4.21
3. Detailed Technical Analysis
Short-term trend: Breakout from the 4.49 – 4.70 base favors further upside toward 5.53.
Volume: Rising on the breakout, signaling fresh inflows.
Wave structure: Copper appears in a medium-term recovery wave (wave 3), with theoretical targets around 5.53 – 5.90 before a pullback.
Confirmation signals: Sustained closes above 5.00 would confirm momentum; failure below 4.90 risks a retracement to 4.70 – 4.49.
4. VNC View
Short term: Positive outlook as metals attract flows amid a softer USD.
Medium term: Refined copper supply disruptions in South America and persistent green demand (EVs, renewables) underpin prices.
Risks: Potential demand weakness from China could trigger volatility.
5. Suggested Technical Strategies
Preferred Long Setup:
Entry: 4.95 – 5.00
TP: 5.53 – 5.90
SL: 4.90
Probability: 65%
Counter-trend Short Setup:
Entry: 5.50 – 5.53
TP: 5.20 – 4.95
SL: 5.90
Probability: 40%
6. Corporate Hedging Guidance
Copper importers (Asia, Vietnam): Lock in purchases near 4.90 – 5.00 to mitigate upside risk.
Producers/sellers: Delay sales until prices approach 5.53 – 5.90 resistance for better margins.
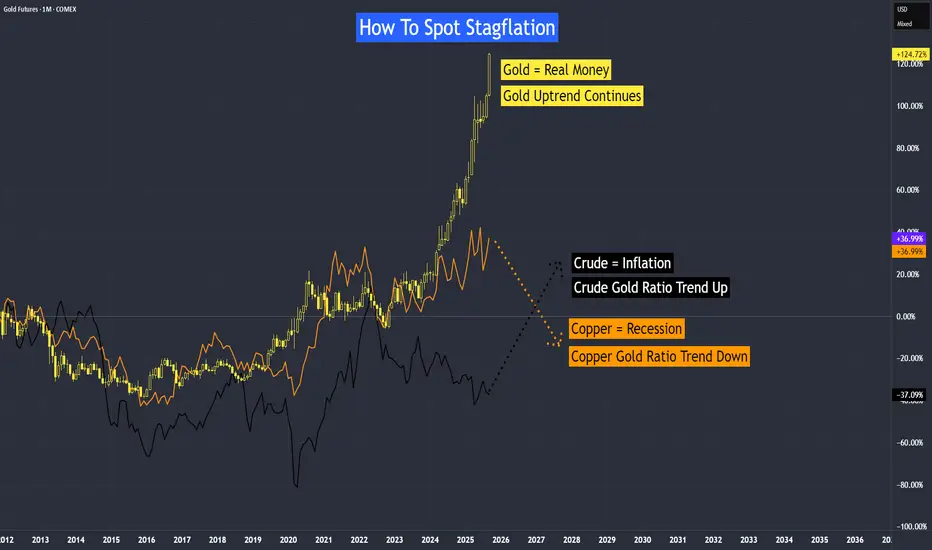
How To Spot Stagflation?One way is by looking at the copper-to-gold ratio and the crude oil-to-gold ratio.
• Gold reflects real money and investor confidence.
• Copper tracks recession.
• Crude oil represents inflation pressures.
When real money is under threat, the economy slows, and inflation rises at the same time, we have stagflation. This is the worst-case scenario for any economy. Fortunately, we are not experiencing it yet, though the risk remains.
What could trigger it?
Copper Gold Ratio - A downward trend signals slower growth and potential recession. This does not mean copper prices are falling; rather, if both copper and gold are rising but copper is climbing at a slower rate than gold, the ratio will continue to trend lower.
Crude Gold Ratio - As of now, the trend is still down, indicating that inflation remains under control. However, if crude oil starts moving higher, and its percentage change exceeds that of gold, the ratio will turn upward. Currently, inflation already seems to be pointing upward, and if the copper-gold ratio also rises, inflation is likely to trend higher than its current level.
Video version:
Therefore, stagflation = slow growth (copper-gold ratio) + high inflation (crude-gold ratio). Keep a close watch on the direction of copper and crude oil.
Copper Oil Futures & Options
Ticker: HG
Minimum fluctuation:
0.0005 per pound = $12.50
Disclaimer:
• What presented here is not a recommendation, please consult your licensed broker.
• Our mission is to create lateral thinking skills for every investor and trader, knowing when to take a calculated risk with market uncertainty and a bolder risk when opportunity arises.
CME Real-time Market Data help identify trading set-ups in real-time and express my market views. If you have futures in your trading portfolio, you can check out on CME Group data plans available that suit your trading needs www.tradingview.com