BTC vs SaaS and Tech Software Sector CorrelationBitcoin is currently showing its strongest correlation with the SaaS and Tech-Software sector.
This signals a clear shift: BTC is behaving like a high beta tech asset, driven by liquidity, growth expectations, and valuation cycles within the software market.
This is how smart capital truly sees Bitcoin.
That also means the AI sector has direct points of conflict with Bitcoin, something very few are talking about.
Alphractal
Correlation

0.73340 is a must be touched target for AUDUSDBased on the correlation between AUDUSD, EURUSD, GBPUSD and USDCHF, 0.73340 is a to be soon expected target for AUDUSD
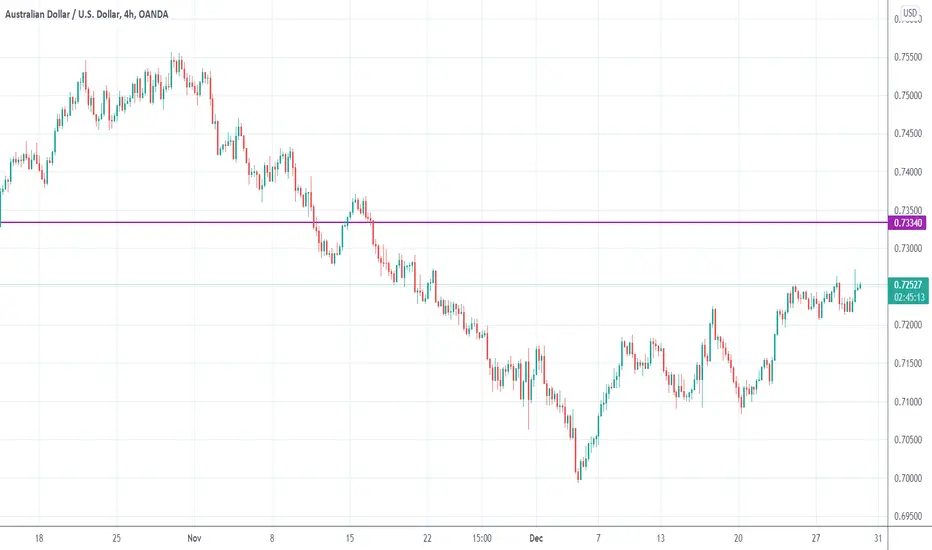
For EURUSD, 1.3580 must be touched.Based on the correlation between AUDUSD, EURUSD, GBPUSD and USDCHF, 1.3580 is a to be soon expected target for EURUSD

Want to Know Where Gold is Heading? Look at JP10Y!Want to Know Where Gold is Heading? Look at JP10Y!
+0.89 correlation: Did you know about this relationship between Japanese bonds and gold?"
One of the most overlooked indicators by gold investors is Japanese Government Bonds (JP10Y). When we examine the price movement over the past 5 years, a surprising relationship emerges: wherever JP10Y goes, gold follows!
📊 Correlation Analysis
The correlation coefficient between the two instruments is at +0.89 level, which means a very strong positive relationship.
On the chart, the red (JP10Y) and yellow (XAU/USD) lines move almost parallel. When JP10Y enters an uptrend, gold ounce seriously follows it, especially since January 2024, gold has caught a strong bull trend together with the rise in JP10Y.
🧠 So Why Does This Relationship Exist?
Why does gold rise when Japanese bond yields go up?
Japan kept interest rates very low for years, almost at 0% level. That's why investors borrowed cheaply from Japan and invested this money in high-interest countries. This strategy is known as "Carry Trade" and was very profitable for years.
Now the situation has changed. Japanese bond yields have started to rise and borrowing from Japan is becoming expensive. Investors are beginning to review their carry trade positions, saying "this business is not that profitable anymore."
When JP10Y rises, investors think: carry trade risk is increasing, uncertainty in markets may rise, and I may need to flee to safe haven. Also, when JP10Y rises, the Japanese Yen strengthens, a strong Yen puts pressure on the dollar, and a weak dollar pushes gold up because gold is priced in dollars.
As a result, when JP10Y rises, both the safe haven search and dollar weakness feed gold.
💡 Important Note for Investors
JP10Y can be used as a leading indicator for gold.
When JP10Y is in an uptrend, the expectation of a rise for gold may strengthen, if a sudden drop is seen in JP10Y, a correction may occur in gold, and the breakdown of correlation can be an early warning signal for a trend change.
📌 Conclusion
When investing in gold, it's not enough to just look at the dollar, the FED, or geopolitical events. Indirect indicators like JP10Y can also seriously affect your portfolio strategy. Critical level to watch: JP10Y holding above 1,5 may give a positive signal for gold.
Thanks for reading.

Short Idea On US30 (Dow Jones)Based on :
-quantitative analysis
- vp and avwap levels
- correlations misprice model
- IV deviation bands models

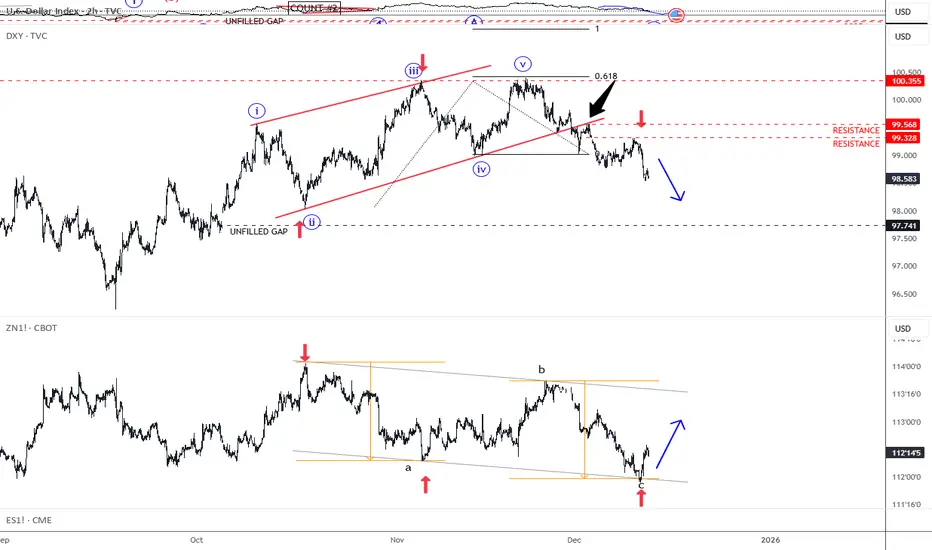
Fed Cuts, Treasuries Bounce, Dollar Slips FurtherGood morning traders! The Fed cut interest rates by 0.25% yesterday, marking the third straight cut. A few members dissented, showing the committee isn’t fully aligned. They proceeded with the cut as the job market continues to cool, even though inflation is still sticking around. The Fed also hinted this could be the last cut for a while and announced plans to start buying short-term Treasuries to keep liquidity stable. The US dollar remains under bearish pressure, while stocks hold steady, keeping the risk-on sentiment intact. This momentum could carry into year-end, we should just be aware of potential short-term pullbacks. USDollar Index - DXY remains nicely bearish, supported by 10Y US Treasury chart, as anticipated. If we consider that 10Y US Notes chart is now turning back to bullish mode, then DXY could easily see more weakness at least towards the open/unfilled GAP at 97.74 area.
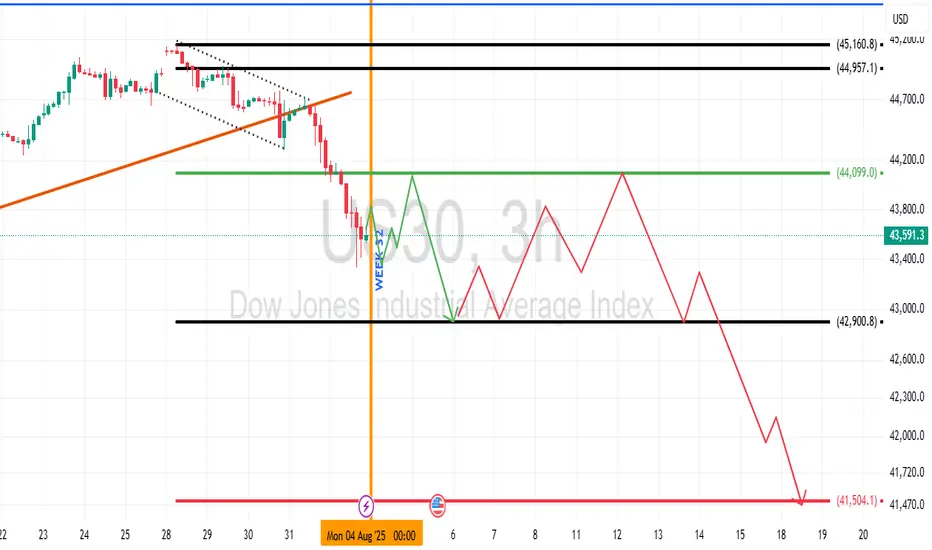
US 30 Dow Jones Industrial Average Week 32 OutlookUS 30, along with related indices, is likely to range for most of the week with early sells to confirm the support of interest. Best interest is in the bearish sentiment right now.
GBPJPY IDEA FOR 10TH OCT, 2025. (2H)A New Trading week is here again, expecting fresh information, volumes, and data to flood the markets this week, plus we expect high-impact news releases as well
However, currently the GBP against the JPY is still overall bullish and trending because the pair is still breaking higher highs and forming new swings and structure patterns from my frame work below. I expect a short move downwards during LND sessions and, hopefully, a continuation later during the NY session. meanwhile, we wait for possible confirmations of trade ideas.
TIP: The USDJPY & GBPJPY have a positive correlation, meaning they move in the same direction in many scenarios and situations, but their technical analysis isn't the same.
As usual, my calls or analysis are based on what I see, the current Bias, and from a probability standpoint, meaning that this projection may be or may not be validated, so tread carefully. This is not financial advice; trade responsibly.

Master Correlation Strategies in Financial MarketsIntroduction
In the dynamic world of financial trading and global markets, mastering correlation strategies is a cornerstone of risk management, portfolio diversification, and strategic profit-making. Correlation — the statistical relationship between two or more assets — reveals how price movements are interconnected. Understanding these relationships enables traders, investors, and portfolio managers to forecast market behavior, hedge risks, and enhance returns. In an era dominated by algorithmic trading, quantitative analysis, and global interdependence, mastering correlation strategies has become an indispensable skill for professionals in finance.
1. The Concept of Correlation in Financial Markets
Correlation measures the degree to which two securities move in relation to one another. It is expressed as a correlation coefficient ranging from -1 to +1:
+1 (Perfect Positive Correlation): The two assets move in the same direction. For example, the S&P 500 Index and a major U.S. technology ETF often exhibit a high positive correlation.
-1 (Perfect Negative Correlation): The two assets move in opposite directions. For instance, gold and the U.S. dollar often show a negative correlation.
0 (No Correlation): The movements of the two assets are unrelated.
By analyzing correlations, traders can understand how assets behave under varying market conditions — bullish, bearish, or volatile.
2. Importance of Correlation in Trading and Investment
Mastering correlation allows investors to build robust portfolios that can withstand market shocks. The importance of correlation can be summarized as follows:
Risk Management:
Correlation analysis helps identify how portfolio components interact. High correlations among holdings increase risk exposure, while low correlations enhance stability.
Diversification:
Diversification reduces unsystematic risk. By combining assets that are not highly correlated, investors minimize losses if one segment of the portfolio declines.
Hedging:
Traders can use negatively correlated assets as hedges. For example, when equity markets fall, investors may shift funds to bonds or gold.
Macro Market Analysis:
Correlation helps identify inter-market relationships — such as between currencies, commodities, and equities — offering insights into global economic trends.
Algorithmic Strategy Development:
Quantitative traders use correlation matrices to design algorithmic models that exploit patterns and mean-reversion opportunities between correlated assets.
3. Types of Correlation in Financial Markets
There are multiple forms of correlation that traders must understand:
Static Correlation:
The traditional correlation coefficient that remains constant over a fixed time period.
Dynamic or Rolling Correlation:
Correlations are not stable; they change over time due to macroeconomic events, liquidity shifts, and investor sentiment. Rolling correlation examines relationships across moving time windows (e.g., 30-day or 90-day).
Cross-Asset Correlation:
Measures how different asset classes — such as equities, bonds, and commodities — interact. For example, bond yields often have an inverse correlation with stock prices.
Intermarket Correlation:
Tracks relationships across international markets. For example, the performance of the U.S. dollar influences emerging market equities and commodities.
Sectoral Correlation:
Within equities, correlations can vary by sector. Technology and consumer discretionary sectors may rise together during economic booms but diverge in recessions.
Lagged Correlation:
Sometimes one asset’s price movement precedes another. For instance, movements in crude oil prices often precede those in airline stocks due to cost impacts.
4. Building Correlation-Based Strategies
Mastering correlation requires applying the concept in strategic, data-driven ways. Below are several powerful correlation-based trading and investment approaches.
A. Pair Trading (Statistical Arbitrage)
Pair trading is one of the most common correlation strategies. It involves identifying two historically correlated assets. When their correlation temporarily diverges — one asset becomes undervalued while the other is overvalued — traders short the outperforming asset and go long on the underperforming one, betting that prices will converge again.
Example:
Suppose Coca-Cola (KO) and PepsiCo (PEP) typically move together.
If KO rises 5% while PEP remains flat, traders might buy PEP and short KO, expecting their prices to realign.
This strategy is market-neutral, meaning profits can be generated regardless of market direction, as long as the correlation reverts.
B. Cross-Asset Hedging
Traders often hedge exposure by using correlated assets. For instance:
A trader long on the NASDAQ 100 might short S&P 500 futures to offset systemic risk.
Commodity traders hedge oil exposure through correlated instruments like energy-sector ETFs or refining stocks.
This technique reduces portfolio volatility by offsetting correlated risks.
C. Intermarket Analysis
Correlation helps traders interpret how different markets influence each other. Examples:
A strengthening U.S. dollar often leads to falling commodity prices.
Rising Treasury yields may indicate future stock market corrections.
Increasing oil prices can signal inflationary pressures affecting currency values.
By monitoring these correlations, traders anticipate market moves before they occur.
D. Portfolio Diversification Optimization
Portfolio managers use correlation matrices to identify assets that provide maximum diversification benefits.
For instance, combining U.S. equities with gold, real estate, and bonds reduces overall portfolio variance because these assets have historically low or negative correlations with one another.
E. Volatility and Correlation Trading
In derivative markets, correlation strategies are applied using correlation swaps or dispersion trades:
A correlation swap allows traders to speculate directly on the average correlation between assets in an index.
Dispersion trading involves buying options on individual stocks while selling options on an index, profiting from the difference between implied and realized correlation.
These advanced techniques are primarily used by institutional traders and hedge funds.
5. Tools and Methods to Measure Correlation
Mastering correlation requires analytical tools and quantitative methods:
Correlation Coefficient (Pearson’s r):
A standard measure ranging from -1 to +1, used to identify the strength and direction of a linear relationship.
Spearman Rank Correlation:
Measures monotonic relationships (useful when data is not normally distributed).
Rolling Correlation Analysis:
Using statistical software or trading platforms, traders compute rolling correlations to observe how relationships evolve.
Heatmaps and Correlation Matrices:
Visual tools that show correlations between multiple assets simultaneously, allowing easy identification of diversification opportunities.
Regression Analysis:
Used to model dependencies and predict how one asset’s returns affect another’s.
Machine Learning Techniques:
Advanced models like Principal Component Analysis (PCA) or clustering algorithms help detect non-linear correlations across large datasets.
6. Challenges in Applying Correlation Strategies
While correlation is a powerful concept, it is not without limitations:
Correlation is Not Causation:
A high correlation doesn’t necessarily imply one asset influences another. Spurious correlations may lead to false signals.
Dynamic Market Behavior:
Correlations fluctuate due to macroeconomic shifts, policy changes, or crises. For example, during global recessions, correlations across assets tend to rise sharply, reducing diversification benefits.
Tail Risk and Black Swan Events:
Extreme market events often break historical correlations. During the 2008 financial crisis, previously uncorrelated assets suddenly moved together.
Overfitting in Quant Models:
Excessive reliance on historical data can lead to models that fail under real-world conditions.
Liquidity and Execution Risks:
In pair or correlation trades, slippage and liquidity constraints can erode profitability.
7. Correlation Dynamics in Different Market Environments
Understanding how correlations evolve under various conditions is key to mastering this strategy.
Bull Markets:
Equity correlations tend to decrease as investors pursue diverse risk assets.
Diversification benefits are more visible, and pair trading strategies perform well.
Bear Markets:
Correlations across asset classes often increase as investors move to safe havens.
Portfolio diversification becomes less effective, and hedging becomes essential.
Volatile or Uncertain Markets:
Dynamic correlation tracking helps traders detect sudden changes in market relationships.
Correlation-based hedging and volatility arbitrage strategies become valuable.
8. Role of Correlation in Algorithmic and Quantitative Trading
Quantitative funds and algorithmic trading systems rely heavily on correlation analysis:
High-Frequency Trading (HFT): Algorithms detect microsecond-level correlation changes to exploit arbitrage opportunities.
Machine Learning Models: Predictive models use multi-asset correlation patterns to forecast market direction.
Portfolio Optimization Algorithms: Quant funds use correlation matrices to rebalance holdings dynamically.
Correlation Arbitrage: Institutional players identify mispriced assets using multi-dimensional correlation structures.
9. Case Studies: Correlation in Action
A. Gold and U.S. Dollar
Historically, gold and the U.S. dollar exhibit strong inverse correlation. When the dollar weakens due to inflation or monetary easing, gold tends to rise as investors seek protection against currency devaluation.
B. Crude Oil and Equity Markets
Oil prices often move in tandem with equity markets in growth periods but diverge during inflationary shocks or geopolitical disruptions.
C. Bitcoin and Tech Stocks
Recent data show Bitcoin increasingly correlated with technology equities, reflecting its risk-on asset behavior in global liquidity cycles.
10. The Future of Correlation Strategies
The future of correlation strategies is shaped by technology, globalization, and behavioral finance.
Machine learning, big data analytics, and artificial intelligence are enabling real-time correlation tracking across vast datasets, enhancing predictive power. Cross-asset and inter-market relationships are becoming increasingly complex due to algorithmic participation and geopolitical dynamics.
Moreover, deglobalization trends, supply chain shifts, and digital assets are creating new correlation structures that traders must monitor closely. As financial systems evolve, mastering dynamic, adaptive correlation strategies will remain a decisive advantage.
Conclusion
Mastering correlation strategies is not merely a technical skill; it is a comprehensive approach to understanding market interconnectivity, risk, and opportunity. By studying how assets move in relation to one another, traders and investors can craft resilient portfolios, design profitable arbitrage models, and navigate volatility with confidence.
In essence, correlation is the language of relationships within global finance. The true mastery lies in not only recognizing those relationships but also anticipating when they will shift — turning statistical insight into strategic foresight.
Master Correlation StrategiesUnlocking the Power of Inter-Market Relationships in Trading.
1. Understanding Correlation in Trading
Correlation refers to the statistical relationship between two or more financial instruments — how their prices move relative to each other. It is expressed through a correlation coefficient ranging from -1 to +1.
Positive Correlation (+1): When two assets move in the same direction. For example, crude oil and energy sector stocks often rise and fall together.
Negative Correlation (-1): When two assets move in opposite directions. For instance, the U.S. dollar and gold often have an inverse relationship — when one rises, the other tends to fall.
Zero Correlation (0): Indicates no consistent relationship between two assets.
Understanding these relationships helps traders predict how one market might respond based on the movement of another, enhancing decision-making and portfolio design.
2. Why Correlation Matters
In modern financial markets, where globalization links commodities, equities, currencies, and bonds, no asset class operates in isolation. Correlation strategies allow traders to see the “bigger picture” — understanding how shifts in one area of the market ripple across others.
Some key reasons why correlation is vital include:
Risk Management: Diversification is only effective when assets are uncorrelated. If all your holdings move together, your portfolio is not truly diversified.
Predictive Analysis: Monitoring correlated assets helps anticipate price moves. For example, a rally in crude oil might foreshadow gains in oil-dependent currencies like the Canadian Dollar (CAD).
Hedging Opportunities: Traders can offset risks by holding negatively correlated assets. For instance, pairing long stock positions with short positions in an inverse ETF.
Market Confirmation: Correlations can validate or contradict signals. If gold rises while the dollar weakens, the move is more credible than when both rise together, which is rare.
3. Core Types of Correlations in Markets
a. Intermarket Correlation
This examines how different asset classes relate — such as the link between commodities, bonds, currencies, and equities. For example:
Rising interest rates typically strengthen the domestic currency but pressure stock prices.
Falling bond yields often boost equity markets.
b. Intra-market Correlation
This focuses on assets within the same category. For example:
Technology sector stocks often move together based on broader industry trends.
Gold and silver tend to share similar price patterns.
c. Cross-Asset Correlation
This involves analyzing relationships between assets of different types, such as:
Gold vs. U.S. Dollar
Crude Oil vs. Inflation Expectations
Bitcoin vs. NASDAQ Index
d. Temporal Correlation
Certain correlations shift over time. For instance, the correlation between equities and bonds may be positive during economic growth and negative during recessions.
4. Tools and Techniques to Measure Correlation
Correlation is not merely an observation—it’s a quantifiable concept. Several statistical tools help traders measure and monitor it accurately.
a. Pearson Correlation Coefficient
This is the most widely used formula to calculate linear correlation between two data sets. A reading close to +1 or -1 shows a strong relationship, while values near 0 indicate weak correlation.
b. Rolling Correlation
Markets evolve constantly, so rolling correlation (using moving windows) helps identify how relationships shift over time. For example, a 30-day rolling correlation between gold and the USD can show whether their inverse relationship is strengthening or weakening.
c. Correlation Matrices
These are tables showing the correlation coefficients between multiple assets at once. Portfolio managers use them to construct diversified portfolios and reduce overlapping exposures.
d. Software Tools
Platforms like Bloomberg Terminal, TradingView, MetaTrader, and Python-based tools (like pandas and NumPy libraries) allow traders to calculate and visualize correlation efficiently.
5. Applying Correlation Strategies in Trading
a. Pair Trading
Pair trading is a market-neutral strategy that exploits temporary deviations between two historically correlated assets.
Example:
If Coca-Cola and Pepsi usually move together, but Pepsi lags temporarily, traders may go long Pepsi and short Coca-Cola, betting the relationship will revert.
b. Hedging with Negative Correlations
Traders can use negatively correlated instruments to offset risk. For instance:
Long positions in the stock market can be hedged by taking positions in safe-haven assets like gold or the Japanese Yen.
c. Sector Rotation and ETF Strategies
Investors track sector correlations with broader indices to identify leading and lagging sectors.
For example:
If financial stocks start outperforming the S&P 500, this could signal a shift in the economic cycle.
d. Currency and Commodity Correlations
Currencies are deeply linked to commodities:
The Canadian Dollar (CAD) often correlates positively with crude oil prices.
The Australian Dollar (AUD) correlates with gold and iron ore prices.
The Swiss Franc (CHF) is often inversely correlated with global risk sentiment, acting as a safe haven.
Traders can exploit these relationships for cross-market opportunities.
6. Case Studies of Correlation in Action
a. Gold and the U.S. Dollar
Gold is priced in dollars; therefore, when the USD strengthens, gold usually weakens as it becomes more expensive for other currency holders.
During 2020’s pandemic uncertainty, both assets briefly rose together — a rare situation showing correlation can shift temporarily under stress.
b. Oil Prices and Inflation
Oil serves as a barometer for inflation expectations. When crude prices rise, inflation fears grow, prompting central banks to tighten policies.
Traders who monitor this relationship can anticipate policy shifts and market reactions.
c. Bitcoin and Tech Stocks
In recent years, Bitcoin has shown increasing correlation with high-growth technology stocks. This suggests that cryptocurrency markets are influenced by risk sentiment similar to the equity market.
7. Benefits of Mastering Correlation Strategies
Enhanced Market Insight: Understanding inter-market dynamics reveals the underlying forces driving price movements.
Stronger Portfolio Construction: Diversify effectively by choosing assets that truly offset one another.
Smarter Risk Control: Correlation analysis highlights hidden exposures across asset classes.
Improved Trade Timing: Correlation signals help confirm or challenge technical and fundamental setups.
Global Perspective: By studying correlations, traders gain insight into how global events ripple through interconnected markets.
8. Challenges and Limitations
Despite its power, correlation analysis is not foolproof. Traders must be aware of its limitations:
Changing Relationships: Correlations evolve over time due to policy changes, crises, or shifting investor sentiment.
False Correlation: Sometimes two assets appear correlated by coincidence without a fundamental link.
Lag Effect: Correlation may not capture time delays between cause and effect across markets.
Overreliance: Correlation is one tool among many; combining it with technical, fundamental, and sentiment analysis produces more reliable outcomes.
9. Advanced Correlation Techniques
a. Cointegration
While correlation measures relationships at a moment in time, cointegration identifies long-term equilibrium relationships between two non-stationary price series.
For example, even if short-term correlation fluctuates, two assets can remain cointegrated over the long run — useful in statistical arbitrage.
b. Partial Correlation
This method isolates the relationship between two variables while controlling for others. It’s particularly helpful in complex portfolios involving multiple correlated instruments.
c. Dynamic Conditional Correlation (DCC) Models
These advanced econometric models (used in quantitative finance) measure time-varying correlations — essential for modern algorithmic trading systems.
10. Building a Correlation-Based Trading System
A professional correlation strategy can be structured as follows:
Data Collection: Gather historical price data for multiple assets.
Statistical Analysis: Calculate correlations and rolling relationships using software tools.
Strategy Design: Develop pair trades, hedges, or intermarket signals based on correlation thresholds.
Backtesting: Validate the system across different market phases to ensure robustness.
Execution and Monitoring: Continuously update correlation data and adjust positions as relationships evolve.
Risk Control: Implement stop-loss rules and diversification limits to prevent overexposure to correlated positions.
11. The Future of Correlation Strategies
In an era of high-frequency trading, AI-driven analytics, and global macro interconnectedness, correlation strategies are evolving rapidly. Machine learning models now identify non-linear and hidden correlations that traditional statistics might miss.
Furthermore, as markets integrate further — with crypto, ESG assets, and alternative data sources entering the scene — understanding these new correlations will be crucial for maintaining an edge in trading.
12. Final Thoughts
Mastering correlation strategies isn’t just about mathematics — it’s about understanding the language of global markets. Every movement in commodities, currencies, and indices tells a story about how capital flows across the world.
A trader who comprehends these relationships gains not only analytical power but also strategic foresight. By mastering correlation analysis, you move beyond isolated price charts and see the interconnected web that drives the global financial ecosystem.
In essence, correlation strategies are the bridge between micro-level technical trades and macro-level economic understanding. Those who can navigate this bridge with confidence stand at the forefront of modern trading excellence — armed with knowledge, precision, and an unshakable sense of market direction.
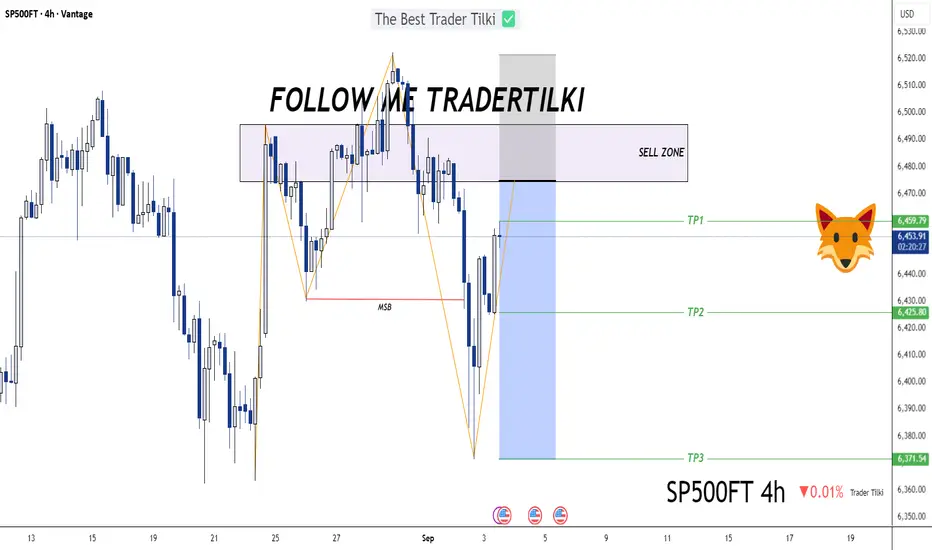
SP500 Structure Shift: Sell Zone ActivatedHey Guys 👋
I’ve prepared an SP500 analysis for you. Since the market structure has shifted, I’ll be opening a sell position from my designated sell zone.
📌 Entry: 6,474.90
📌 Stop: 6,522.12
🎯 TP1: 6,459.79
🎯 TP2: 6,425.80
🎯 TP3: 6,371.54
RISK REWARD - 2,21
Every single like you send my way is a huge source of motivation for me to keep sharing these analyses. Big thanks to everyone supporting with a like 🙏
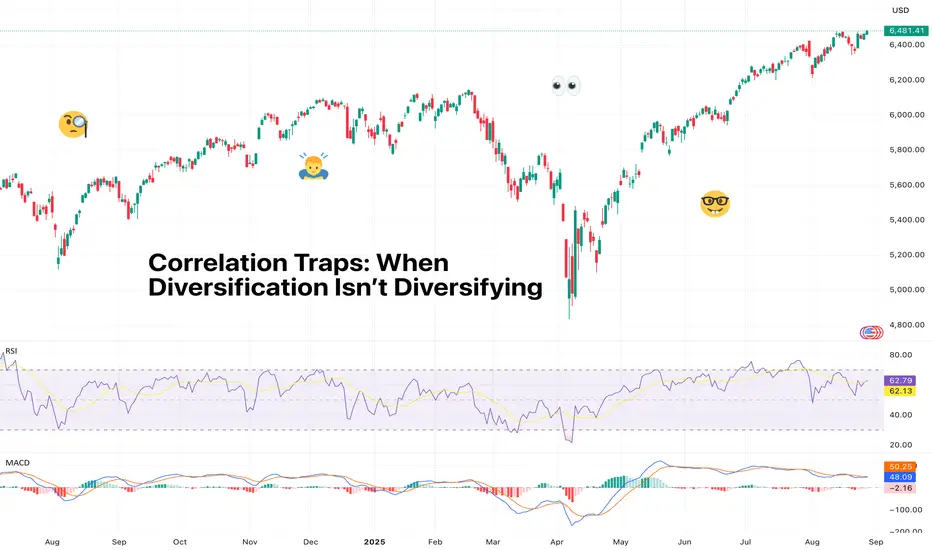
Correlation Traps: When Diversification Isn’t DiversifyingYou thought you were diversified. You had tech, energy, crypto, gold — a little bit of everything. Then a single headline nuked your entire portfolio in one day. Welcome to the sneaky world of correlation traps.
🧩 The Diversification Myth
Everyone loves to brag about their diversified portfolio. Some Tesla NASDAQ:TSLA here, Rocket Lab NASDAQ:RKLB there, maybe sprinkle in some Solana COINBASE:SOLUSD “for balance.”
But if your carefully curated mix of assets moves in the same direction every time Powell says “Good afternoon” at a Fed event… are you really diversified? Or are you just collecting different-shaped eggs in the same basket?
This is the correlation trap — the illusion of safety when your assets are secretly plotting against you. On paper, your portfolio says “hedged.” In practice, one bad CPI ECONOMICS:USCPI print, a tariff tweet, or an AI bubble hiccup can torch your entire P&L statement for the month.
And it works both ways. When Powell signals cuts, everything rallies: stocks, crypto, commodities, even meme ETFs. Suddenly, your “balanced” portfolio becomes a leveraged bet on a single narrative.
📉 Positive Correlation = Double Trouble
Correlation measures how two assets move relative to each other. Positive correlation means they tend to move together. That sounds fine on the upside — everyone’s a genius in bull markets. But when the markets get stressed, it doesn’t really matter if you’re holding traditional stocks or crypto assets.
Here's an example. March 2020. The S&P 500 SP:SPX cratered. Bitcoin BITSTAMP:BTCUSD lost more than half of its value in a week. Gold OANDA:XAUUSD dipped. Even safe-haven treasury ETFs had a panic moment. When markets really go risk-off, assets that are usually uncorrelated can suddenly drop in sync.
Why does this happen? Herd behavior, mostly. When traders, funds, and algos all unwind positions at once, correlations spike. In times of panic, cash is king.
🛡️ Negative Correlation = Your Actual Friend
True diversification comes from mixing assets with low or negative correlation. Historically, think equities vs. treasuries, or stocks vs. gold. When risk assets like stocks get wrecked, safe-haven assets like gold often move up to soften the blow.
But even these aren’t bulletproof anymore. Rising inflation, aggressive tariff broadside, and geopolitical headlines can disrupt traditional correlations. Traders relying on “old rules” learn quickly that markets evolve, and yesterday’s safe havens don’t always save you today.
Traders often assume “low correlation” equals “zero risk” or “perfect hedge.” Not really. Low correlation can vanish during high-volatility events — exactly when you need it the most.
Correlation creep is real — and unless you check, you could be risking more than you think.
🧠 Trading Psychology Meets Correlation
Correlation traps aren’t just technical — they can mess with your thinking. Traders often overestimate how diversified they are, which breeds overconfidence. You assume your downside is limited… until a risk event wipes you out across positions you thought were independent.
The result? Revenge trading . Over-sizing. Ignoring stop-losses. The correlation trap becomes a psychological spiral if you don’t plan your true exposure correctly.
🛠️ Avoiding the Trap: Practical Moves That Work
Run the numbers. You’ve built out a perfect portfolio? Check where your picks are coming from and where they fit using the TradingView Heatmaps and Screeners .
Diversify by driver, not ticker. If multiple assets react to the same narrative, you’re likely not truly diversified.
Add true hedges. Bonds, gold, cash, and volatility products can help — but only if you size them correctly.
Watch cross-asset flows. Use correlations between equities, commodities, FX, and crypto to spot when risk is clustering.
The key takeaway? Diversification isn’t about owning “a little of everything.” It’s about owning different risk exposures.
👉 Bottom Line
Diversification fails when you mistake quantity for quality. Five correlated trades don’t make you hedged; they make you levered without you knowing it.
Correlation traps creep up quietly, especially during euphoric rallies when every chart goes up together. But when sentiment flips — and it does flip — you find out real quickly what’s actually diversified and what isn’t.
Next time someone brags about holding “uncorrelated” assets, ask them one question: “Did they all move the same way on the last CPI print ?” If the answer’s yes, maybe it’s time to rethink what diversification really means.
Off to you : How do you balance your portfolio? Or maybe you’re not after diversification and instead you’re chasing concentration? Share your approach in the comments!
Short idea nasdaq spotBased on -
- Correlation between eth and btc with equities shows potential short
- supply zone
- sector rotation (tech weak and small caps strong)
Gold (XAUUSD) Brief Analysis- Gold (XAUUSD) is currently trading around 3350, consolidating within a symmetrical triangle pattern after finding support near the 3330–3338 zone (Fib 0.5 and trendline support).
- The RSI is hovering near 50, showing a balanced momentum, while prices have broken out of the short-term descending trendline, suggesting potential bullish continuation.
- For intraday trading, our bias remains bullish, and a sustained breach above the 3355 Fib 0.382 level could open the path toward 3365 and 3376 resistances.
- On the downside, immediate support lies at 3338, followed by 3328, and only a break below these levels would negate the bullish setup.
- Traders may look for buying opportunities on dips above 3355 with tight stop losses, targeting the upside levels.

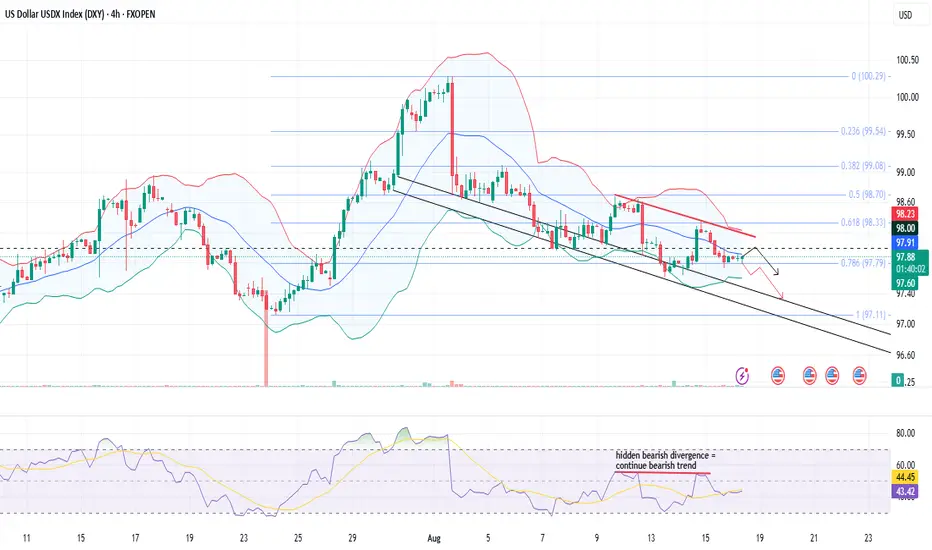
DXY Comprehensive AnalysisThe US Dollar Index (DXY) on the 4H chart remains under pressure, trading near 97.71 and holding below the key resistance zone of 98.20–98.30, aligned with the 20 SMA (middle Bollinger band) and 0.786 Fibonacci retracement (97.78), signaling a firm bearish bias.
Price action might continue to respect the descending trend, with recent candles showing rejection from the upper boundary and pointing toward a possible retest of 97.50–97.10 support levels. However, it will be crucial for prices to breach the fib level 0.786 and sustain lower.
Bollinger Bands are moderately compressed, suggesting controlled volatility, while RSI at 42 indicates weak momentum with a hidden bearish divergence (prices making lower highs and RSI making constant highs), reinforcing downside potential.
Unless the index reclaims 98.30 on strong buying, intraday traders may look for short opportunities on pullbacks, targeting 97.50 and then 97.10.
With no major data releases today, technical levels are likely to drive moves, and continued dollar weakness could support risk assets like equities and commodities, particularly gold and emerging market currencies.
Long Idea on USDHUFBased on :
-Negative Correlation with ZB1!
- Vwap support
- Demand zone
- Volume profile analysis

DXY Analysis - Crucial to Track Overall Market Scenario The US Dollar Index (DXY) is currently trading near 97.75, sitting just above the key 0.786 Fibonacci retracement level at 97.78.
Current Price Action
Price action shows a bouncing attempt from a descending support zone, with immediate resistance seen at 98.13.
If rise higher, the index has further upside potential toward the 0.618 retracement at 98.33 considering momentum also holds.
Alternate Scenario
On the downside, 97.48 and 97.11 remain critical supports; a break below could invite deeper selling pressure.
Indicator Confirmation
Bollinger Bands are relatively narrow, indicating a potential volatility expansion, while the RSI at 34.17 suggests the dollar is approaching oversold territory, increasing chances of a rebound.
Data Interpretation
Today’s Initial Jobless Claims and PPI releases will be pivotal — stronger-than-expected data may trigger a bullish breakout, while weaker readings could see the index retest lower supports.
The Final Highlight
Traders should watch for intraday breakouts above 98.00 for long entries, or breakdowns below 97.48 for shorts, with data releases likely acting as the catalyst.

Short term idea on Ym (US30 Spot)Based on:
- Supply zone
- Different indices setup for short
- correlatoon between ethereum and indices indicate a potential short
BTC M2 CorrelationMaybe Raoul is right and it was M2 all along.
Monetary policy driving all markets, see correlation and time-lag (offset) on chart.

$BTC 12-Week Lead Correlation w/ Global Liquidity, M2, GOLD, DXYHere’s a look at Bitcoin's price action against Global Liquidity, Global M2, GOLD and DXY - all with a 12-Week Lead.
Notice GOLD has a bit more of a deviation from the BTC price than the others.
This is because GOLD is used as a store of value asset, whereas the others are predicated on Central Banks expanding and contracting their money supply and balance sheets.
The key here is to smooth out the signal and ignore the noise.
Notice the convergence between these metrics the past couple months.

USDCAD 15-Min Setup: Buyers Defend Crucial ZoneGood morning traders,
Trust you are doing great.
Kindly go through my analysis of USDCAD currency pair.
Overview
The USDCAD M15 chart presents a bullish price setup around the 1.38350–1.38410 support zone, with current price action consolidating just above this area.
Idea
Price bounced off the key support zone (blue box), suggesting buyer interest. The BB Squeeze momentum indicator shows weakening selling pressure, which could signal an upcoming bullish move.
Key Support: 1.38350
Upside Targets: 1.38650, 1.38880, and 1.39039
Invalidation: Setup fails if price breaks below 1.38280
From the fundamental context, we can see that the Canadian dollar (CAD) is moving more in sync with the U.S. dollar (USD) again, a return to its historical behavior. This happens because Canada was spared from certain tariffs, making its economy more closely tied to U.S. growth sentiment—a key bullish factor for CAD when the USD strengthens. But because CAD is now closely tied to U.S. sentiment, CAD won't weaken as sharply, which might explain why the price is consolidating instead of spiking aggressively. As such, we might see a slow but steady move on the pair as time progresses.
Conclusion
As long as the price holds above the 1.38350 support zone, a bullish continuation toward the mentioned targets is likely.
Cheers and happy trading.

New era: 'The Bitcoin Trust Flow Cycles'🏆 The Bitcoin Trust Flow Cycles™ by FXPROFESSOR
Friends, today I’m sharing what may be the most important Bitcoin framework of 2025.
Forget the broken halving expectations. Forget the chaos of macro headlines.
What if the real signal has been here all along?
What if Bitcoin’s true rhythm follows the capital rotation between itself and the U.S. Treasury market?
📊 Introducing: The Bitcoin Trust Flow Cycles™
This is not a model of where Bitcoin could go (like Stock-to-Flow)…
This is a model of when and why it moves — based on the trust rotation between U.S. Treasury Bonds (TLT) and Bitcoin.
What I’ve found is a repeating structure — not based on supply or halvings, but on macro trust dynamics .
🔁 The Two Core Phases:
• Correlated Periods 🟦 (Blue zones): BTC and TLT move together — both rising or falling
• Inverted Periods 🟩 (Green zones): BTC and TLT move in opposite directions
These aren't random — they're structural rotations that occur at key technical levels in the bond market.
🧠 The Cycle Timeline:
Jan 2019 – Feb 2020 → Correlated (pre-COVID calm)
Feb 2020 – Sep 2021 → Inverted (Fed QE, Bitcoin moon)
Sep 2021 – Nov 2022 → Correlated (everything dumps)
Nov 2022 – Oct 2023 → Inverted (TLT collapse, BTC recovers)
Nov 2023 – Aug 2024 → Correlated (sideways digestion)
Aug 2024 – Now (Apr 2025) → Inverted again — and compressing fast
We're now in Period 6 — an Inverted Period — but all signs point to an upcoming Reversion.
📉 What Happens at Each Flip?
These transitions tend to occur when:
• TLT hits major channel support or resistance
• Macro fear or liquidity shocks drive trust shifts
• Smart money starts reallocating across asset classes
Right now, TLT is at channel support — a zone that has previously triggered reversions into correlated periods.
📌 What Comes Next:
According to the Bitcoin Trust Flow Cycles™ :
→ We are statistically due for a reversion** back into correlation
→ If TLT bounces from 76–71 zone… BTC may follow — not fight
→ The target remains: BTC breaking above 115 resistance
This flip — from inverse to correlated — has historically marked breakout windows for Bitcoin.
🔮 This Is Bigger Than a Halving
Plan B’s Stock-to-Flow gave us valuable insight into long-term valuation.
But it doesn’t explain timing.
This model isn’t about supply mechanics.
It’s about macro trust mechanics .
When institutional confidence leaves Treasuries…
And enters Bitcoin…
That’s the rotation we track.
That’s what moves the chart now.
🎯 Watchlist: • TLT support: 76 → 71 zone = reversal signal
• BTC breakout trigger: 115 resistance
• Cycle shift: Reversion = Bitcoin joining TLT upside
If this plays out, it could mark the most important trust cycle breakout we’ve seen since the COVID inversion.
Bitcoin doesn’t need permission anymore.
It just needs a macro trigger. And this model helps us spot it.
One Love,
The FXPROFESSOR 💙
📌 Missed the full credit market breakdown? Check my recent posts on BKLN, HYG, LQD, and TLT to understand the full Trust Flow rotation.

What Would Happen to Bitcoin if Stocks Crash?I have read different speculations on what might happen to the price of Bitcoin if the stock market were to crash. I am going to answer this using statistics, correlations, and examples of events from market history. This post will not speculate on the current nor future price movements of Bitcoin and Stocks; only their connection. I will be using the Tradingview Bitcoin Index INDEX:BTCUSD and the S&P500 Index ETF AMEX:SPY
What is a "Crash?"
I use a common definition of a stock market "crash" as a short or long duration decline of -30% or more. I distinguish this from "correction" which I define as a -5% to -10% movement. I'll look at the true crashes but also include significant corrections for comparison.
Time Range
I chose the time range from 2014 to present for this study. Bitcoin did not reach a comparable level of maturity nor public awareness until after the 2013 bull cycle. Also the 2013 Stock Market was ridiculously bullish.
How Often Do Bad Weeks Line Up?
I took particularly down weeks for Stocks, -2.5% or more, and compared them to the same week for Bitcoin. 2 out of 3 Weeks where the stock market was down big... Bitcoin was down big. Furthermore, the average magnitude of Bitcoin's down move was more than twice that of Stocks.
How Correlated is Bitcoin to Stocks?
The Correlation Coefficient measure the way in which two instruments move together. A value 1.0 means that they move identically up and down while a value of -1.0 means they move exactly opposite. The correlation of Bitcoin to Stocks varies from week to week. However, Bitcoin is far more often and to a greater degree positively correlated to Stocks.
At the extreme Bitcoin is more highly correlated to Stocks than it is ever negatively correlated (0.93 versus -0.76)
Bitcoin is move often positively correlated to stocks. 75% of weeks Bitcoin and Stocks are positively correlated
0.70 is considered "high correlation" and 33% of weeks exhibit high correlation
On the contrary, less than 2% of weeks are ever highly negatively correlated
Historical Crashes
Now we will go into some narratives around historic events surrounding large down moves in Stocks and how Bitcoin reacted.
2021
2021 was a bad year for both Stocks and Bitcoin. The decline of Bitcoin began prior to the then All Time High of Stocks but both decidedly went through a bear market together. Of note; while Stocks declined -27.47% from the high to low over that same period Bitcoin declined -61.83%.
COVID
COVID was a major but short "risk-off" event in both markets. Stocks declined -35.45% from prior high to subsequent low and Bitcoin declined -63.09% from its respective high and low.
2018
Going back further in time we can look a less severe Stocks declines in 2018. The 2018 market narrative was dominated by rate decisions with the Fed raising rates 4 times that year. The initial correction at the beginning of the year happened within Bitcoin's decline from its 2017 All Time High. Within this context while Stocks gave up -11.76% Bitcoin fell by more than half.
Later in the year as Bitcoin began to trade in a very tight range Stocks had a -20.47% decline. While the two did not coincide in their start times it is within the context of the longer Stocks crash that Bitcoin broke lower for another -53.62%
Conclusion and Analysis
I want to note here that Bitcoin was created AFTER "the big one" of 2008. There has never in Bitcoin's history been a true multi-year bear market for Stocks to compare. However, we have ample evidence to suggest that given a crash in Stocks it is a near certainty that Bitcoin will decline as well to a magnitude of double or more.
This happens because the market as a whole views Bitcoin as a risk asset with much higher volatility than Stocks as a whole. When there is ample liquidity and positive sentiment they both perform well. When liquidity is constrained and there is negative sentiment they both perform poorly. Liquidity and speculation are what drive them both. This connection has not changed in recent times and has likely increased due to the introduction of the Bitcoin ETF and publicly traded companies exposing their share prices to the volatility of Bitcoin.
Trade wisely.
