violently been pull back out of the 1220 ish battle zone Trump speach before congress had a nice effect on the usd and gold react accordingly , went strait back into the 1220 battle zone the got vilently faught back out of it . I mean this kind of candle just mean reaction and the next support to the up side would be the 1240 1245 zone for completion of an nice head and shoulder pattern . If those price manage to contend price action then we can start talking about a reversal in the dollar . but it to soon for that on the other side a breach on the other side of the 1250 mark would mean a continuation of the up trend on the gold , so new target on the up side and down target on usd
as usual dont hesitateto come and talk to us on our group : www.facebook.com
Correlation

UJ Correlation with DXYCorrelation between DXY and USD/JPY
Let’s start at DXY, if you look at the beginning of the year you can see we topped out just under 104 and then dropped during January down to 99.2 area which lines up right with the 38.2 FIB. If you move over to UJ, you can see that at the beginning of the year we started 118.5 area and during during January we dropped down to essentially the upper 111s. If you take a ratio of that fall, DXY dropped 450 pips and UJ dropped 650 pips, you get 1:1.44. Which essentially means that for every pip that DXY goes up/down, UJ will go up/down roughly 1.44 pips. With that being said, from my observations it appears that DXY is going to be moving back up to the 103.00 area moving roughly 100 pips from where it is now. Using my ratio above, that would mean UJ should go up around 144 pips from where it is now. Coincidentally this area lines directly up with the 1.236 Fib extension. I think with the recent push with the dollar we may see some draw down before this move occurs but it goes along with my prediction that I had about two weeks ago. Green arrows go with my bullish idea above. Red arrows line up with my idea below. Blue arrows are from my idea about two weeks ago. I linked my DXY chart so you can see a visual rather than having to chart yourself.
On the other side I have a trendline drawn on UJ that it just bounced off of so it very well could reject and go back down to test the 112.5 area where I have another trendline drawn. I have a couple of pendings setup on my demo account to test my theory. With DXY breaking the 61.8 I see this continuing bullish but my other thought is it could have just passed the 61.8 but when it retests it, it will fall back down to the 50 and then go back up to the 103 area.

USDCAD: Ranging or Bounce UpEither USDCAD will remain ranging this week or bounce up soon from the daily support esp with weaker USoil lately. Waiting for stronger bullish bounce before setting up a buy stop order @1.32, with TPs at R1 and R2 pivot lines, and SL near daily support line.
D:
W:

Hershey's CoCo Sector Report - January 28, 2017Materials and Finance both started the week flat, moved up for a couple days, then remained steady on Friday while the US and World markets were down. If the US and World indexes are up next week I expect much from these two!
Real Estate and Consumer Staples (Non-Cyclical) were the clear Sector losers taking back all the gains they made early in the week to finish weak.
Materials had over 60 stocks > 5% for the week... compare that with Real Estate that had only 9!
Good trading!
Brian Hershey
*****************************
Check out my "Hershey's CoCo World" indicator, available now for your US stock and sector evaluations.
"CoCo World" helps to answer the following question: Is this stock moving alone or with the US and world markets? No stock is an island, so it's important to see what everyone else is doing. Useful across all time frames, small and packed with info!

CABLE Validates Classic Opening GAP Price ReversalCABLE @1.2594 N. High Confirms Price Reversal After Opening GAP similar to the what transpired from POST UK Exiting ERM dated Sept 1992. Even when there was a follow-through on the way up, only then when price levels sets a new high for the new month of January can we claim a validation & confirmation.
The classic opening gap was indeed a price reversal even after touching its previous low @1.1986 before making a follow-through to the upside. This was in line with the extension levels of the DXY @103.55 high that gave way for a corrective move lower until today currently below 100 basis point. Alternating trade sequence with the DX Futures Short @103.48 is a strategic move to cover any adverse / contrary price direction from the prevailing major trend as prices for CABLE are well within a down trend in spite of its recent rally. Therefore never discount the probability of price pullback in either direction. This provides traders the ability to maintain an ' UNBIAS' stance in their market analysis.
CABLE is trading @1.2594 as a new high for January can find some resistance @1.2775 - 1.2880 levels. That is there would be more interest for CABLE to build up its momentum as long as the USD does continue to trade weaker.

EURSEK: Bullish + CorrelationIf CHFNOK is breakingdown and EURSEK breaking out, SEKNOK should breakdown too. (NOKSEK to go up)


Long Correlation into Trumponomics |JCJ IndexDispersion is at extreme levels whilst equity vol is still rather low. A correlation trade into the inauguration will likely perform across all potential economic outcomes.

Oil to Ruble correlationThere's no secret the oil price is a proxy to Russia economic expectations, yet oil correlation to RUBUSD (line chart, inverted to a more common USDRUB cross) is just impressive. Trading dynamics on both instruments is close to identical most time during the year.

Correlation Trade To WatchKeep an eye on this correlation setup over the coming days and weeks. The correlation is falling apart between AUDCAD & NZDCAD as you can see in the box on the right. You will notice the left box, when the spread got to approximately 400 Pips the correlation began to return, handing those in the trade a great return.
The spread is currently approximately 200 pips, we could see it widen over the coming days and weeks. One should be ready to take positions if we see the spread get to approximately 400 Pips.


Gold VS Silver : Pick the right one either for long or short !The US election is taking place as I am writing these lines... As a protection, a lot of investors and traders are willing to add some gold (or silver) to their portfolio, which sounds like a great idea because of the uncertaincy of this very particular event.
But on that strategy, you should be careful to the one you are picking, weither you go for long or short (depending on your own scenario of the vote outcome). Before the beginning of November, gold and silver were quite correlated. But since the 31st October, this correlation has changed : silver tends to get stronger than gold .
Whatever the reason of that could be, here is the conclusion you should take for your precious metals' investments :
- Better use Silver for long positions
- Better use Gold for short positions
Moreover, if you guys strongly believe that this situation will remain for the next few trading sessions, you can also try to initiate an arbitrage position : buying silver AND selling gold, so that you could take profits from the difference.

Prediction of the S&P500 and NIkkei based on financials and CPIIn the following content i will explain how you can forecast the market with CPI (inflation) and Financials:
If we look at our figure we can say a few things, i will assume them below:
1. ABN AMRO (a dutch Financial) is highly correlated to the NIKKEI225 index.
2. Since nearly May 2016 we can see that the CPI (inflation)-chart has change 5 times. If we look at the Nikkei225 index we can see a few things: when the inflation in the US rose, the Nikkei225 fell 4 out 5 ( a chance of 90% or mathematical: a chance of 0.900). Using maths we know that ABN AMRO has an statistic correlation of 0.70 < r < 0.90 (70% - 90%) to the Nikkei225.
Conclusion: The fInancials are following the NIkkei225, and in turn the Nikkei is following the US CPI (inflation) in a divergence/opposite movement.
3. We can use the inflaton from the US as a staircase for the movement in the S&P500 (on this moment a consolidating market)
Sources: Bloomberg Markets, ING Technical Analyses
NOTE: I don't make any predictions, making decisions based on my reports is at you'r own risk!

Potential Retest of August LowETH recently went below the 2 week support — correlated with BTC move upward. Now retracing in continued BTC correlation. IF BTC uptrend continues, I suspect to see ETH dive toward 30d low. I will be monitoring trade relevance over the next 12 hours looking for entry confirmation. Stops are currently set tight.

XAUUSD NZDUSD and USDCAD ... and shortterm correlationsXAUUSD NZDUSD and USDCAD ... and shortterm correlations

BofA AA Corp Bond Spread vs. S&P500, SPX Correlation, ROC (%Chg)I published and embedded this chart again because the CC and ROC indicators weren't updating when you moved the chart forward.

6) The Japanese market will help timing the collapse (US+EU)August 15, 2016
Hello folks ! So almost everything is written on the chart. Don't take it for granted, as I do not possess a crystal ball. However, one thing is clear: prices that are displayed vary across brokers' platform(s) for a battery of reasons (Futures, Market Makers, Bid/Ask spread or average price etc.)
There is one thing to take back home though: 50% and mean reversion has always been one of the keys.
The signal is clear here: 17500 is the target and short should be triggered. It also acted as a strong resistance many many years ago :)

Classification by Correlationdataunion.tistory.com
Overweight portfolio
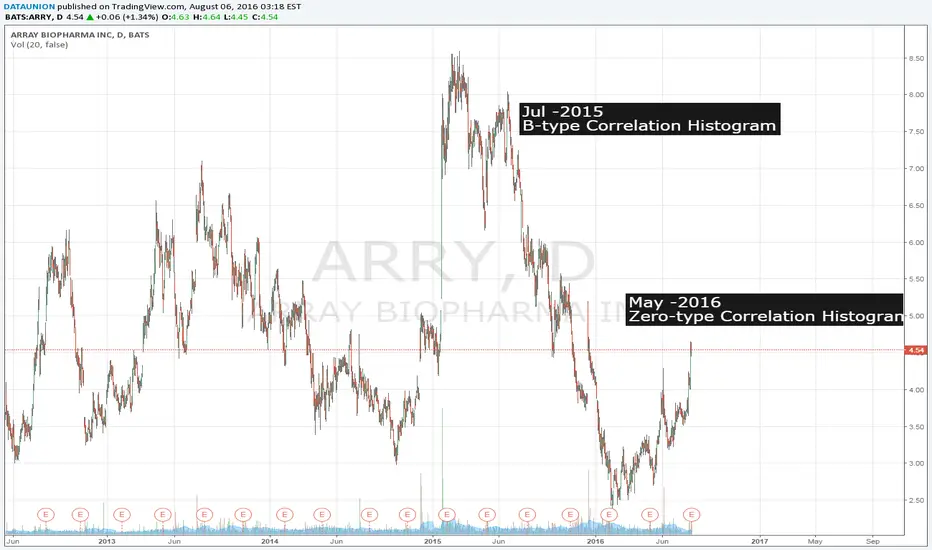
JUL-2015 Zero-type Correlation Histogram
MAY-2016 Zero-type Correlation Histogram

WhiteHorse Finance Correlation HistogramCorrelation Histogram Type Description
Zero Correlation Histogram
- The stock pair is concentrated in the correlation coefficient zero.
- Case the diversification, Zero type will Overweight of the portfolio.
- And, Zero type are often low volatility.
Type A Correlation Histogram
- The stock pair is concentrated in the plus high correlation coefficient and minus high correlation coefficient.
- The A type will underweight of the portfolio.
- This is not a normal distribution.
Type B Correlation Histogram
- The stock pair is concentrated in the plus high correlation coefficient.
- The B type will underweight of the portfolio.
- This is not a normal distribution.
Type C Correlation Histogram
- The stock pair is concentrated in the minus high correlation coefficient.
- The C type will underweight of the portfolio.
- This is not a normal distribution.
dataunion.tistory.com

USDJPY Buy correlation trade GBPJPYThis buy is correlated to the pound yen buy on support.
Be aware of NFP at the end of the week

AUDUSD NZDUSD 5M - Correlation ArbitrageCorrelation arbitrage - Published 04.08.2016
Please change timeframe to 5 minutes.
I'm not recommending an arbitrage play at this time. I'm only trying to open up the eyes of traders to these 'arb' plays. AUD and NZD are high correlated due to their interlocking economiesand both trade at a fair spread to the USD. So when you see these pairs go their separat ways there is usually a way to profit.
First you have to look at a fairly low timeframe 5M does it for me, also when you look at the divergence always look at a long time graph (Tradingview isn't displaying enough data) minimum of 2 months of data.
See attach photo.
If you trade small enough you can afford to keep the position even it moves rather hard against you and you don't have to close a floating loss untill the pairs are correlated again.

Could be getting a nice correlation setup tonightCould be getting a nice correlation setup tonight between AUDJPY and NZDJPY. As the correlation widens the opportunity may present itself to initiate a position. If we get confirmation from our algorithm we will be announcing it on our trading floor.
