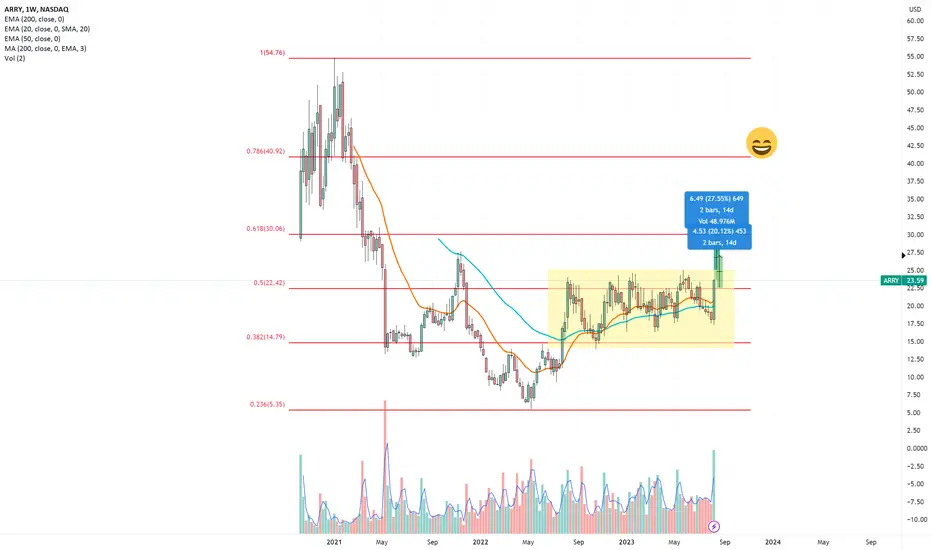
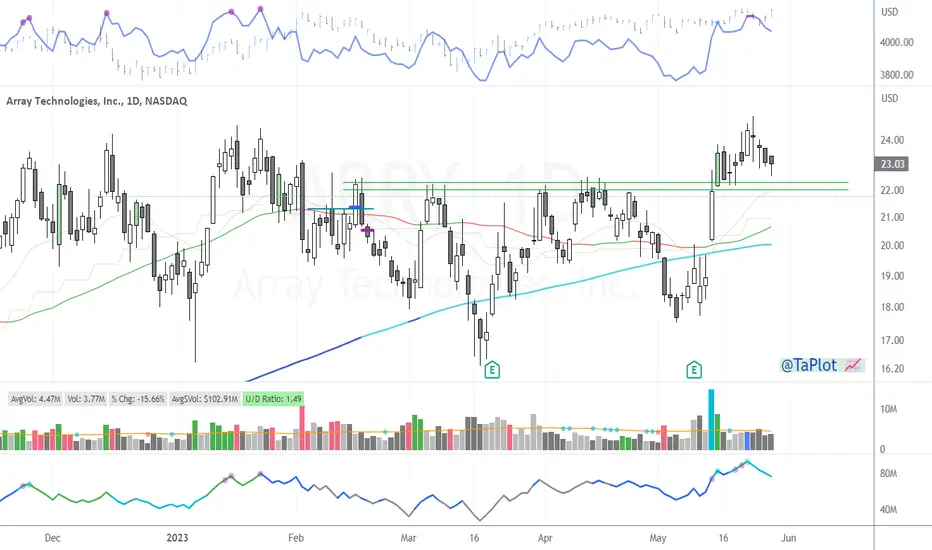
ARRY - Macro accumulation ModelWhat is good - So ARRY is currently in a massive accumulation range
You would want to see another structured move down to create move structure because I do not typically like these sort of entries.
If confirmed you are looking at a potential 300% play on this one.
Keep it on the radar guys-
Compare with Array Technologies, Inc.
−0.97 USD
−52.23 M USD
1.28 B USD
151.08 M
Last report date
Aug 5, 2026
Report period
Q2 2026
EPS
0.24 USD
Revenue
342.06 M USD
Earnings call summary
Q2 2026 saw revenue surge 53% sequentially to $342 million, with record profitability and a $2.5 billion order book. Guidance for full-year revenue and earnings was reaffirmed or raised, supported by strong execution, innovation, and robust demand, while risks remain around project timing and margin mix.
Details
Sector
Industry
CEO
Kevin George Hostetler
Website
Headquarters
Albuquerque
Founded
1989
IPO date
Oct 15, 2020
ISIN
US04271T1007
CUSIP
04271T100
FIGI
BBG001V4SF46
Identifiers
ISIN US04271T1007
Array Technologies, Inc. manufactures ground-mounting systems used in solar energy projects. The company sells its products to engineering, procurement and construction firms that build solar energy projects and to large solar developers, independent power producers and utilities, master supply agreements or multi-year procurement contracts. It has offices in Europe, Central America, and Australia. The company's products include DuraTrack and SmarTrack. Array Technologies was founded by Ronald P. Corio in 1989 and is headquartered in Albuquerque, NM.
Markets overreact, and sometimes, that’s opportunity.Positions:
Exp 20 March – Strike 9
Exp 17 April – Strike 11
Exp 17 April – Strike 7 (this is the gold one)
I believe the market significantly overreacted. Revenue is growing, the company has a solid outlook, and while sector concerns remain, a 35% drop after the earnings report is not justified.
ARRY Aims for a Bright Future Array Technologies is currently testing the bottom of a key weekly gap near the $7.50 level, a major support zone that has historically produced strong reversals. A breakout above the $10.00 level would confirm renewed bullish momentum and open the path toward the $16.23 resistance, aligning with pr
Array Technologies Chart Fibonacci Analysis 092225Trading Idea
1) Find a FIBO slingshot
2) Check FIBO 61.80% level
3) Entry Point > 8.2/61.80%
Chart time frame:B
A) 15 min(1W-3M)
B) 1 hr(3M-6M)
C) 4 hr(6M-1year)
D) 1 day(1-3years)
Stock progress:B
A) Keep rising over 61.80% resistance
B) 61.80% resistance
C) 61.80% support
D) Hit the bottom
E)
ARRY bullish reversal caseStrategy Details:
• Buy 1 ARRY Sep 19 ’25 5 Call at ask price ~0.85 (implied vol ~70%).
• Sell 1 ARRY Sep 19 ’25 6 Call at bid price ~0.30 (implied vol ~70%).
• Net debit (cost): ~0.55 per share (or $55 per contract).
• Max profit: 0.45 per share ($45 per contract) if ARRY ≥ 6 at expiration.
•
ARRY swing play🔎 Chart Analysis (1H + swing view)
• Current price: ~$6.08
• Support: $6.00 (holding right now), stronger at $5.50
• Resistance: $7.00 → $8.00 → $9.00
• Trend: Price has been in a steady downtrend, but sitting right at a key demand zone (yellow marker).
• If it holds $6, this could be a swing l
See all ideas
Summarizing what the indicators are suggesting.
Neutral
SellBuy
Strong sellStrong buy
Strong sellSellNeutralBuyStrong buy
Neutral
SellBuy
Strong sellStrong buy
Strong sellSellNeutralBuyStrong buy
Neutral
SellBuy
Strong sellStrong buy
Strong sellSellNeutralBuyStrong buy
An aggregate view of professional's ratings.
Neutral
SellBuy
Strong sellStrong buy
Strong sellSellNeutralBuyStrong buy
Neutral
SellBuy
Strong sellStrong buy
Strong sellSellNeutralBuyStrong buy
Neutral
SellBuy
Strong sellStrong buy
Strong sellSellNeutralBuyStrong buy
Displays a symbol's price movements over previous years to identify recurring trends.
Maturity dateDec 1, 2028
Coupon1.00% (Fixed)
See all ARRY bonds
Frequently asked questions
The current price of ARRY is 5.55 USD — it has increased by 5.71% in the past 24 hours. Watch Array Technologies, Inc. stock price performance more closely on the chart.
Depending on the exchange, the stock ticker may vary. For instance, on NASDAQ exchange Array Technologies, Inc. stocks are traded under the ticker ARRY.
ARRY stock has risen by 5.51% compared to the previous week, the month change is a −14.48% fall, over the last year Array Technologies, Inc. has showed a −6.96% decrease.
We've gathered analysts' opinions on Array Technologies, Inc. future price: according to them, ARRY price has a max estimate of 13.00 USD and a min estimate of 6.00 USD. Watch ARRY chart and read a more detailed Array Technologies, Inc. stock forecast: see what analysts think of Array Technologies, Inc. and suggest that you do with its stocks.
ARRY reached its all-time high on Jan 8, 2021 with the price of 54.78 USD, and its all-time low was 3.76 USD and was reached on Apr 9, 2025. View more price dynamics on ARRY chart.
See other stocks reaching their highest and lowest prices.
ARRY stock is 8.85% volatile and has beta coefficient of 1.48. Track Array Technologies, Inc. stock price on the chart and check out the list of the most volatile stocks — is Array Technologies, Inc. there?
Today Array Technologies, Inc. has the market capitalization of 854.74 M, it has decreased by −12.37% over the last week.
Yes, you can track Array Technologies, Inc. financials in yearly and quarterly reports right on TradingView.
Array Technologies, Inc. is going to release the next earnings report on Nov 5, 2026. Keep track of upcoming events with our Earnings Calendar.
ARRY earnings for the last quarter are 0.24 USD per share, whereas the estimation was 0.12 USD resulting in a 97.22% surprise. The estimated earnings for the next quarter are 0.11 USD per share. See more details about Array Technologies, Inc. earnings.
Array Technologies, Inc. revenue for the last quarter amounts to 342.06 M USD, despite the estimated figure of 312.97 M USD. In the next quarter, revenue is expected to reach 344.91 M USD.
ARRY net income for the last quarter is 24.35 M USD, while the quarter before that showed 2.00 M USD of net income which accounts for 0.00% change. Track more Array Technologies, Inc. financial stats to get the full picture.
No, ARRY doesn't pay any dividends to its shareholders. But don't worry, we've prepared a list of high-dividend stocks for you.
As of Aug 8, 2026, the company has 1.2 K employees. See our rating of the largest employees — is Array Technologies, Inc. on this list?
EBITDA measures a company's operating performance, its growth signifies an improvement in the efficiency of a company. Array Technologies, Inc. EBITDA is 96.11 M USD, and current EBITDA margin is 10.25%. See more stats in Array Technologies, Inc. financial statements.
Like other stocks, ARRY shares are traded on stock exchanges, e.g. Nasdaq, Nyse, Euronext, and the easiest way to buy them is through an online stock broker. To do this, you need to open an account and follow a broker's procedures, then start trading. You can trade Array Technologies, Inc. stock right from TradingView charts — choose your broker and connect to your account.
Investing in stocks requires a comprehensive research: you should carefully study all the available data, e.g. company's financials, related news, and its technical analysis. So Array Technologies, Inc. technincal analysis shows the sell today, and its 1 week rating is sell. Since market conditions are prone to changes, it's worth looking a bit further into the future — according to the 1 month rating Array Technologies, Inc. stock shows the sell signal. See more of Array Technologies, Inc. technicals for a more comprehensive analysis.