Correlation Between BTC and NDXTNumerous podcasts and other news sources suggest that there exists a strong positive correlation between BTC price and the price of tech stocks. To test this notion, I plotted the BTC closing price and the NASDAQ 100 Technology Sector (NDXT) closing price on the daily time frame. Based on visual inspection of the upper panel of the chart, there are time periods during which there exists a strong positive correlation, time periods during there exists little to no relationship, and time period during which there exists a strong negative correlation.
Given in the lower panel is the Pearson correlation coefficient value over time (red, white, and red solid line), the 95% confidence interval for the correlation coefficient (boundaries of the confidence interval is given by the solid cyan lines), the lower limit of the correlation coefficient (lower limit = -1.0, white dotted line), upper limit for the correlation coefficient (upper limit = +1.0, white dotted line), and probability value (P value, yellow histogram) for the correlation coefficient. Note that the correlation coefficient is considered statistically significant (i.e., highly unlikely to be due to chance) when the P value is less than 0.05.
When the correlation coefficient line is green, there is a statistically significant positive correlation between the BTC price and the NDXT price.
When the correlation coefficient line is red, there is a statistically significant negative correlation between the BTC price and the NDXT price.
When the correlation coefficient is white, there is no meaningful relationship between the BTC price and the NDXT price.
An important caveat to note: Each Pearson’s correlation coefficient is calculated on 20 days of price data.
This is not financial advice. I am not your financial advisor. This is my opinion.
Correlation

Bitcoin and ESmini Hard core correlationJust a visual on how correlated these two tickers are. Pivots line up eerily close, though price reacts at different degrees of magnitude.
More up dates in my other locations. Cheers

USDJPY Could Retest The Highs, While US Bonds Are DownHello traders!
Today we want to share an intraday update for USDJPY pair in which we see nice and clean bullish impulse in progress, ideally back to highs for wave 5 that can retest the highs and 125 - 126 area.
The main reason why USDJPY may stay up is still an unfinished five-wave decline on 10Y US Treasury Notes.
As you can see, there's a negative correlation, so if bonds are still pointing lower for wave (5), then USDJPY could easily stay up, while the price is above 123.05 invalidation level.
Trade well!
If you like what we do, then please like and share our idea.
Disclosure: Please be informed that information we provide is NOT a trading recommendation or investment advice. All of our work is for educational purposes only.

How To Invest In Bitcoin & Ethereum Using S&P500 IndexIn this video, I explain how Ethereum and Bitcoin have been trading in tight correlation to the U.S S&P500 stock market Index.
I will show you how to use historical Volatility, to know how much the two cryptocurrencies fluctuate on average per month, alongside price swings in the S&P500.
Equipped this this knowledge, you will be able to see when the S&P500 pulls back within its long-term bullish trend, this is the time to buy Ethereum and Bitcoin.
Its been well documented in the media about this correlation, but let me show you how to make money from it.

DXY I am looking to see DXY shoot to the given resistance level. As we can see we are in an ascending channel, let's see how it goes.

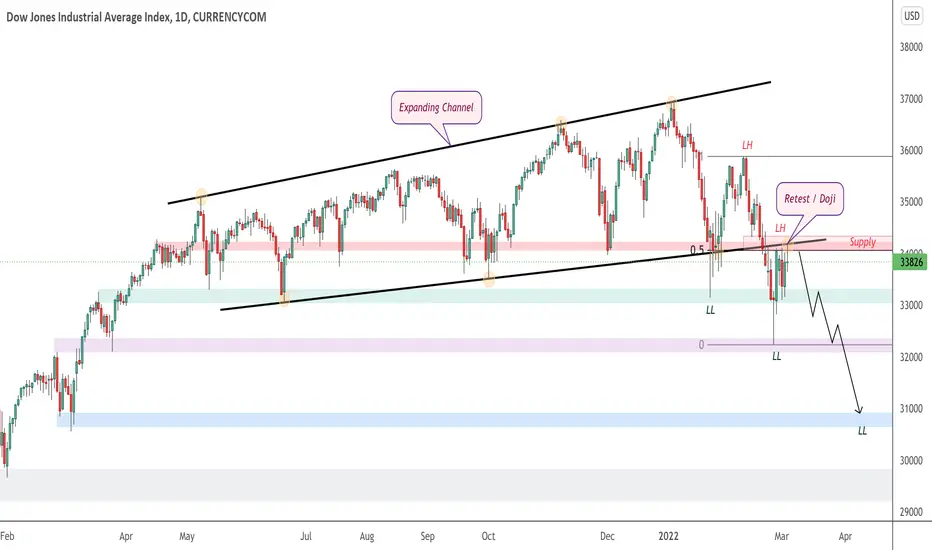
US30 Daily Price was previously in a rising expanding channel, then a breakout to the downside occur, & current market structure is a downtrend where price is now forming lower lows & highs. Price has now made a new lower high, making a retest of the broken channel. This zone also aligns perfectly with the 50% fibonacci retracement & a strong zone of previous support now new resistance. Price has been stalling at this region all week now, & today a Doji indecision candlestick has formed. I am now anticipating for price to remain below this supply region, & form a new potential lower low towards a strong area of daily demand below.
Stonk-Crypto Update (#10) : Crypto/Stocks ready to Decouple ?Here's your weekly update ! Brought to you each weekend with years of track-record history..
Don't forget to hit the like/follow button if you feel like this post deserves it ;)
That's the best way to support me and help pushing this content to other users.
Kindly,
Phil

BTC vs Gold vs NASDAQ CorrelationAn overview comparison of the correlation between BTC, Gold, and Stock (NASDAQ).

DXY MELTING!I am looking to see DXY melt. Let see how it reacts to the given resistance zone. Lets hope for the best.

NAS100 H1Price has previously created a rising wedge pattern, & has broken it to the downside after failing multiple times to break above key level resistance, which aligns with the higher timeframe descending trend line which was rejected for a "3rd time today. Price also has formed a head on shoulders formation on the lower timeframe & has made a successful break & retest of the neckline. I am watching the intraday supply zone here for price to print a fresh lower high, where then on the lower timeframe I will be anticipating for price to make a lower low towards 4 Hour support below.

DXY MELTING!I am seeing a lot of weakness in the US Dollar. I have set the first tp zone but if things continue this way we may see the dollar reach the 94.415 level. Let's see how it goes.

If Gold Drops BTC Will RiseStrong correlation! Looks like BTC is going to rise as capital flows from risk-on to risk-off assets.

Interesting Correlation between 2y10y spread and BitcoinHello Traders,
There is an interesting correlation between Bitcoin and spread of US 2 year bond and US 10 years.
Correlation looks affirmative from the early 2020 until now.
Even on smaller time frames correlation can be observable.
Wanted to share that,
Stay safe!

Gold Bullish FlagHey traders, in the coming week we are monitoring XAUUSD for a buying opportunity around 1895 in case of a breakout, once we will receive any bullish confirmation we will buy the retrace.
Trade safe, Joe.

Stocks Will Stabilize When Aussie Finds The SupportHello traders and investors!
Today we will talk about stocks and Aussie (AUDUSD) pair regarding risk-on/risk-off sentiment, so if you are wondering when stocks will be back to bullish mode, then keep an eye on Aussie.
As you can see on the left correlation chart between SP500 and AUDUSD pair, always when Aussie finds the support, we see SP500 stabilization.
Well, if we take a look on the right Aussie chart from Elliott Wave perspective, we can clearly see a corrective movement, ideally a complex (W)-(X)-(Y) decline. We are already tracking final wave (Y), but it has to be finished in three legs A-B-C and as you can see, wave C is still missing.
So, if we are on the right path, then stocks might not be ready for a bull-run yet, until Aussie fully completes its corrective decline, where final leg may also occur as a spike down like back in March 2020 and January 2019.
Trade well!
If you like what we do, then please like and share our idea.
Disclosure: Please be informed that information we provide is NOT a trading recommendation or investment advice. All of our work is for educational purposes only.

Mon 14th Feb 2022 Daily Forex Charts : 3x New Trade SetupsGood morning fellow traders. On my Daily Forex charts using the High Probability & Divergence trading methods from my books, I have identified 3x new trade setups this morning. As usual, you can read my notes on the chart for my thoughts on these setups. The trades being a EUR/CHF Sell, EUR/JPY Sell & EUR/USD Sell. Watch the overall risk due to the high correlation between these trades, as all involve the EUR. Enjoy the day all. Cheers. Jim

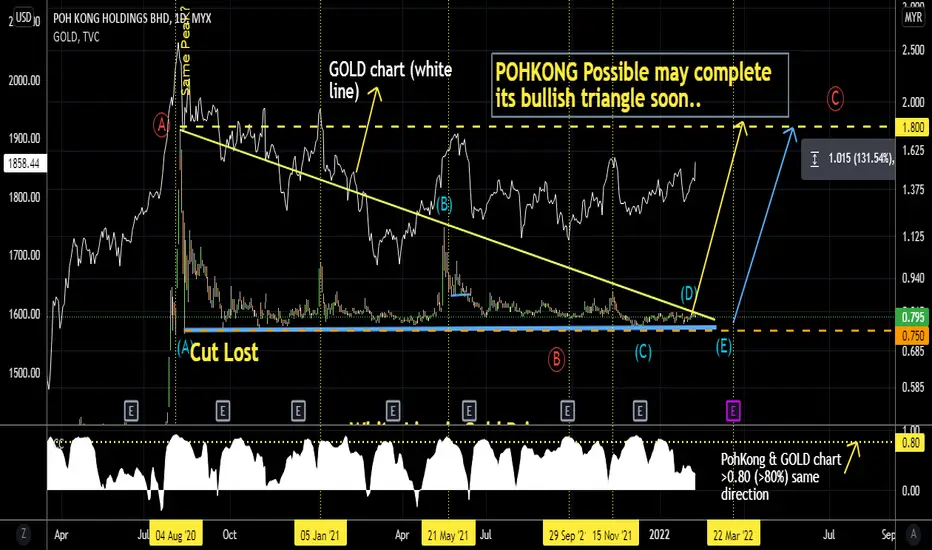
POHKONG and GOLD correlation chart. 13/Feb/22POHKONG's bullish triangle seem still valid.. perhaps..still waiting for GOLD price surging up to all time high again...
Dollar Index's correlation w/ Gold. 13/Feb/22Dollar Index (DXY)'s 98-99 possible a strong Resistance for it to complete wave D ( Yellow) of long term triangle pattern.

US 10 Years Bond Yield Correlation w/ GOLD. 13/Feb/22US10Y possible completed its "correction" @ around 2.500 (%).... A Time when stocks listed in Nasdaq starting to "fly" again?...

DXYMy sentiment on DXY is to still keep the bull momentum until the given tp is reached. Let's see how it goes, share your thoughts too.

DXY I am seeing the dollar index going back to the previous resistance zone. Let's see how it goes. Remember a bias on the dollar assists in correlation to other pairs with USD as their base or quote currency.

CPR monthly: every month we are getting crushed, but why today? December, January and February: 3 months in a row bitcoin is getting hitting the pivots from below and making a new lower low.
How long can this go without ANY decent relief rally.
Today's Paypal and Meta showed horrible after hour moves, over 20% down.
This should drag the NASDAQ down too.
And we know what this means: BTC will move bearish or sideways base case scenario for the day.
Let's keep an eye on that 35.2K and let's see if it holds as that would prove the needed strength to make ANY upside move in the next upcoming days.

MicroStrategy testing FibonacciWe can see a high correlation between the company and BTC since the pandemic.
Looking at the monthly chart, the fact is that the price is now in an important Fibonacci region at 50%.
On the 1-hour chart, on the ADX indicator, we can see a decrease in the selling force (red arrows), and an increase in the buying force (green arrows),
forming a kind of symmetrical triangle, signaling a temporary indefiniteness.
I'm waiting in the cabin to see what happens.
