Yen Major Move Up Coming! Custom COT Indicators!Overview.
-This is the Beginning of a Educational Series from Jake Bernstein to the TradingView Community.
-Many Traders use the COT Data Incorrectly.
-Jake Discovered if You Look at the Net Commercials and Take Note When Commercials net Buying is Either At All Time Highs, Or Net Buying = Longest Period of Buying Look for an Extreme Move To the Upside.
-In The Future We Will Show Precise Entry Signals…But a Basic Entry Signal Is When Commercials Go From Net Long to Net Short.
-Full Credit in Methodology goes to Jake Bernstein at www.Trade-Futures.com and www.2Chimps.net
Thought Process:
-Commercials Represent Large (Typically Billion Dollar) Companies.
-Take Note - When Commercials Are Buying at Record High
-Take Note - When Commercials Are Buying For Record Long Periods of Time
***Note…Commercials Can Buy For Extended Periods Dollar Cost Averaging…
***Basic Entry Listed In Overview.
***More Precise Entries Will Be Introduced Soon.
Take Note When Commercials STOP Buying and START Selling
Indicator Shows Net Commercials
-Full Credit goes to Greeny for Creating Original Code. I only made slight modifications.
Lower Indicator Modifications include
-Took Off Net Long and Short Individual Plots
-Added Optional Background Highlighting when Commercials Switch from Long to Short
-Added Optional Alert Capability If Commercials Go From Net Long to Short
-Ability to Show INVERSE - This makes it Easier for some Traders to See…Since the Signals look similar to MacD/RSI Type Indicators.
Upper Indicator Modifications include:
-Added Ability to Plot Text Entries when Commercials Switch From Net Long To Short
-Added Optional Background Highlighting when Commercials Switch from Long to Short
-Added Optional Alert Capability If Commercials Go From Net Long to Short
***Additional Indicators and Updates Coming Soon
***Link To Lower Indicator & Upper Indicator Below Under Related Ideas:
COT

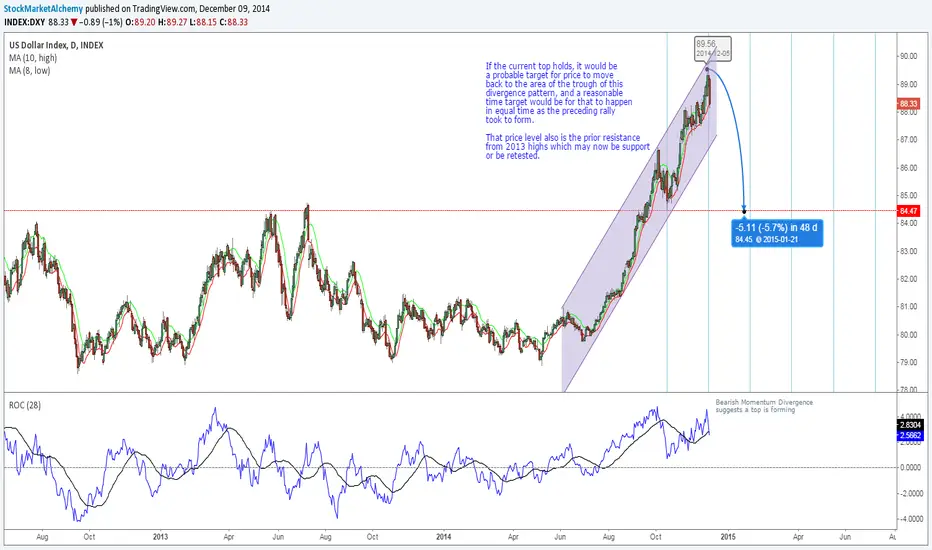
US Dollar Index To Fall - First Support at 84.50The US Dollar Index has been rising strongly for most of this year, coincident with a major decline in broad based commodity indexes. However, we are currently seeing signs that the current price level may be the end of this strong run and lead to a major consolidation - likely coincident with a rally in overall commodities.
This chart shows the daily Dollar Index. There is a notable divergence on the momentum indicator between the October high and the current December high. The notes on the chart show that a typical price target after a divergence pattern would be for a retracement to the price low of the divergence pattern - in this case at about 84.50 which would be the next major horizontal price support on the chart.
Also while not shown on the chart the current Commitment of Traders data shows that the large speculators maxed there net long position at the October high as well, and the current run up from Oct to December has been on commercial buying which is opposite their normal pattern, and is a typical and classic sign of capitulation in a trend. This creates a compelling technical set-up for a sell out or short position. And the CoT data gives us confirmation from the "fundamentals" as evidenced in the extreme net short of the "smart money" commercial traders. The divergence or capitulation in commercial positions just gives us another aspect of market psychology suggesting that the trend is very close to an end.
New COT Analysis XAU/USD 19/09/14My previous interpretation of this value was that I looked if the potential went lower or higher than previous week for defining a trend.
But after watching a bit back in the past it shows more accuracy if the trend is defined by the point 1.
If the potential wents from over 1 to under 1 it becomes an uptrend.
If the potential wents from under 1 to over 1 it becomes a downtrend.

COT Analysis 12. September XAU/USDWe had a lower shorting potential this week but the market did not go up. The COT shorting potential is a very qualitative value for predicting the market direction of the upcoming week. It depends on the relation to the last value.
The so called shorting potential is again the second time lower and the commercials are stocking up their long positions. Addiotionally we have Indian Celebration and Marriage season upcoming.

COT Analysis 5. September XAU/USDI made a calculation system which shows the shorting potential of a trading symbol through the COT report which gets released every friday afternoon. The movement for the next week can be calculated fundamentally for getting a value which just tells you the movement if you know the previous value and in this case the value for the next week is lower than the last week and this means a long potential.
Higher potential than previous week: downtrend
Lower potential than previous week: uptrend

KC shortKC broke tested for the fourth time the support at current level and broke, if there's follow through, it's a good short. Historically, July should be the seasonal low. COT report- commercial is not hedging at this point.
