GBPAUD Ready for a Breakdown?1. Retail Sentiment
62% of retail traders are long on GBPAUD, while 38% are short.
Historically, retail positioning tends to be contrarian: an excess of longs often signals further downside pressure.
Volume: 824 long lots vs 506 short lots → net long exposure.
➡ Bias: Contrarian short
2. COT Report
GBP (August 26, 2025)
Non-commercials (speculators): 76k longs vs 107k shorts → net short of -31k.
Commercials: net long, but mainly for hedging purposes.
Trend: large speculators are slightly increasing shorts (+866) while reducing longs (-5,302).
➡ Bias: GBP weakness
AUD (August 26, 2025)
Non-commercials: 28k longs vs 129k shorts → heavily net short AUD.
Commercials have significantly increased long positions (+10,892).
Speculators remain bearish, but defensive positioning is building up.
➡ Bias: AUD still weak, but showing early signs of stabilization
3. Seasonality (September)
GBP: historically negative in September (weakness).
AUD: historically shows a moderately positive trend in September, especially in the last 10 years.
➡ Bias: GBPAUD historically bearish in September
4. Technical Analysis
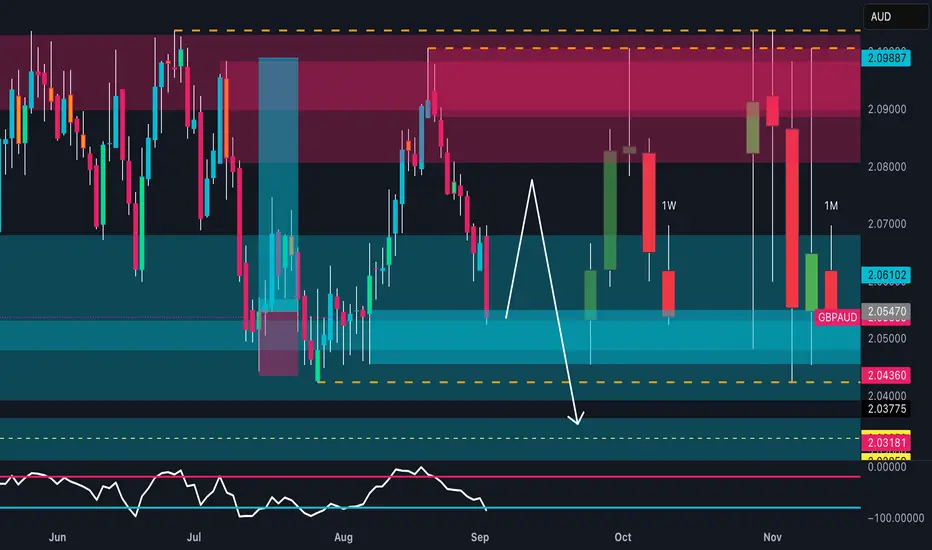
Structure: the market rejected the 2.09 supply zone and is now consolidating within the 2.03–2.09 range.
Price action suggests a possible rebound towards 2.07–2.08 before a potential breakdown towards 2.03.
➡ Technical bias: Short from supply zones at 2.07–2.08 targeting 2.04–2.03
5. Summary & Trading Scenarios
Macro/COT: GBP remains weak, AUD under pressure but with accumulation signs → mixed outlook, but seasonality favors AUD.
Sentiment: retail traders excessively long → confirms short bias.
Technical: bearish structure with key supports at 2.0430 and 2.0318.
👉 Conclusion: At the moment, GBPAUD shows a bearish bias supported by retail sentiment, seasonality, and price action. The most likely scenario is a test of the 2.04–2.03 zone in the coming weeks.
COT
AUD/USD – Last Push Before September Weakness?1. Retail Sentiment
77% of retail traders are currently short on AUD/USD, with an average entry around 0.6459. Historically, when retail positioning is heavily skewed to one side, the market often moves in the opposite direction. This suggests short-term upside potential (contrarian perspective).
2. COT Report (AUD & USD Index)
AUD (CME): Non-Commercials remain heavily short (129k vs 28k long), keeping speculative positioning bearish on AUD. However, Commercials significantly increased their long exposure (+10,892), indicating institutional accumulation.
USD Index (ICE): Non-Commercials hold 19k shorts vs 13k longs, showing a bearish tilt on USD, with additional shorts added (+1,916). Commercials remain net long (12k vs 6k short), defending dollar strength.
➡️ COT Takeaway: Speculators remain bearish on AUD and moderately bearish on USD. This divergence suggests potential sideways movement or consolidation in the short term.
3. Seasonality (September)
Historically, September has been a weak month for AUD/USD, with negative performance across the past 5–15 years. Seasonal curves confirm a bearish bias, especially in the first half of the month.
4. Technical Analysis
Supply Zone: Approaching strong weekly/monthly supply at 0.6600–0.6650.
RSI: Rising toward overbought, pointing to possible exhaustion of bullish momentum.
Structure: Price may complete a test of 0.6600–0.6650 before retracing back to demand zones at 0.6450 and 0.6400.
Trend Dynamics: The medium-term trend remains bearish, with corrective rallies providing opportunities to short.
Operational Outlook
Short-term Bias (1–2 weeks): Potential final push toward 0.6600–0.6650, driven by contrarian sentiment and COT divergence.
Medium-term Bias (September): Expected weakness with downside targets at 0.6450 → 0.6400, aligned with seasonality and speculative positioning.
Strategy: Look for short reversal setups around 0.6600–0.6650 with H4/H1 confirmation (structure break or engulfing pattern). Stop above 0.6700, targets at 0.6450 / 0.6400.

EUR/USD at a Breaking Point: 1.1450 Demand in FocusCommitment of Traders (COT)
USD Index (ICE Futures): Non-Commercials reduced both long (-1,370) and short (-1,629) positions. Positioning remains net short on the dollar (11,359 long vs 17,347 short), signaling relative weakness of the greenback.
EUR Futures (CME): Non-Commercials significantly increased long positions (+6,420) and also added shorts (+3,106), but net long exposure remains dominant (252,719 long vs 133,974 short). This reflects renewed bullish interest in the euro.
📌 COT Summary: Institutional flows indicate a bullish bias on EUR and bearish bias on USD, supporting a medium-term long outlook on EUR/USD.
Seasonality
August is historically a weak month for the euro: seasonality shows, on average, a decline in EUR/USD during the second half of the month into early September, followed by a recovery later in Q3.
📌 Seasonal Bias: Slightly bearish in the short term, with potential for a rebound later.
Retail Sentiment
58% of retail traders are short EUR/USD, compared with 42% long.
📌 Contrarian view: This increases the probability of a bullish move, as retail positioning is skewed against the trend.
Technical Context
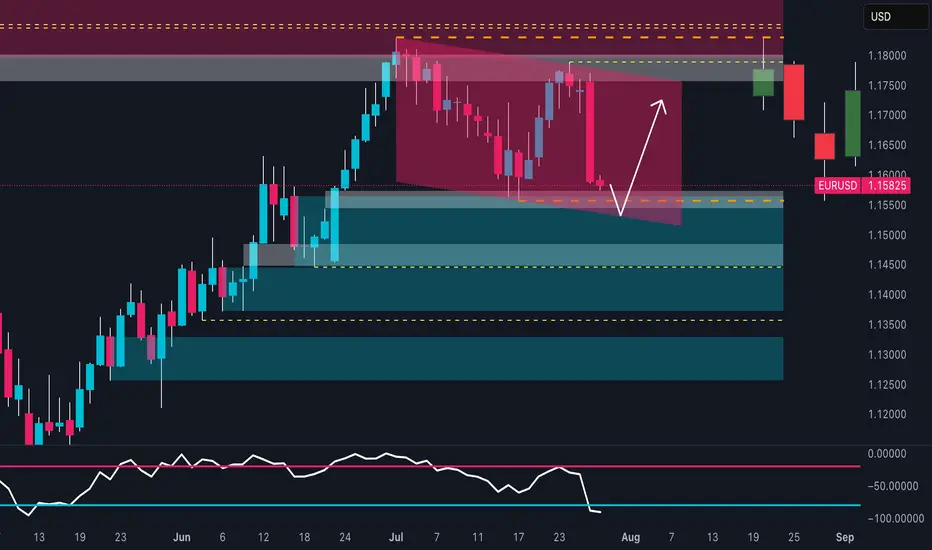
Structure: EUR/USD is trading at 1.1636, within a range, with a supply zone above 1.1750 and a key demand zone between 1.1520–1.1450.
RSI: Neutral, with no extreme overbought/oversold conditions.
Primary Scenario: Potential further dip towards 1.1520–1.1450, where institutional buyers may re-enter.
Secondary Scenario: If this support breaks, the next target lies in the 1.1350–1.1400 zone.
Key Resistance: 1.1750–1.1800.
📌 Operational View: The market may still release downward pressure in the short term, but the 1.1450–1.1500 area appears strategic for potential long entries aligned with COT and sentiment.

XAU/USD: Gold at Make-or-Break – Will 3400 Hold or Break?Macro & Fundamental Context
Gold remains highly influenced by Fed rate expectations: Powell’s speech at Jackson Hole opened the door to possible rate cuts as early as September. This is pressuring the US dollar lower and supporting precious metals, but at the same time, persistently high inflation and strong US macro data (PPI at the highest level since February) maintain a risk of two-way volatility.
COT & Sentiment
COT Report: Non-Commercials (speculators) remain strongly net long (275k contracts vs 62k short), but in recent weeks we’ve seen a decline of 12,800 longs and an increase of 4,000 shorts → clear signs of profit-taking.
Commercials (hedgers) remain heavily net short (316k contracts), consistent with a defensive stance at current resistance levels.
Retail Sentiment: 56% short vs 44% long → slightly contrarian, as retail traders tend to sell strength.
Seasonality
Historically, August is a bullish month for gold (+25–30 avg points over 10/15 years). However, September has one of the worst seasonal performances of the year (-11% over 20y, -29% over 10y). This reinforces the view that late-August rallies could turn into deeper corrections in September.
Technical Analysis
Daily Chart: Gold is currently testing a key supply zone at 3380–3400, with a bearish reaction already visible. RSI shows relative overbought conditions.
Key Levels:
Primary Resistance: 3400–3420 (supply + July highs).
Intermediate Support: 3280–3300 (demand zone + weekly block).
Bearish Target: 3240–3200 (major demand + bullish rejection block).
Operational Outlook
Base Case (most likely): Rejection from 3400 → retracement towards 3280/3240 → short setups favored with confirmation on H4/H1.
Alternative Scenario (less likely but possible): Breakout above 3420 with a weekly close → bullish continuation confirmed → targets at 3480–3520.
Risk Management: Extreme caution ahead of Powell’s speech and NFP release, as both could quickly invalidate setups.

USD/CAD: The Perfect Storm for a Bullish BreakoutUSD/CAD is consolidating above 1.3850 after a strong bullish impulse. The technical structure shows:
A breakout from the summer bullish channel projecting towards 1.3950–1.4050, a key weekly resistance zone.
RSI remains neutral but strengthening, with no signs of immediate overextension.
Institutional demand around 1.3700 firmly rejected the downside, signaling strong long accumulation.
📌 Key levels: Support at 1.3750 / 1.3700 – Resistance at 1.3950 / 1.4050.
Commitments of Traders (COT)
USD Index: Non-commercial longs increasing (+1,330) with a slight reduction in shorts. Moderately bullish bias for USD.
CAD Futures: Significant increase in non-commercial shorts (+7,966) while longs decline (-2,691). Institutions are clearly selling CAD.
📌 This reinforces the bullish bias on USD/CAD, with speculative positioning strongly in favor of the US Dollar.
Seasonality (August–September)
Historically, August tends to be neutral/slightly bearish for USD/CAD, but September shows a strong bullish pattern, with consistent positive averages over the last 10–20 years.
📌 This supports a continuation of the bullish trend in the coming weeks, especially towards the 1.40+ area.
Retail Sentiment
78% of retail traders are short on USD/CAD, with an average entry price at 1.3780.
Only 22% are positioned long.
📌 Classic contrarian signal: excessive retail bearishness increases the probability of further upside.
✅ Trading Outlook
The overall picture shows alignment across technicals, COT, seasonality, and sentiment. USD/CAD maintains a bullish bias:
Primary scenario: Extension towards 1.3950 and then 1.4050, a major weekly supply zone.
Alternative scenario: Controlled pullback to 1.3800–1.3750 before resuming higher.
Invalidation: Daily close below 1.3700 would open space towards 1.3550.
📌 Bias: Long USD/CAD towards 1.3950–1.4050.

Silver Roadmap: Key Supply at 38.8 or a Breakout to 39.6?Price is consolidating around 38.0, after recovering from July’s breakdown, currently sitting just below the weekly supply/resistance zone at 38.3–38.8, with liquidity resting above 39.2–39.6. The nearest and strongest daily demand lies at 36.6–35.5 (origin of the prior impulse and multi-touch base).
Momentum/RSI on the daily chart is neutral (not overbought), with the latest rally built on shallow pullbacks → a favorable context for potential “stop-hunts” above supply before the market makes a decision.
COT (Aug 12): Non-commercials remain net long but have been trimming positions (longs ↓, shorts ↑), while commercials stay net short → bullish positioning is cooling, often a precursor to range-bound or corrective phases.
Retail sentiment: roughly 52% short / 48% long, not at extremes → no strong contrarian signal.
Seasonality: August tends to be slightly bullish for silver on 10–20 year averages, while September is historically negative → current tailwind may turn into a headwind ahead.
🔎 Bias: Neutral with a bearish tilt at 38.3–38.8, unless a breakout is confirmed; elevated risk of false breaks toward 39.3–39.6 before potential downside rotation.
Key catalysts to watch: DXY and real yields (inverse correlation), gold performance, US macro releases (CPI, ISM, NFP), and Chinese data (PMIs/industrial growth).
A stronger USD or rising yields would favor the bearish case from 38.8, while a weaker USD combined with a gold breakout would increase the odds of a liquidity sweep toward 39.6.

EUR/CHF: The Trap Is Set!EUR/CHF Full Analysis
1. Seasonality
EUR: Historically weak in August–September. The 20y and 15y datasets confirm a negative seasonal bias in September.
CHF: Stronger tendency in August–September, historically supported as a safe-haven currency, with September statistically positive.
👉 Seasonal bias: short EUR/CHF (weak EUR vs strong CHF).
2. Retail Sentiment
55% of retail traders are long EUR/CHF, while 45% are short.
👉 Slight long retail positioning = contrarian bearish signal.
3. COT Report (19 August 2025)
Euro: Non-commercial net long at 252k vs 133k short (+6.4k new longs, +3.1k new shorts). Still bullish momentum, but slowing down as commercials are selling.
CHF: Non-commercial net short (6k longs vs 33k shorts). Strong bearish imbalance, but commercials are long CHF (hedging), reinforcing CHF’s safe-haven status in case of risk-off correction.
👉 COT shows overweight Euro longs and heavy CHF shorts, raising risk of a future reversal in favor of CHF.
4. Technicals
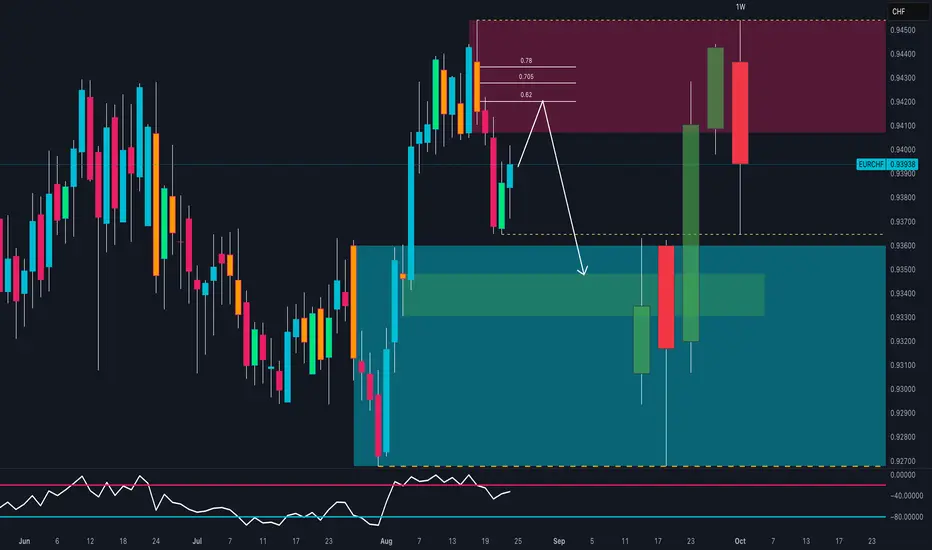
Structure: Clear rejection from weekly supply zone 0.9435–0.9450 with a bearish engulfing.
Daily RSI cooling after strong impulse → room for further downside.
Possible pullback toward 0.9415–0.9425 (Fib 0.62–0.705) before continuation lower.
Technical targets: 0.9330–0.9315 (daily demand zone), extended to 0.9260.
Invalidation: Weekly close above 0.9450.
📌 Conclusion:
Seasonality, retail sentiment, and price action align for a bearish EUR/CHF bias. The COT highlights an overcrowded long Euro vs short CHF positioning, opening space for a structural rebound of the Swiss Franc. Technicals confirm: wait for a pullback to 0.9420 to short, targeting 0.9330/0.9260.
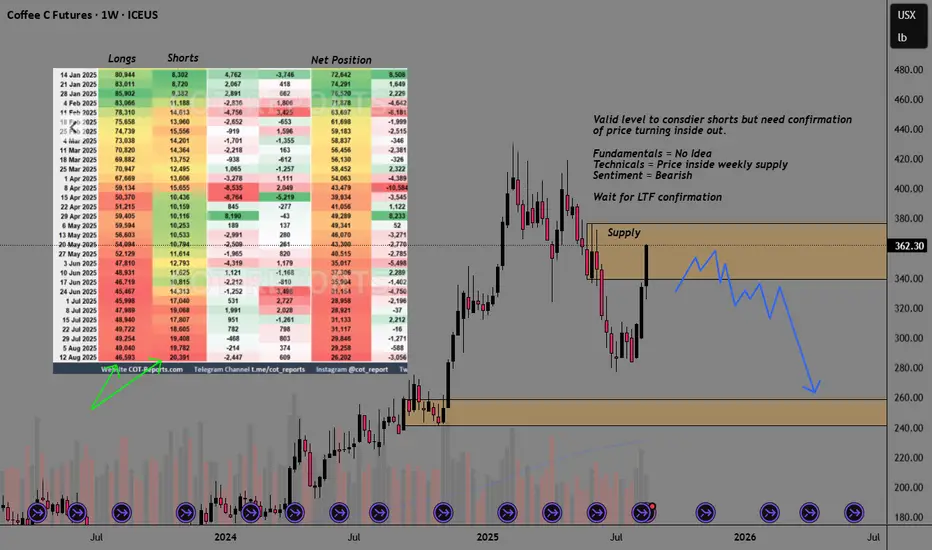
COFFEE Supply-Demand COT AnalysisSee chart for full analysis.
Overall I like looking for shorts with price inside levels of weekly supply
+ COT data suggests more selling is needed. Waiting for confirmation on LTF.
GBP/USD at Weekly Supply – Is the Pound About to Collapse?Technical Outlook:
GBP/USD is currently trading around 1.3535, testing a significant weekly supply zone between 1.3500–1.3600. The recent bullish impulse has brought price back into a strong confluence area marked by prior distribution in late July. The RSI is approaching overbought levels on the daily chart, suggesting a potential short-term exhaustion of buying momentum. My base scenario anticipates a rejection from the current zone, with the possibility of a retracement toward 1.3250–1.3150, aligning with the next demand area and historical price reaction. The projected short-term pattern shows a potential lower high forming before a deeper move down toward the yearly lows.
COT Positioning:
USD Index (as of 05 Aug 2025): Non-commercials decreased longs by -2,561 and slightly increased shorts (+313), showing a minor bearish tilt for USD in the short term.
GBP Futures: Large specs significantly reduced longs (-22,164) while also trimming shorts (-889), with commercials adding substantial long exposure (+20,125). This shift indicates reduced speculative confidence in GBP upside, while commercial buying suggests hedging or value positioning. Overall, COT data tilts toward a potential GBP correction rather than sustained breakout.
Seasonality:
GBP/USD historically underperforms in the second half of August across 5, 10, and 15-year averages. The 20-year tendency shows a mild decline starting mid-month into early September, aligning with the current resistance test and potential for downside momentum.
Sentiment:
Retail sentiment shows 66% short vs. 34% long. The majority of retail traders are positioned against the recent bullish push, which could fuel a brief squeeze higher before reversal. However, the confluence of COT, technical resistance, and seasonality keeps the medium-term bias bearish.
Conclusion & Bias:
Primary scenario: Short bias from 1.3530–1.3600 supply zone targeting 1.3250, then 1.3150 if momentum confirms.
Invalidation: Daily close above 1.3650 would weaken the short setup and open the path toward 1.3700–1.3750.

AUD/JPY at Decision Point – Bulls or Bears to Take Control?1. COT Analysis
JPY: Net shorts among Non-Commercials increased (+5.3K shorts, -1.8K longs), indicating growing bearish pressure on the yen. Commercials, however, heavily accumulated longs (+13.5K), suggesting that large players may be hedging or positioning for a potential yen rebound.
AUD: Still heavily net short, with Non-Commercials reducing longs (-2.5K) and slightly increasing shorts (+2.9K). This reflects a continued speculative bearish sentiment on the Australian dollar.
→ COT Implication: The divergence between a heavily shorted JPY and an AUD already under bearish pressure can lead to increased volatility. Without supportive macro drivers for the AUD, the pair may struggle to sustain upward moves.
2. Seasonality
JPY: Historically weak in August (20-year average: -0.61%), with sharper declines in the last 5 and 2 years. This tends to favor AUD/JPY upside in the first part of the month.
AUD: Slightly positive in the past 2 years (+0.01%), but negative over longer periods.
→ Short-term seasonality is moderately supportive of upside, but historical patterns don’t back a strong directional trend.
3. Sentiment
Retail positioning: 63% short vs 37% long. Historically, retail traders often find themselves on the wrong side of major moves, making this setup moderately bullish for AUD/JPY in the short term.
4. Technical Analysis
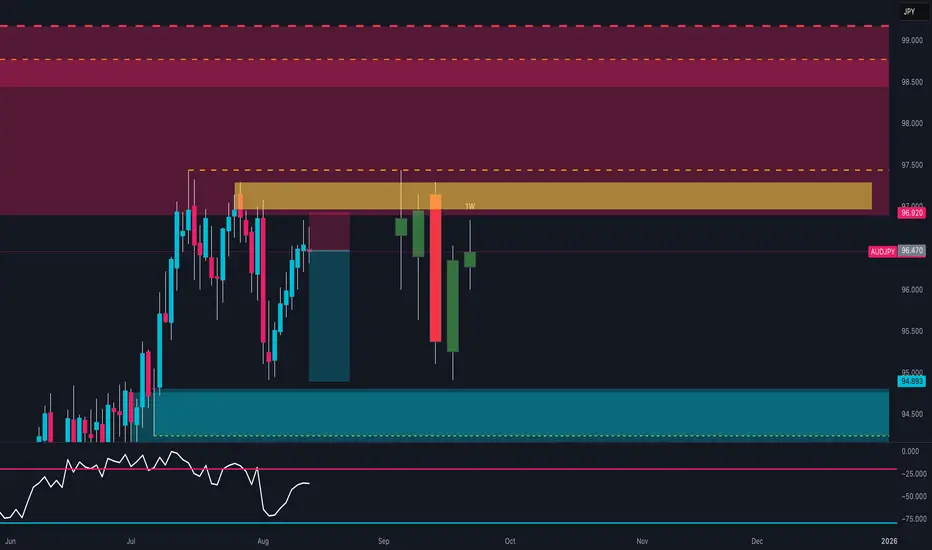
Weekly Supply Zone: 96.88–98.77. Price is currently below this area after a strong rejection in recent weeks.
Weekly Demand Zone: 94.90–95.00, previously tested with a bullish reaction.
RSI: Neutral zone, no overbought/oversold signals, but slightly tilted downward on the weekly timeframe.
Price Action: Current candle shows a recovery attempt after a bearish rejection, but unless the weekly closes above 96.92, the risk of another drop toward 95 remains high.
5. Trading Bias
Bullish Scenario: Weekly break & close above 96.92 with volume → Target 97.80 / 98.50.
Bearish Scenario: Weekly rejection below 96.90 and daily break of 95.80 → Target 95.00 / 94.50.
Macro Context: In risk-on environments, AUD tends to outperform JPY; in risk-off, the yen rebounds quickly.
📌 Summary:
Short-term neutral-to-bullish bias driven by contrarian retail sentiment and moderately bullish seasonality, but 96.92 remains a critical resistance that must be broken to unlock more upside. Failure here could send the pair back to 95.00, with risk of breakdown if macro sentiment worsens.
Short Idea On LUMBER (LBR1!)Based on :
- Cot Data
- Supply Zone
- Inverted Hammer Candle Confirmation

Buy USDCADUSD CAD is in bullish based on breakout of range.
Cot summary also suggets a bullish dollar as commercial, smart money, holds most position.
Alligator is waking to feed his hunger (trend).

GBP/JPY Trap? Smart Money Might Be Setting Up the Next Drop📊 1. Technical Overview
Price broke the bullish structure decisively, closing below a key demand zone between 195.00–196.00, leaving a large unfilled imbalance.
Last week's recovery candle suggests a potential pullback toward 197.40–197.80, now acting as a resistance confluence.
The descending channel and weak RSI further support a continuation of the bearish trend.
Bearish targets: 193.50 and 192.20
📈 2. COT (Commitment of Traders) Report
GBP:
Non-commercials are cutting long positions (–5,961) and adding shorts (+6,637) → Bearish divergence developing on GBP.
JPY:
Non-commercials are heavily increasing short exposure (+15,113), but remain strongly net-long overall, indicating a potential exhaustion of bullish JPY positioning.
💭 3. Retail Sentiment
Positioning is neutral: 51% long / 49% short.
This balance suggests no excessive retail bias, leaving room for directional moves without immediate contrarian pressure.
📆 4. Seasonality
August is historically bearish for GBP/JPY:
• –2.82% (20Y average)
• –3.04% (15Y average)
• –1.44% (5Y average)
The data shows a consistent historical bias to the downside during this month.
🎯 5. Strategic Outlook
• Primary Bias: Bearish below 197.40–197.80
• Invalidation: Weekly close above 198.10
• Targets: 195.00 > 193.50 > 192.20
The confluence of technical rejection, bearish COT dynamics, neutral sentiment, and negative seasonality supports a corrective scenario for August.

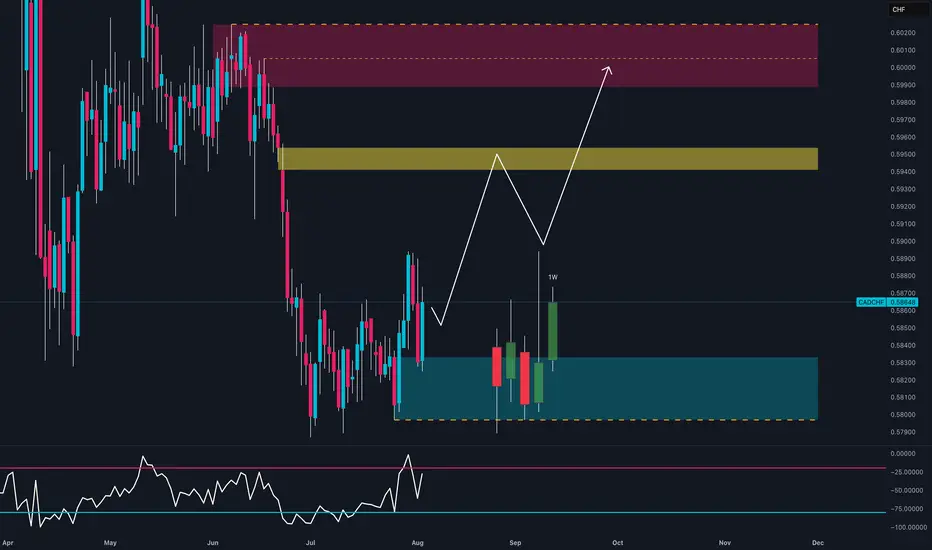
Everyone’s Short on CAD… But This Is Why I’m Going Long📊 CAD/CHF – August 4th, 2025 | Tactical Long Bias
🔹 Technical Outlook
The daily chart shows:
Strong bullish reaction within a weekly demand zone (0.5800–0.5830), confirmed by multiple lower wicks → growing buying pressure.
Weekly RSI bouncing out of oversold → potential mid-term reversal signal.
Structure may be shifting with a first target at 0.5950 (intermediate zone) and second target at 0.6000–0.6030 (major supply).
Recent bullish engulfing broke out of inside candle sequence → active technical trigger.
🧠 Commitment of Traders (COT) – July 29
Non-Commercials:
CAD: Aggressive increase in shorts (+3,888) and reduction in longs (-2,222) → heavily bearish speculative positioning.
CHF: Increase in longs (+936) and decrease in shorts (-1,095) → net bullish sentiment on CHF.
📌 However, CAD’s overstretched short positioning may lead to technical short-covering, especially if CHF starts to lose momentum.
📈 Seasonality – August
CHF: Range-bound or weak in August across all timeframes (20y, 15y, 10y).
CAD: Mild seasonal strength in August, especially on the 2y and 5y outlook.
➡️ Seasonal bias supports a tactical long on CAD/CHF during the first half of August.
✅ Trading Outlook
📌 Tactical Bias: LONG
🎯 First Target: 0.5950 → mid-level reaction zone.
🛑 Invalidation: below 0.5800 (demand breakdown).
🧠 Confluences: demand zone + RSI reversal + extreme COT positioning + seasonal support.
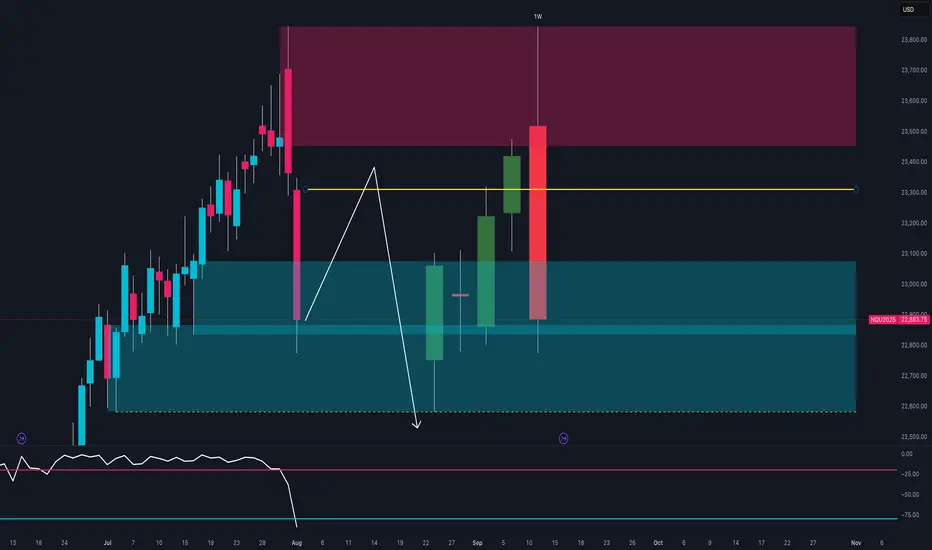
NASDAQ at Key Turning Point 🔍Technical Context
After testing the 23,600–23,800 supply zone, price printed a strong bearish rejection with a weekly engulfing candle.
The RSI broke decisively below the midline, signaling a clear loss of momentum.
Price is now trading back within the weekly demand zone between 22,800 and 22,950.
If a pullback toward 23,200 occurs, it could offer a fresh short opportunity, with downside targets around 22,600.
🪙 COT Report – July 29
Non-Commercials (speculators):
Long: +8,581
Short: +4,355
Commercials (hedging):
Long: +4,955
Short: +8,556
The market remains net long, but commercials are increasingly hedging with shorts.
The current imbalance — 88.6% long vs 11.3% short — suggests excessive bullish positioning, raising the risk of a correction.
🗓️ Seasonality – August
August is historically strong for the NASDAQ:
+222 pts (10Y)
+400 pts (5Y)
+912 pts (2Y)
While the trend is clearly bullish seasonally, caution is warranted:
Tops are often formed during the first half of August, followed by more pronounced corrections in September.
📉 Operational Summary
Primary scenario:
Wait for a retest of the 23,200–23,250 area
Look for rejection signals → enter short
Target 1: 22,800
Target 2: 22,600
Alternatively:
If 22,800 breaks on a strong weekly close, deeper downside scenarios may unfold.
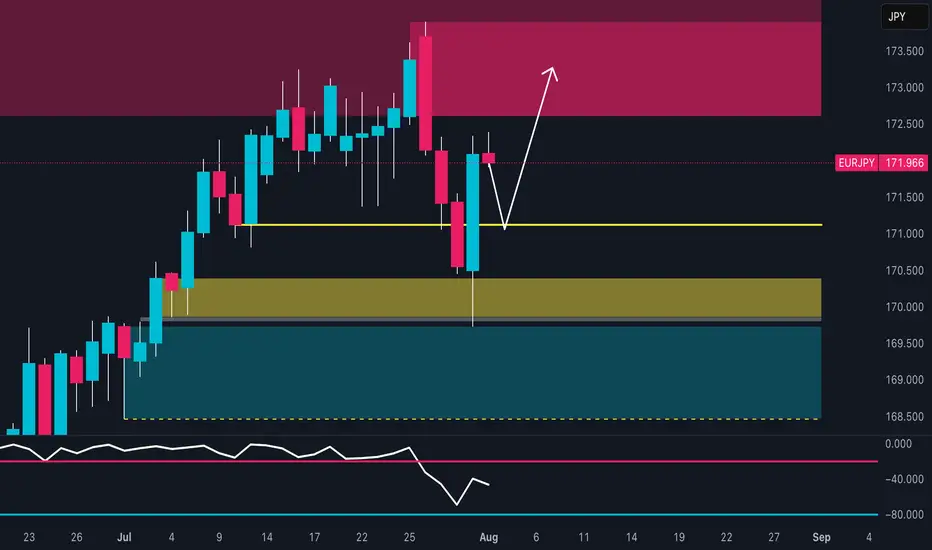
EUR/JPY Setup: Retail is 82% Short – Squeeze First, Drop After?🔹 Technical Context
Price reacted with a strong bullish wick in the 169.50–170.30 demand zone, signaling clear buyer defense. The RSI bounced from weakness but remains subdued, showing limited momentum.
📍 Current price action suggests a potential retest of the 172.50–173.30 area, which aligns with a supply zone, before a possible directional decision is made.
🗓️ Seasonality
Historically, August tends to be bearish for EUR/JPY:
5Y average: -0.48%
10Y average: -0.12%
15Y/20Y averages: -1.3% and -1.2%
📉 Seasonality indicates potential weakness, especially in the second half of the month.
🪙 COT Report (EURO & YEN) – July 22
EURO: Strong long accumulation by non-commercials (+6,284) and commercials (+17,575)
JPY: Net decline in both longs (-1,033) and shorts (-4,096), with a drop in total open interest
🧠 The market is heavily positioned on the Euro, while Yen positioning is fading. This creates a divergence between the two currencies, favoring a short-term technical bounce on EUR/JPY, though downside risks remain in the mid-term.
📉 Sentiment
82% of retail traders are short EUR/JPY
Volume: 1,564 lots short vs 352 lots long
📣 This extreme sentiment imbalance suggests a potential short-term squeeze against retail traders.
📊 Market Mood & DPO
Overall mood: Neutral
DPO at -9.0, Wyckoff score below 50
Momentum remains weak, but not showing a clear divergence.
🧩 Operational Summary
Retest of the 172.50–173.30 supply zone
Likely exhaustion in that area
Ideal setup: rejection + bearish confirmation
→ Targets: 170.30, then 169.00
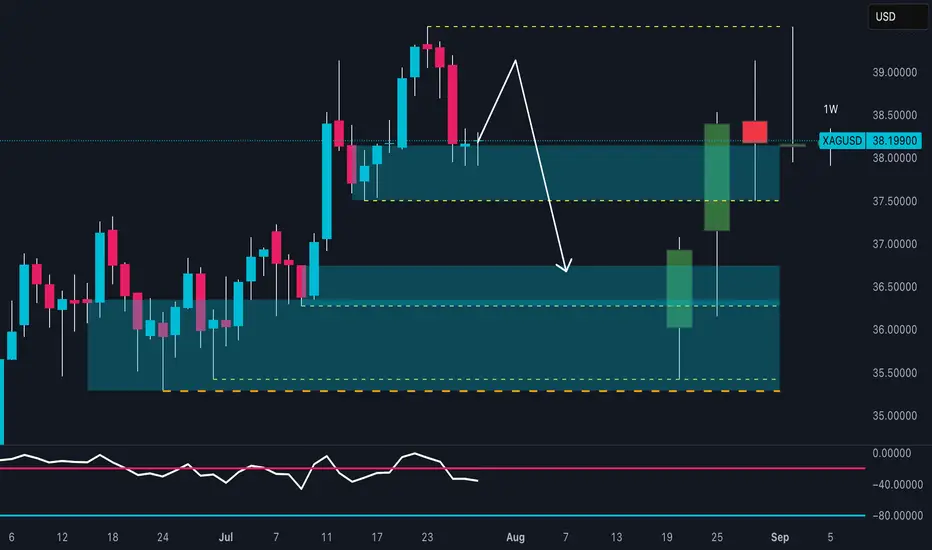
SILVER Is About to Collapse? Watch This Critical Supply Zone!Price recently tapped a high near 39.20 before sharply rejecting from the 38.80–39.20 supply zone, confirming strong selling pressure. The current structure shows:
- Supply zone tested and rejected
- Likely return to the previous demand zone (36.50–36.00)
- RSI is turning down, confirming loss of momentum
A pullback toward 38.30–38.50, followed by a bearish continuation toward the 36.50 area, which acts as a key structural and institutional support.
🗓️ Seasonality
Historically, July is bullish for silver:
Last 5Y average: +0.89%
Last 2Y average: +2.18%
However, August–September are bearish months:
August: mildly positive, but weak
September: consistently negative across all time frames (-0.86% to -1.10%)
This increases the probability of a downward move starting in early August, in line with current price action rejection.
🪙 Commitment of Traders (COT) – July 22
Non-Commercials (speculators):
Longs: +656
Shorts: -516
Commercials (hedging):
Longs: +1,337
Shorts: +916
➡️ Commercials are increasing both long and short exposure, while non-commercials remain net long — a sign of moderate optimism.
However, long positioning is slowing down compared to previous weeks. A potential exhaustion in bullish momentum is forming.
📉 Sentiment
52% short vs 48% long
Volume: more lots on the short side (492 vs 454)
Sentiment remains neutral to slightly contrarian bullish, but not extreme. This may allow for a fake breakout before a deeper move down.
🧩 Operational Summary
Main bias: Bearish short to mid-term (starting August), supported by:
- Technical rejection at supply
- Negative seasonal tendencies ahead
- RSI showing momentum loss
- COT showing stabilization, not accumulation
EUR/USD at a Turning Point:Rally or Trap for the Bulls?📉 Technical Analysis
Price has decisively broken out of the descending channel highlighted in recent weeks. The weekly support zone between 1.1540 – 1.1580 is holding, triggering a significant technical reaction. The weekly RSI has entered oversold territory, suggesting a potential short-term reversal.
Key Support: 1.1530–1.1580 (currently reacting)
Key Resistance: 1.1720–1.1780 (inefficiency & supply zone)
Base Case: Potential rebound toward 1.1720–1.1750 before next structural decision
🧠 Sentiment Analysis
82% of retail traders are long, with an average entry at 1.1635
Only 18% are short, a clear minority
This extreme imbalance suggests downside pressure may persist to flush out weak long hands before a genuine reversal takes place.
📊 COT (Commitment of Traders)
USD Index:
Non-Commercials increased both long (+663) and short (+449) positions → uncertain stance but slight USD strengthening
EUR Futures:
Non-Commercials increased long (+6,284) and short (+8,990) positions, but net increase favors the bears
This shift signals a bearish turn in sentiment among large speculators, indicating short-term downward pressure.
📈 Seasonality
In July, EUR/USD historically tends to rise, but:
This year’s price action is underperforming the seasonal pattern, showing relative weakness
August is historically flat to slightly bearish
Seasonality does not currently support a strong bullish continuation
✅ Strategic Conclusion
Current Bias: Bearish-neutral (with short-term bullish bounce expected)
A technical rebound toward 1.1720–1.1750 is likely (liquidity void + RSI bounce + retail imbalance)
However, 1.1720–1.1750 is a key supply zone to monitor for fresh shorts, in line with:
Dollar-supportive COT data
Overcrowded long retail positioning
Weak seasonal context
🧭 Operational Plan:
Avoid holding longs above 1.1750 without macro confirmation
Monitor price action between 1.1720–1.1750 for potential short re-entry
Clean breakout above 1.1780 → shift bias to neutral/bullish
GBPNZD Breakdown – Smart Money Turns Fully Bearish🧠 Macro + COT + Sentiment Context
Commitment of Traders (COT) – Asset Managers
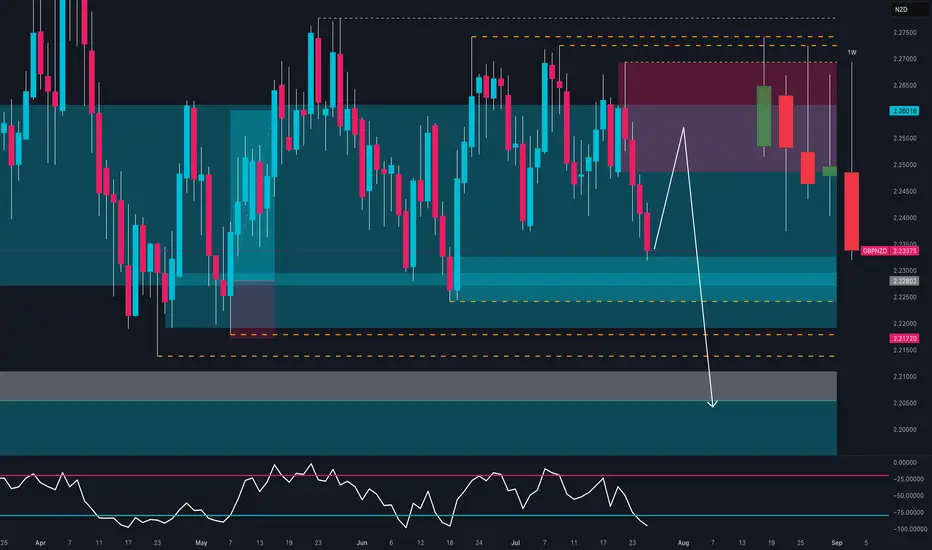
Institutional asset managers are significantly net short on GBPNZD, with positioning at its lowest level of the year and declining sharply since May. This reflects a clear bearish stance from smart money and reinforces the current downward pressure.
Sentiment & Momentum Indicators
DPO: -54.9 → Indicates a moderately bearish momentum phase.
Wyckoff: -20.3 → Price is in a distribution phase, suggesting weakness.
Speed: 3.2 → Low acceleration, but directional bias remains bearish.
Market Mood: Neutral, but leaning into oversold territory.
Seasonality (July 1st – Sept 30th)
Historically, GBPNZD performs positively in this period:
3Y: +1.7%, 5Y: +1.6%, 10Y: +2.3%, 15Y: +2.8%
However, in 2025, price is diverging sharply from seasonal norms. The pair is trading against historical patterns, suggesting a seasonal anomaly where institutional flow is dominating historical behavior.
🧱 Technical Outlook (Daily Chart)
GBPNZD had been consolidating in a clear range between 2.2170 support and 2.2750 resistance since May. The pair has now broken down with a strong, full-bodied weekly candle, closing below the 2.2320 demand zone.
Key Technical Zones:
Supply zone (2.2494–2.2659) → A clear rejection zone that initiated the current selloff.
Demand zone (2.2170–2.2300) → Has been tested twice already, increasing the probability of a clean breakdown.
RSI (Daily) → Currently neutral, with a sequence of lower highs and no bullish divergence in sight — indicating weak momentum.
✅ Conclusion & Trade Plan
Directional Bias: Bearish (Short)
Although seasonality typically supports bullish price action for GBPNZD in Q3, the current context is decisively bearish. Institutional positioning, price structure, and sentiment all confirm a potential shift in direction, reinforced by a confirmed weekly breakdown.
Bearish Targets:
📍 First: 2.2170 (recent support test)
📍 Second: 2.2000–2.1900 (April swing low)
📍 Extension: 2.1750 (base of previous accumulation zone)
Invalidation Criteria:
A weekly close above 2.2490 (supply zone breached)
Bullish RSI divergence + weekly recovery candle
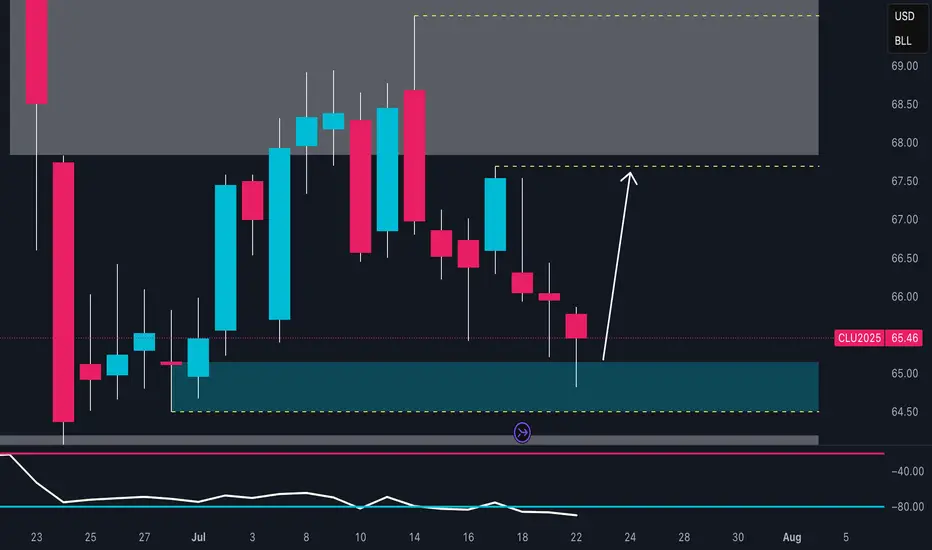
Crude Oil Rebound Incoming? Key Demand Zone 📈 1. Technical Analysis – Daily Chart (CL1!)
The price has returned to a demand zone between 64.60 and 65.30, an area that previously triggered strong bullish reactions.
The July 22nd candle shows a clear lower wick, indicating potential buyer absorption and a possible short-term reversal.
The next key resistance lies between 67.80 and 68.80, which aligns with a well-defined supply zone.
Daily RSI remains weak but shows signs of bullish divergence, suggesting potential accumulation.
Bias: bullish from current levels, targeting 67.50 – 68.00. Invalidation on a daily close below 64.40.
2. Institutional Sentiment – COT Report (CFTC, July 15, 2025)
Non-Commercials (Speculators)
Long: 308,915 (↓ -24,223)
Short: 146,488 (↑ +22,724)
Net Position: sharply declining → bearish divergence in speculative sentiment
Commercials (Hedgers)
Long: 857,803 (↑ +66,342)
Short: 1,046,199 (↑ +18,118)
Net Position: still negative, but improving → reduced hedging = less downside pressure
📉 Interpretation:
Funds are closing longs and adding shorts, showing bearish positioning. However, commercials are slowly reducing their hedging exposure, which could indicate short-term stabilization if the technical support holds.
3. Seasonality
Periods analyzed: 20, 15, 10, 5, and 2 years
July historically shows negative average returns:
-0.71% (20Y)
-1.26% (15Y)
-1.37% (10Y)
The seasonal pattern indicates continued cyclical weakness into August.
📌 Interpretation:
The summer period typically brings seasonal bearish pressure, which aligns with current 2025 performance.
🌐 4. Macro & Fundamentals
EIA inventory builds for 3 consecutive weeks → demand weakness in the U.S.
No additional OPEC+ cuts announced → supply remains ample
Stable inflation data in the U.S. and China → no uptick in energy demand
Overall macro data is neutral with a slightly bearish short-term bias
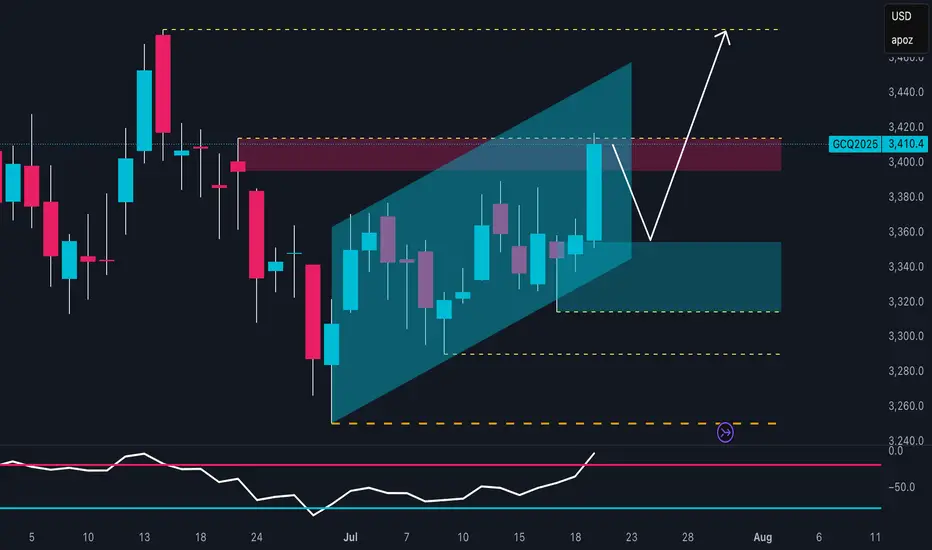
Gold Bulls Reloading? Smart Money Buys!The technical outlook on XAU/USD shows a well-defined bullish trend, developing within an ascending channel that started in late June. Price recently pushed toward the upper boundary of this channel, reaching a key resistance zone between 3,410 and 3,420 USD, which aligns with a previous supply area and significant daily structure. The reaction in this zone suggests a potential fake breakout, hinting at a short-term pullback before a continuation of the upward move.
The RSI oscillator supports this view, displaying bullish momentum with a breakout above the 60 level. However, the current slope hints at a possible minor correction before the next impulsive leg higher. The most relevant demand zone lies between 3,340 and 3,360 USD, at the base of the ascending channel—an ideal spot for buy orders to accumulate in anticipation of a move toward previous highs.
Backing this technical setup, the Commitment of Traders (COT) report as of July 15, 2025, paints a constructive picture. Non-commercial traders (institutional speculators) increased their long positions by over 8,500 contracts, while also cutting short positions by about 1,600 contracts, indicating a strong bullish bias. Commercials also increased their shorts (+16,448), a typical hedge during rallies, but not enough to invalidate the bullish structure.
From a seasonal perspective, July remains one of the historically strongest months for gold. According to MarketBulls data, over the past 2 years, gold has averaged gains of 105+ points in July, with solid returns also visible on the 5-year (+45 pts) and 10-year (+25 pts) averages. August also tends to be supportive, reinforcing the idea of a medium-term bullish extension.
Lastly, the retail sentiment is heavily skewed, with 72% of retail traders short, and only 28% long. From a contrarian standpoint, this is another strong bullish signal. When the majority of retail traders are short in a structurally bullish market, the potential for a short squeeze remains high.
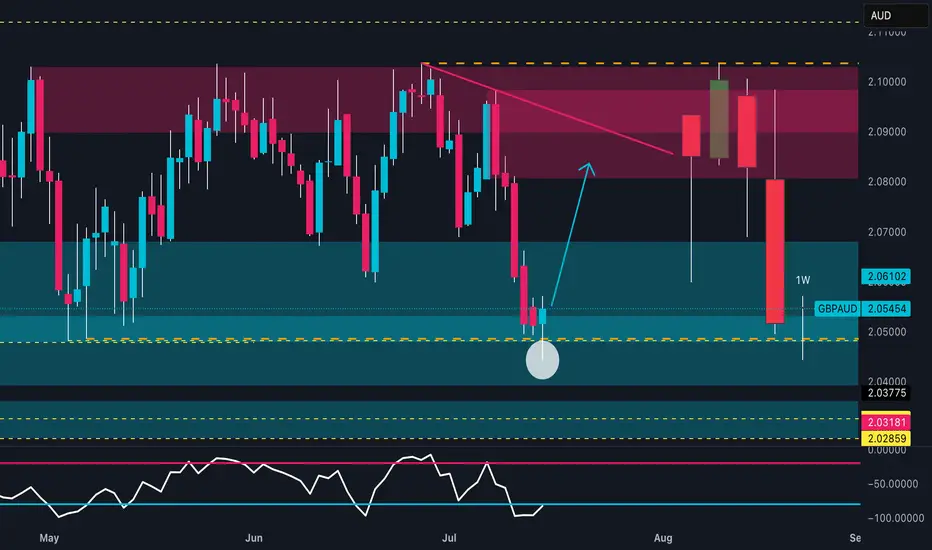
GBPAUD: Weekly Reversal | COT & Seasonality Support Bullish📊 Technical Outlook
Price strongly reacted from a key weekly demand zone between 2.0400 and 2.0500, showing clear absorption of bearish pressure. The RSI is rebounding from the 30 area, signaling early reversal potential.
The next technical target lies between 2.08900 and 2.10000, within a well-defined supply zone.
An early bullish reversal is in progress, with potential for a swing move toward the red zone.
🧠 Commitment of Traders (COT Report – 08/07/2025)
GBP: Non-commercial traders are net long, with positioning growing across the board: +869 longs / -926 shorts. Commercials reduce shorts and increase longs → Bullish bias.
AUD: Non-commercials are clearly short (-2,267 longs / +1,957 shorts). Commercials are increasing long exposure (+2,629), but still in the minority → Bearish bias.
➡️ The COT spread confirms a GBP long vs AUD short bias.
📅 Seasonality (July)
GBP: Historically strong in July, with average monthly gains across all timeframes (especially the 2Y window).
AUD: Less favorable seasonal profile in July; flat to slightly negative across all time horizons.
➡️ Seasonality supports GBP strength.
📉 Retail Sentiment
58% Long / 42% Short on GBPAUD
➡️ Retail traders are still heavily long → a shakeout of weak long hands is possible before the real rally begins.
🎯 Strategic Conclusion
GBP shows bullish convergence across technical, COT, and seasonal factors. AUD presents clear weakness.
The current price zone offers a clean entry point for longs, targeting the 2.08900–2.10000 supply zone.
EURJPY Hits Major Weekly Supply | Is the Bull Run Over?EUR/JPY – Institutional Macro Context (COT)
EUR (Euro)
Non-commercials net longs increased by +16,146 → strong buying.
Commercials added +25,799 long positions.
✅ Bias: Moderately bullish.
JPY (Japanese Yen)
Non-commercials decreased longs by -4,432.
Commercials cut -20,405 long contracts.
❌ Bias: Bearish pressure remains on JPY.
Conclusion (COT): EUR remains fundamentally strong, JPY structurally weak. Institutional flows favor long EUR/JPY, but positioning is stretched.
Seasonality (July)
EURJPY shows strong bullish seasonality in July, especially over the 2Y and 5Y averages (+1.03% and +0.66% respectively).
✅ Seasonality bias: Bullish.
Retail Sentiment
89% of traders are short on EUR/JPY.
Contrarian bias = bullish confirmation.
Technical Analysis (Weekly View)
Price is pushing into a major weekly supply zone around 172.50–173.00.
RSI still elevated but showing signs of weakening momentum.
Potential double top structure forming in confluence with liquidity grab.
First downside target sits around 169.50 (daily demand zone).
Awaiting a reaction in supply and confirmation for short.
Trading Plan (Top-Down)
Wait for price to reject the 172.50–173.00 area
Watch for bearish confirmation on Daily (engulfing or lower high)
Target: 169.50 zone
Risk: tight above 173.20 (invalidating supply zone)
