Ventas, Inc. (VTR) – Short Setup Technical AnalysisVentas, Inc. (VTR) – Short Setup Technical Analysis
VTR is currently trading above the Anchored VWAP, with price positioned between the 2nd and 3rd VWAP deviation bands, signaling a clear overextension away from fair value. At these levels, upside continuation typically becomes increasingly inefficient.
This extension aligns with the formation of a bearish Crab harmonic pattern, which often develops near terminal phases of an advance. The Crab completion zone defines a technically significant area where buying pressure tends to fade and risk shifts decisively toward a reversal or mean-reversion move.
From a tactical standpoint, the setup favors a mean-reversion driven short position. A rejection within the deviation 2–3 VWAP zone would confirm distribution and increase the probability of a rotation back toward the Anchored VWAP and prior value area.
Bias: Short on rejection between VWAP deviation 2 and 3
Target: Mean reversion toward Anchored VWAP
Invalidation: Sustained acceptance above the 3rd VWAP deviation band
Context: Bearish Crab completion + VWAP deviation extension = asymmetric short opportunity
Crab

Elloit wave ETH 1/5/2026Initially, I thought that the wave count from wave(i) to wave(ii) might be wave C, completing the correction in the scinario that wave 4 is not end yet. However, upon reconsideration, the recent downward pressure can also be counted as an impulsive wave i, and it appears too steep to be a corrective move.
Another supporting factor is that the price action following this downward move is clearly corrective, forming a very complex wave structure. The Deep Crab harmonic pattern suggests a reversal zone around 3,180–3,190, which aligns closely with the recent reversal point. This wave count also indicates that wave 4 is nearing completion.
The projected target for wave (v) is around 2,400, supported by butterfly harmonic projections and coinciding with a strong support zone.
The invalidation level for this scenario is a break above 3,330 since wave (ii) should not break above 0.8 retace ment of wae (i).In that case ,ETH wave 4 will not finish yet but the reversal should be soon reaveled

KRAB - A joke that became a good investmentIm pushing the joke and found something that looks like a rly good investment.
Perfect text book example of accumulation after a downward move (down move not shown on the chart) and a reaccumulation at 0.5 at 11
additional evidences are the pick volume on early 2024 and re accumulation at 11 shown by blue arrows
we are targeting 17 for the next wave up, on 2026 and maybe further up to 21 then
cheers not financial advice

Stock - C.H. Robinson Worldwide - Short SetupC.H. Robinson Worldwide (CHRW) – Short Setup Technical Analysis
CHRW is currently trading extended above the 3rd Anchored VWAP band, signaling a clear price–value dislocation and elevated risk of mean reversion. The recent advance appears increasingly inefficient, with price moving too far away from its volume-weighted equilibrium.
This extension coincides with the formation of a Deep Crab harmonic pattern, marking a classic terminal structure within the prevailing move. Such patterns frequently appear near exhaustion points, where upside momentum deteriorates and late buyers become vulnerable.
From a tactical standpoint, this environment favors a mean reversion short setup rather than trend continuation. A rejection from the upper VWAP band, or loss of intraday structure, would confirm distribution and increase the probability of a rotation back toward the Anchored VWAP and prior value area.
Bias: Short on rejection above the 3rd Anchored VWAP band
Target: Mean reversion toward Anchored VWAP
Invalidation: Sustained acceptance above the upper VWAP band
Context: Deep Crab completion + VWAP band extension = high-quality short opportunity

BULLISH CRAB PATTERN ON NFEI’ve charted this ticker before and the setup didn’t play out, but this time the structure looks a lot more convincing. We’re at a point where the stock is likely gearing up for a major move — either a full breakdown or a sharp upside reversal. From a risk-management standpoint, a small allocation (e.g., ~1% of a diversified portfolio) could make sense for those who understand the volatility, but that’s strictly a general observation, not advice.
The good news: price action looks like it’s forming a potential bottom. On the log chart, I’m seeing a possible crab harmonic completion lining up with the end of a Wave C, backed by weekly MACD divergence. I’ve outlined the levels I’m watching — entry zone, stop-loss region, and upside targets — strictly as charting reference points.
Not financial advice — just sharing the setup as I see it on the charts.

BTC and USDT.D - Marco Harmonic PatternsHere you can see a marco harmonic pattern forming where the Gartley could print on a large macro, and smaller Deep Crab to get us there. BTC will pump while USDT.D goes down, but that will be the final move for a, potentially, cycle top. Let see...

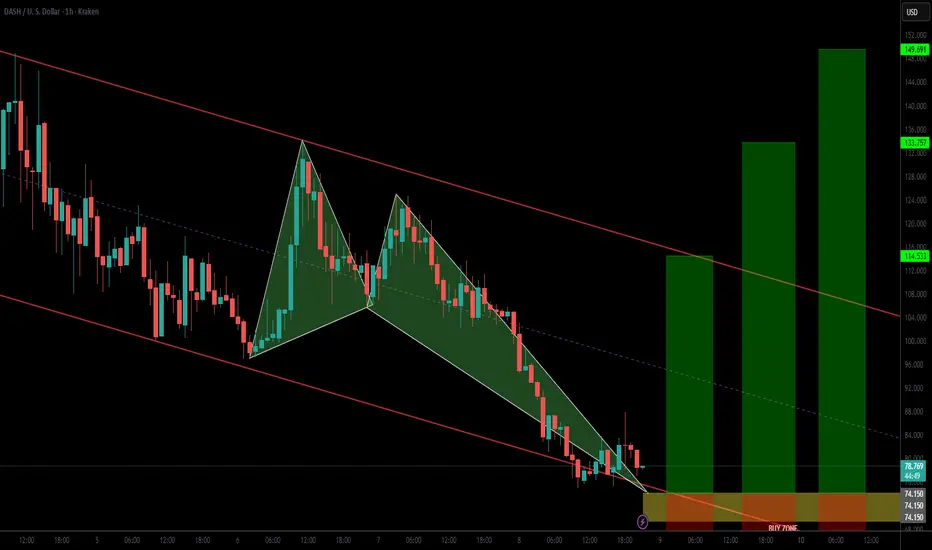
BULLISH CRAB PATTERN COMPLETING ON DASHA Bullish Crab pattern is nearing completion on the DASH/USD chart, suggesting a potential reversal zone as price action approaches the final leg (point D). The harmonic structure aligns with key Fibonacci ratios across the XA, AB, BC, and CD legs, reinforcing the validity of the setup.
Additionally, a potential Wave 2 correction appears to be completing within the .618–.786 Fibonacci golden pocket, adding strong confluence between harmonic and Elliott Wave structures. This overlap highlights a high-probability reversal region that could trigger a significant bullish reaction.
I’ve outlined potential entry levels and profit targets based on this confluence zone for educational and analytical purposes. Traders should watch for bullish confirmation signals such as candlestick reversals, volume increase, or bullish RSI divergence before considering entries.
⚠️ Disclaimer: I am not a financial advisor. This analysis is for educational purposes only and should not be taken as financial advice. Always conduct your own research and manage risk appropriately.
META - At SupportWell, theoretically META is just getting to the support cluster and competing a Crab Pattern. It may be respected and push the price higher, but if... If the markets forget of the poor results and of the fear that AI Rally is actually no more than another bubble... The best way to wait a bit and just see
Just my humble opinion

GBPUSD Harmonic Analysis – Bullish OutlookOn the 1H timeframe, GBPUSD has completed a Deep Crab harmonic pattern, reaching the extended 2.000 Fibonacci leg – a strong reversal zone within the pattern structure.
Price has reacted at the potential XA completion point, showing early signs of accumulation around 1.3297 support.
With both T1 (1.3377) and T2 (1.3432) lining up as harmonic targets, bullish momentum could develop as the market transitions from the markdown to the markup phase.
If buyers maintain structure above the recent low, a recovery towards these targets remains in play.
Bias: Bullish
Targets:
T1: 1.3377
T2: 1.3432
Invalidation: A clean break below 1.3270 would invalidate the pattern and shift bias back to bearish.

BRENT CRUDEWith only a little work to push through the Outlook is bullish. The price points are from the major low in yellow 💛 mathematically spaced. You can trade level to level.

ETHUSD ShortETHUSD is anticipated to drop from $5k, heading toward its target (TP 1&2), backed by the confirmation of a Crab pattern formation.

Gold at PRZ – Crab Pattern in PlayGold ( OANDA:XAUUSD ) started to rise as I mentioned in my previous idea and created a new All-Time High(ATH) again .
How long do you think the trend toward forming a new ATH will continue?
Gold is currently trading near the Potential Reversal Zone(PRZ) and Resistance lines .
In theory, Elliott waves , PRZ , and Resistance lines could be the start of a correction, even a deep one( End of the main wave 5 ) .
There is also a Bearish Crab Harmonic Pattern seen in the Gold chart that could lead to a decline in Gold .
I expect Gold to start correcting again.
First Target: $3,819
Second Target: $3,807
Third Target: $3,793
Stop Loss(SL): $3,854
Please respect each other's ideas and express them politely if you agree or disagree.
Gold Analyze (XAUUSD), 1-hour time frame.
Be sure to follow the updated ideas.
Do not forget to put a Stop loss for your positions (For every position you want to open).
Please follow your strategy; this is just my idea, and I will gladly see your ideas in this post.
Please do not forget the ✅ ' like ' ✅ button 🙏😊 & Share it with your friends; thanks, and Trade safe.

RTY ShortRTY is likely to face a potential decline from the 2430 level at point D of the crab pattern, with TP1 through TP3 serving as probable target objectives.

LINK ShortLINKUSD is projected to experience a decline from its current level of $29, moving steadily toward its anticipated target. This movement is supported by the validation of a Crab pattern formation, which signals a potential reversal and aligns with technical analysis trends.

BTC Elliott wave analysis 9/16 /2025Is Bitcoin’s Cycle Ending, or Just Another Correction?
BTC made a new all-time high last month, followed by significant selling pressure. This raises the question: Has the BTC cycle ended, or is this just another corrective wave before another push higher?
In my view, BTC has already completed its cycle since the bear market ended in November 2022, based on the following factors:
1. Wave Structure Suggests Completion of Wave 5
From my primary scenario, the 5-wave cycle beginning after the November 2022 bear market is as follows:
Cycle Wave I: Nov 21, 2022 – Apr 14, 2023
Cycle Wave II: Apr 14, 2023 – Sep 11, 2023
Cycle Wave III: Sep 11, 2023 – Jan 20, 2025
Cycle Wave IV: Jan 20, 2025 – Apr 9, 2025
Cycle Wave V: Apr 9, 2025 – Aug 14, 2025
Within Cycle Wave V, we can clearly see wave 1 and wave 3 of the initial impulse, followed by a correction (wave 4), and then a final 5-wave sequence. This last push shows signs of exhaustion: although wave ④ (part of wave 5) lasted nearly a month, the market struggled to achieve new highs. This behavior suggests that buying pressure is exhausted and Cycle Wave V may have ended.
2. Post-High Wave Structure
The decline after BTC’s all-time high could be interpreted as the start of a new impulse down, or as part of a complex corrective structure such as WXY or WXYXZ.
We need further confirmation, but one thing is clear: after the upward correction completes, another downward wave should follow, either to complete the correction or as wave 3 of a larger bearish impulse.
Micro Analysis
Based on my Elliott Wave count, it seems BTC has completed wave II or wave b.
This is confirmed not only by Gann fan resistance, but also by the divergence on the abrupt wave 5 in the 4-hour chart, which was followed by a strong downward move. This implies BTC has already entered wave III, or has at least completed its correction.
If this current impulse is indeed wave 3 of a larger downtrend, the target for wave V would be around $81,000, supported by a Crab harmonic pattern projection.

GOLDSIL LongThe likelihood of the GoldSilver bat breaking out of the wedge formed by the drawn trendlines suggests a potential increase in the index in the future.

DXY Long/Short The movement of the dollar index may be influenced by the dynamic interactions between buyers and sellers, as assessed using the harmonic crab algorithm.

Gold Hits New ATH – Is a Bearish Crab Reversal Next?Gold ( OANDA:XAUUSD ) started to rise today after the release of the
ISM Manufacturing PMI index formed a new All-Time High(ATH) .
The question is what price range could the new ATH price range for gold be in?
Gold is currently moving near the Potential Reversal Zone(PRZ)($3,557-$3,531) .
From a pattern analysis perspective , it looks like Gold is completing a Bearish Crab Harmonic Pattern . In fact, if we find a trigger at point D of the Bearish Crab Harmonic Pattern , we can confirm this pattern.
From an Elliott wave theory perspective , it looks like Gold is completing wave 5 . This wave 5 could act as the end of the main wave 3 .
I expect Gold to drop to at least $3,501 in the coming hours .
Second Target: $3,481
Third Target: Support zone($3,474-$3,466)
Stop Loss (SL) = $3,559(Worst)
Gold Analyze (XAUUSD), 15-minute time frame.
Be sure to follow the updated ideas.
Do not forget to put a Stop loss for your positions (For every position you want to open).
Please follow your strategy; this is just my idea, and I will gladly see your ideas in this post.
Please do not forget the ✅ ' like ' ✅ button 🙏😊 & Share it with your friends; thanks, and Trade safe.

GBPCAD ShortGBPCAD is expected to decline from 1.86, aiming for TP 1 and TP 2, as the confirmed Crab harmonic pattern suggests strong bearish momentum.

GOLD ShortA decrease in gold prices is anticipated, considering the ideal Crab pattern on the four-hour timeframe.
This pattern, considered one of the reliable harmonic patterns in technical analysis, may indicate a trend reversal and price correction.
but for final confirmation, other technical and fundamental factors need to be examined as well.

BTCUSD Long The probability of a Bitcoin price surge among buyers within the order block area, as indicated by the crab pattern.

BTCUSD LongThe BTC price is projected to surge beyond 106.5k, driven by the validation of the Crab harmonic pattern. This pattern serves as a strong indicator of bullish momentum, suggesting a promising upward trajectory for Bitcoin in the near term.

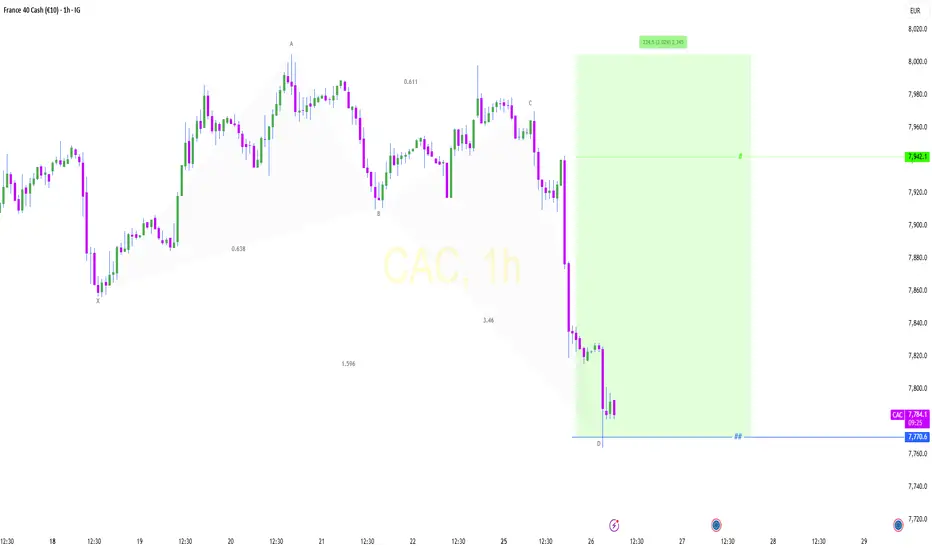
CAC LongThe FR40 index is anticipated to climb from 7.77k, supported by the confirmation of the Ideal Crab harmonic pattern, which signals strong bullish momentum.