buy btc ° we can see that the price respects a bearish pennant, if it breaks is entry.
° this trade is raised with two trading units because if go down to the 42k area we can average
Cripto

Bitcoin fallWell, as I see in the Bitcoin chart, our uptrend line is broken and is pullback. The dot marked in red indicates that it will be a strong reversal due to:
1. Fibonacci line collides with our trend line
2. The possibility of forming a return pattern in the specified area


#ORNUSDT Trading plan!Hi friend!
After a strong growth, the pair is trading at highs, every day
it is more and more pressed towards the historical resistance
level of 18.0. I plan to buy on the breakout of this level.
✔ Do not forget to trade using your own trading system and with stops!
✔ If you like what I do, put 👍 and subscribe! 🙌👀
✔ This is the best gratitude for my work! 💕

#DUSKUSDT Trading plan!Hi friends
After a strong growth, the pair is trading at highs,
every day it is more and more pressed towards the historical resistance level of 0.27.
I plan to buy on the breakout of this level.
✔ Do not forget to trade using your own trading system and with stops!
✔ If you like what I do, put 👍 and subscribe! 🙌👀
✔ This is the best gratitude for my work! 💕

#BLZUSDT Trading plan!Hi friens!
The pair has been accumulating strongly for a long time.
There is a pronounced resistance level, above which I plan to buy!
I will buy on the breakdown of the 0.24456 level!
✔ Do not forget to trade using your own trading system and with stops!
✔ If you like what I do, put 👍 and subscribe! 🙌👀
✔ This is the best gratitude for my work! 💕

REN TradeThe weekly candle here broke the all time high, so I decided to go long on this breakout. The price has probably broken a well-defined range, so a purely continuation pattern such as a rectangle could be used for a trade with a Risk / Reward greater than or equal to 1/3. Within long with stop at -30% and time target instead of price, I say within 2 months from today. Further updates coming soon.
If you liked this analysis and you want to help me improve and continue in my work, donate to this address:
0xD36Fa870d1daef582c1bCb9FeEdA06c9a4aECC8f

PolkaDot TradeI open a buy order on this continuation figure, the trend allows me to keep a fairly large stop loss at about -30% below $ 15; Excellent R / R over the medium term.
The MACD below slightly lags the possibility that the trend will continue to rise.
If you liked this analysis, help me to improve them more and more, donate here:
12U6rzz5JFXunUasYWxivgrQGMdZsbn3S2cr33FvcJytBcDo

#ANTUSDT Trading plan!Hi friends!
The pair has been saving up in the channel for a long time at the bottom.
After exiting the channel, the price met its resistance at the level of 6.7$.
I plan to buy at the breakout of this level.
Price upside potential 60%.
✔ Do not forget to trade using your own trading system and with stops!
✔ If you like what I do, put 👍 and subscribe! 🙌👀
✔ This is the best gratitude for my work! 💕

#JSTUSDT Trading plan!Hello friends!
After the rebound from the resistance level of 0.05555, the price approaches it again.
Buy above 0.05555$
Target 1 0.06360$
Target 2 0.07265$

Cardano (ADA) tradeThe weekly candle here has shown the strength of ADA is not decreasing, indeed it seems to really want to break this resistance that it has not seen for more than two years, here in my opinion there is the margin to make a trade in long with a stop at -30% around 22 cents, with r / r 1/3 and a minimum target of 60 cents, but I don't want to have a price target, but I put a time target which is 2 months from now. Weekly updates will follow.
If you liked this analysis and you want to help me improve and continue in my work, donate to this address:
DdzFFzCqrhshuqnNHrjckXCyc3QhTwtGFW5fgK7ijqFJWmJAgFiNKPH8Ao5bAdaDArc9F6dh3vduLQ3WrJEZPxTv41M55Nh4tA7S7QMP


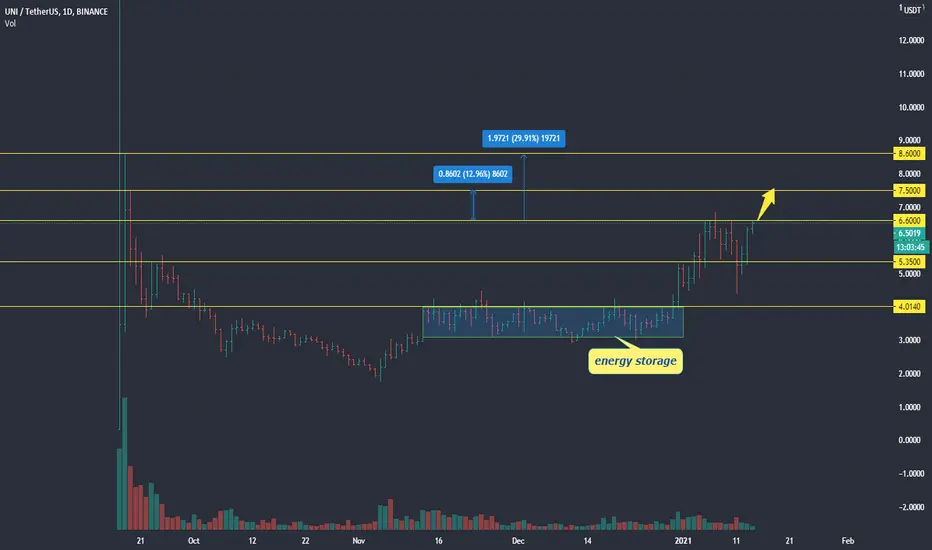
#UNIUSDT trading plan!Hi friend!
This coin flies up again!
After the breakdown of the resistance level 6.6$, I will buy.
Target 1 - 7.5$
Target 2 - 8.6$
✔ Do not forget to trade using your own trading system and with stops!
✔ If you like what I do, put 👍 and subscribe! 🙌👀
✔ This is the best gratitude for my work! 💕
DASHUSDT daily price analysis - Price projectionMy speculation as to the price of DASH for the next moments, based on the daily movement.
The price retracted after reaching an important resistance region, and it is in an upward trend (macro view), being able to reach higher price levels than was projected on the chart.
disclaimer
*** This is not a recommendation to purchase and/or sale. It is for educational purposes only ***

Daily analysis on YFIUSDT - Projected target - 2nd postMy speculation as to the price of Yearn Finance for the next moments, based on the daily movement.
The Yearn Finance price has broken through a region of major resistance.
The price is in a bullish channel. He broke through a region of important resistance, being able to search for the projected target, near the maximum top. After the maximum top is broken, the price may move towards the first point. In my view, crypto has the potential to pursue such a price.
disclaimer
*** This is not a recommendation to purchase and/or sale. It is for educational purposes only ***

#BZRXUSDT Trading plan!Hi friends!
After a strong fall, the coin has well accumulated energy and is ready to go up!
I plan to buy above the resistance level.
Target: 0.2542$

Weekend analysis: BitcoinWhat can I say?
In my 11 years of experience, I have never seen a similar price behavior, which leads me to think that we are experiencing a financial paradigm shift.
Some believe that the price, being so deviated from its average, can reverse at any time, and I agree. The question is: when?
In this scenario, timing is essential, and although my analyzes at the beginning of the week have been successful and with benefits (you can consult the previous setups in the ideas related to this one), the truth is that these last 3 days there have been very pronounced increases that started from a scenario in which the price was already far from its average, so we find ourselves in a situation in which the premise of selling in the overstretch is compromised.
My opinion is that there are times, more than people think, that the best option is simply to do nothing.
The strategy to follow is to wait for price drops and lower price rejection patterns to buy, as I always do.
However, I will keep a close eye on the price throughout the week and will adjust the analysis as events continue to unfold.

Why do you NEED a diaryMy philosophy is based on simplification.
I believe that reducing a problem to its fundamental parts helps us to better interact with them, and by being fundamental, our results are maximized.
It's like fixing a room. It is no use spreading our attention to details such as the type of lamps while neglecting the underlying problem, which can be a large coat of paint or an unforgivable hole in the ceiling. If habitability could be classified in points, at the same time invested, we will earn many more points by fixing the block earlier than by reflecting on the type of light in the bulbs.
Of course everything must be dealt with, but trading has a lot of variables, and most importantly, a lot of emotionality. Investing in the stock market notably activates the limbic part of our brain, and it robs the neocortex of prominence, making it more difficult to identify problems with this emotional blindness. Therefore I think that we must minimize the variables to the most important to maximize our attention in each one of them.
But to reduce trading to the fundamentals, the person must first be analyzed to identify the root of their problems.
Does the person have adequate knowledge? Perhaps he has good technique in theory but the execution is not good, or his problem lies in the situation of keeping an open operation, something very common, since our survival instinct makes us exit the market at the minimum profit opportunity, without having Keep in mind that this profit must cover the losses we have until the next profit occurs. The reverse is also very common, people who had carried out an analysis and the price has overflowed negatively, but are unable to close the operation because they do not want to accept having lost, and finally the price continues in that direction contrary to their analysis, causing them to lose a lot more money.
As much as when going to the doctor, advancing in the trading career requires identifying what individual problems you have and applying the appropriate remedies, that is, working on the weaknesses.
For this, it is essential to review the operations at a time and draw conclusions, and for this it is essential to keep a daily trading journal, preferably in a physical notebook, of each day of operation, so that it can be reviewed each end of the trade. week and progressively correct mistakes and enhance what already works for us, to avoid committing them again and spending years going around in circles.
I personally use a physical notebook for a lifetime. I do it this way for various reasons, and although in principle it can be argued that it is much more practical to write it on a computer, with the option of uploading it to the cloud and accessing it from anywhere, each person works in a different way, and I, After trying in virtual and physical, I have decided on physical, because it works better for me personally. The reasons I have, again I stress very personal, are the following:
- I usually use the computer a lot so I always end up with a desk full of documents, shortcuts, stickers of ideas that come to mind ... keeping a diary requires discipline, and added to the fact that I am quite clueless, if I do not have a notebook There are times when I don't even remember writing it when I open the operations. However, when I have the notebook next to the computer and always in my range of vision, I never forget it.
- Writing with a pen requires more time than using a computer. I learned to type and can type at high speed on the keyboard, however writing on the notebook is much slower.
This, far from being a disadvantage, I see it as a great advantage, since as I write I have more time to reason it, so it is easier to reach conclusions as it is written and that the result has more value for later analysis.
- It is easier for me to add graphic parts to the written part. When I write when I open a trade, I always tend to draw more or less the shape of the price it has at that moment and indicate with an arrow my entry point and stop loss. This could be done on a computer and then added to the text document if it is made virtual, but it seems faster and easier to me to just stop writing and draw it.
- Writing in a physical notebook is totally private, they will never be able to sneak a virus into you and steal your information if you write it on paper.
As you can see, virtual or online is not always the best for everyone.
That said, the way I keep my journal is as follows:
- The first thing I do is write the date.
- I write the time and the market symbol of the trade I have opened, the why, and then I draw more or less the current price and the stop loss level.
- On Sunday I review every week. What I do is start with the first trading day of that week and see what the price really did. I write the newspaper in blue, and the weekly review in red: I draw in red more or less the price movement that happened after the operation.
I also write if I was right or wrong. If I was correct, I see if I could have won more and to what extent. If I have failed I analyze why. I finally draw a conclusion, if there is one, and move on to the next day. Sometimes the only conclusion is that simply the price movement has gone against and no sense can be found, so I assume it as an irreparable statistical loss.
After the page of the last day of that week, I write the date and a title with "reflections of the week", and I write again all the conclusions that I have drawn each day and then I make a final reflection on those conclusions to see if You may see a pattern of behavior or technical failure that may change for the following week.
As you can see, I am very methodical when it comes to my trading, and this has helped me greatly to polish mistakes that I could not have realized if I did not keep a journal. In the day to day of life many things happen that can distract you and sometimes keep you making very absurd mistakes, that if you had reviewed your operation a little, you would have quickly realized.
For these reasons I believe that anyone who boasts of having results in this business must realize that it is necessary and make an effort to create this habit.

ANÁLISE DE 15MIN EM DOT/USDTANÁLISE EM 15MIN COM TEMPO GRÁFICO DE 5MIN PARA SWING
RSI >60 GANHANDO FORÇA E CRUZAMENTO DA MÉDIA MAIS CURTA NO MACD
