LONG ON GBP/AUDGBP/AUD has created a nice falling wedge into a major demand zone.
Price has already swept sell side liquidity and has given bullish pressure.
I will be buy GA looking to catch 150-200 pips by the end of the week.
Crosses

SHORT ON EUR/CADEUR/CAD has a nice rising channel at a major resistance area.
There is a lot of Liquidity to the downside.
I have a sell limit set at the top of the channel to activate me after the possible sweep of liquidity behind the resistance line of the channel.
Looking to catcu 300-400 pips on this play.

BUY NZDCHFI really dont trade crosses at all, but when I see a pullback cooking I take it. On NZDCHF I see a potential buy opportunity from 0.5350 targeting highs of 0.54160 Use proper risk amanagement and remember the spreads on crosses are high. Cheers

Double top on GBP/JPY at key resistanceThe Japanese yen may have weakened following the BOJ’s latest ‘non decision’ regarding monetary policy, but markets clearly weren’t surprised enough for it to extend its bearish moves today. Not a single xxx/JPY pair managed to break above its cycle highs, and momentum is now turning lower on these pairs to show a strengthening of the yen.
But what has caught our eye is the double top on the GBP/JPY daily chart, as it has stalled around the December 2015 high. Also note that the GB-JP 2-year spread is also quite low relative to spot GBP/JPY, and it makes us wonder if GBP/JPY has risen too far, too soon.
The 1-hour chart shows that momentum has turned lower in the first half of Wednesday’s Asian session. Prices are trading beneath the 50-dar EMA and daily pivot, so we would consider shorts below 118.20 for an anticipated move to the weekly pivot around 187.25 – although the cycle lows or daily S1 between 187.32 – 187.40 could also be considered.
A break beneath the weekly pivot point assumes a deeper retracement is playing out on the daily chart.

here we go to destination...whats next??#GBPJPY... what a smoothly drop below your zone..
now market just 80 pips away from your target..
keep close your target it will be key level,
that can change the story of GBPJPY.
holding of your target mean again a bounce to sky otherwise drop to the bottom...
trade wisely
good luck..

🐱👤⛩ Sannin Cross Clouds + ⛩ 🐱👤Credit to Ron Westbrook, CBlast and Kiakili.
This indicator is a re-engineering of their hard work.
I Use the Sannin cloud to help determine the trend of price action.
In theory the color indicates the trend direction.
The VWAP 9ema Cross is still in BETA testing. In theory it will
help determine faster term trend. This is one strategy used by
Kiakili.
Death Cross - Fast ema crosses below Slow ema . ( Bearish )
Golden Cross - Fast ema crosses above Slow ema ( Bullish )

EUR/JPY -26/9/2022-• Ascending trend line since March 2022 still intact, tested today and acted as a support, prices bounced back up after touching it
• Horizontal resistance line at 144 caping the upside, potential ascending triangle in play
• Fifth time the ascending trend line is touched without being broken
• As long as the trend line remains intact, up trend remains solid with first target at 140 followed by 144
• If bulls were able to break the 144 resistance level, we might have a triangle breakout with a target above 160 as per the measurement method ( height of the triangle added to the breakout point )

CHFJPY ANALYSISCHFJPY broke the downtrend line
Price is in an uptrend
Pair is above the key level at 119.70
Price is above HVN at level 120.00 which indicates that the pair is in the accumulation phase
Above SMA 100
It's expected to target resistance level at 121.00

GBPUSD ANALYSISPair broke the downtrend line
Price is above the key level at 1.3690
Above SMA 100
MACD shows bullish momentum
It's expected to target HVN at level 1.3830

AUDJPY ANALYSISAUDJPY broke the downtrend line
Price is above the key level at 79.80
Above SMA 100
MACD shows bullish momentum
It's expected to target HVN at level 81.05

EURGBP ANALYSISEURGBP is trading in uptrend
Price is above the key level at 0.8560
Above SMA 100
MACD shows the start of bullish momentum
Pair is forming ascending triangle pattern
It's expected to target resistance level at 0.8660

NZDCHF ANALYSIS NZDCHF broke uptrendline
Pair is trading in downtrend
Price is below key level at 0.6500
Price is below HVN at level 0.6528 which indicates that pair is in distribution phase
Below SMA 100
RSI is below level 50
It's expected the continuation of bearish momentum to target 61.8% Fibonacci level at 0.6367

AUDCAD ANALYSIS AUDCAD rebounded from key level corresponding to 50% Fibonacci level at 0.9245
Price broke the corrective downtrend line
MACD shows bullish momentum
It's expected to target resistance level at 0.9375

EURGBP ANALYSISEURGBP is in uptrend
Pair is above key level at 0.8550
Price broke upper limit of symmetrical trianlge pattern
Above SMA 100
MACD shows start of bullish momentum
It's expected to target supply zone at level 0.8670

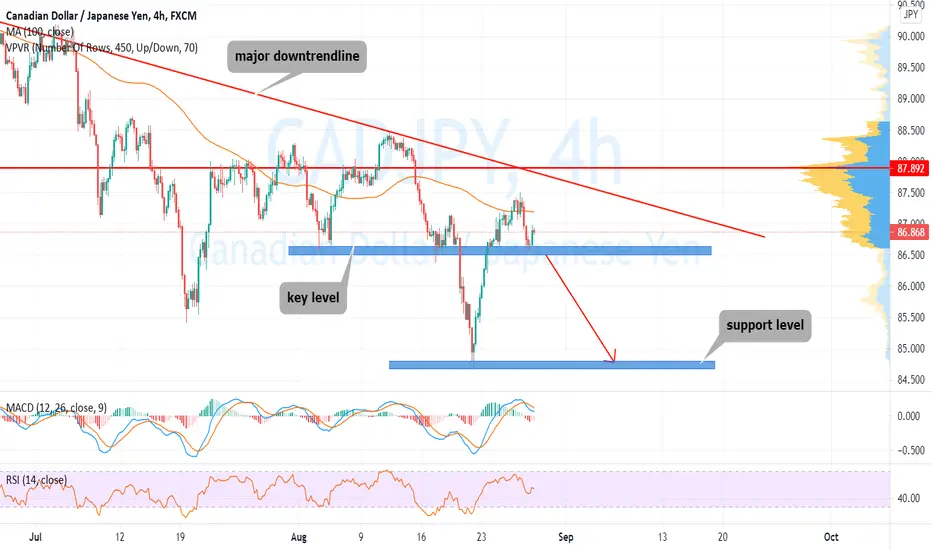
CADJPY ANALYSISCADJPY is trading in a downtrend
Below SMA 100
MACD shows bearish momentum
we r waiting for the price to break key level at 86.55 to open short trade
It's expected to target support level at 84.70
EURGBP ANALYSISEURGBP broke the downtrend line
Pair respects uptrend line
Price is above the support level at 0.8550
Above SMA 100
MACD shows weakness in bearish momentum
It's expected forming bullish Elliot wave 5 to target level at 0.8640

CHFJPY ANALYSISCHFJPY broke a downtrend line
Price is above the support level at 120.00
Price is above HVN at level 119.75 which indicates that the pair is in the accumulation phase
Above moving average 100
It's expected to target resistance level at 121.10

NZDCHF ANALYSIS NZDCHF broke the downtrend line
Price is above the key level at 0.6300
Above SMA 100
MACD shows bullish momentum
It's expected to target HVN at level 0.6465

GBPAUD ANALYSISGBPAUD broke upper limit of symmetrical triangle pattern
Above SMA 100
MACD shows bullish momentum
It's expected to target level 1.9050

AUDCAD ANALYSIS Pair rejected from 78.6% Fibonacci level at 0.9180
Price broke corrective downtrend
MACD shows the start of bullish momentum
RSI is above level 50
we r waiting for price to exceed the next resistance level at 0.9230 to open long trade
It's expected to target the supply zone at level 0.9310

AUDJPY ANALYSISAUDJPY broke minor downtrendline
RSI is above level 50
we r waiting for price to exceed the key level at 81.60 to open long trade
It's expected to target a major downtrendline near level 83.40

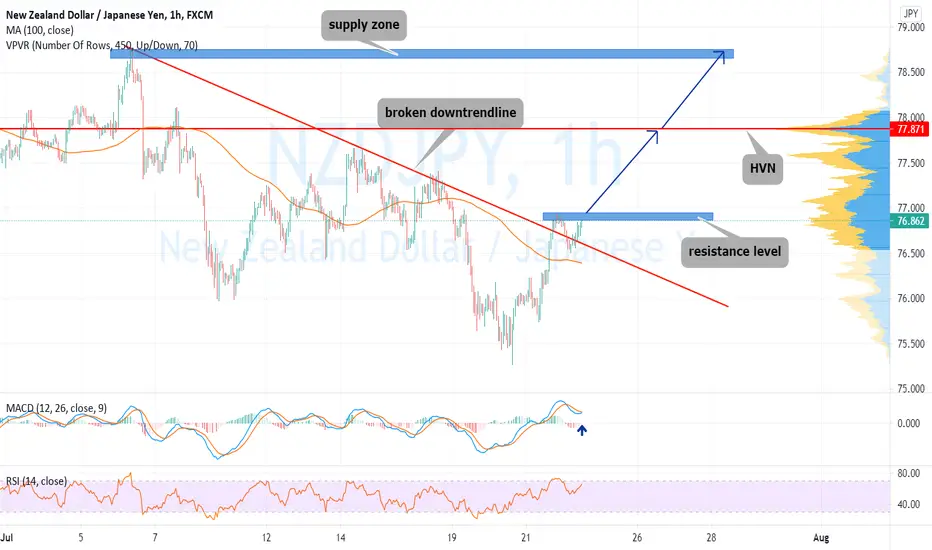
NZDJPY ANALYSIS NZDJPY broke downtrendline
Above SMA 100
MACD shows weakness in bearish momentum
we r waiting price to exceed next resistance level at 76.93 to open long trade
It's expected to target first HVN at level 77.85 then supply zone at level 78.75
GBPJPY ANALYSIS GBPJPY rebounded from demand zone at level 148.50 with strong bullish movement
Pair is above key level at 150.75
MACD shows bullish momentum
RSI is in uptrend
It's expected to target downtrendline near level 153.85
