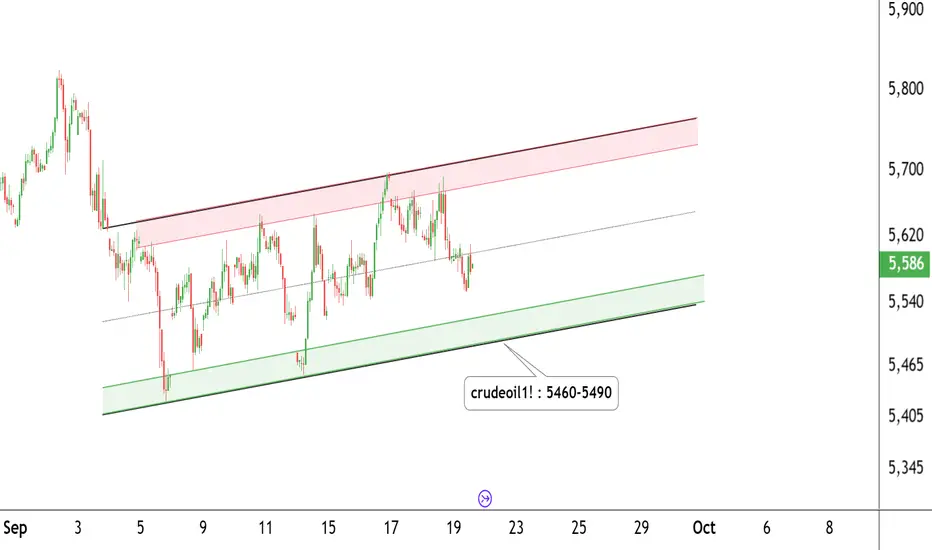
Momentum Speaks: Crude Oil Buy OpportunityCrude Oil Momentum Buy Setup
4H & 15M Timeframe View
Crude Oil is respecting the channel lower boundary with reversal from 5460–5490 support zone.
Currently moving in momentum, with Supertrend also confirming buy-on-dip opportunity.
Watch for pullbacks near 5540–5550 support (Supertrend zone) for potential entries.
Thank you!
Crude Oil

CRUDE OIL (WTI): Pullback Trade From Support
WTI Crude Oil looks oversold after a test of a significant
daily horizontal demand zone.
A formation of a bullish imbalance candle on an hourly time frame
indicates a strength of that structure.
With a high probability, the price will pull back to 62.38
❤️Please, support my work with like, thank you!❤️
I am part of Trade Nation's Influencer program and receive a monthly fee for using their TradingView charts in my analysis.

CRUDE OIL LONG FROM SUPPORT|
✅CRUDE OIL is going down to retest
A horizontal support around 61.80$
Which makes me locally bullish biased
And I think that we will see a rebound
And a move up from the level
Towards the target above at 62.80$
LONG🚀
✅Like and subscribe to never miss a new idea!✅

CRUDE OIL Rebound Ahead! Buy!
Hello,Traders!
CRUDE OIL has been ranging
For a while now and the
Price is now about to
Retest the horizontal
Support level of 61.50$
From where a local
Bullish correction is
To be expected
Buy!
Comment and subscribe to help us grow!
Check out other forecasts below too!
Disclosure: I am part of Trade Nation's Influencer program and receive a monthly fee for using their TradingView charts in my analysis.

Crude Oil Trading Levels – Plan Your Move!CRUDE OIL – Daily Timeframe Update
Crude Oil is trading within a well-defined parallel channel on the daily chart.
The price is currently taking support near the 5460–5490 zone and moving within an ascending channel.
Support Zone: 5460 – 5490
Resistance Zone: 5700 – 5720
If these levels sustain, we may see higher prices ahead in Crude Oil.
Thank you!!
CRUDE OIL (WTI): Strong Bullish Confirmation?!
Update for my yesterday's idea for WTI Crude Oil.
The price retested a recently broken structure and we see a
strong bullish reaction to that today.
A bullish violation of a resistance line of a falling wedge pattern
indicates a strong buying pressure.
I think that the market will continue growing and reach 64.65 resistance soon.
❤️Please, support my work with like, thank you!❤️
I am part of Trade Nation's Influencer program and receive a monthly fee for using their TradingView charts in my analysis.

Crude Oil Pivot at $65 | Break & Hold Fuels UptrendLast Sunday Opec+ agrees further oil output boost by 137K barrels per day, but less than Sep / Aug output, when market open it went higher.
How to manage short-term risk, in this case opportunity with CME Group weekly energy options on such a scheduled announcement?
Video version:
Crude Oil Futures & Options
Ticker: CL
Minimum fluctuation:
0.01 per barrel = $10.00
Disclaimer:
• What presented here is not a recommendation, please consult your licensed broker.
• Our mission is to create lateral thinking skills for every investor and trader, knowing when to take a calculated risk with market uncertainty and a bolder risk when opportunity arises.
CME Real-time Market Data help identify trading set-ups in real-time and express my market views. If you have futures in your trading portfolio, you can check out on CME Group data plans available that suit your trading needs tradingview.com/cme/

CRUDE OIL (WTI): Important Breakout
Crude Oil broke and closed above a major daily horizontal resistance.
With a high probability, a broken structure turns into a potentially strong
support now.
I will expect a rise from that and a bullish continuation to 65.56 resistance.
❤️Please, support my work with like, thank you!❤️
I am part of Trade Nation's Influencer program and receive a monthly fee for using their TradingView charts in my analysis.

CRUDE OIL (WTI): Complete Support & Resistance Analysis Today
Here is my latest structure analysis for WTI Oil.
Resistance 1: 63.7 - 64.1 area
Resistance 2: 65.6 - 66.8 area
Resistance 3: 70.2 - 70.5 area
Support 1: 61.4 - 62.0 area
Support 2: 59.0 - 60.8 area
Support 3: 55.3 - 57.3 area
The price is currently breaking Resistance 1.
A daily candle close above that may push the prices to Resistance 2.
❤️Please, support my work with like, thank you!❤️
I am part of Trade Nation's Influencer program and receive a monthly fee for using their TradingView charts in my analysis.

Crude Oil Eyes 4-Month Consolidation BreakoutOil prices have been consolidating within a triangle formation since the June 2025 high, which was triggered by the Israel–Iran escalation. Price action has traced a sequence of lower highs and higher lows, holding above the critical $61 support.
With five legs unfolding inside the triangle, a potential bullish breakout could take shape if the price holds above $64, opening the door toward: $66.80, $67.70, and $70.20, which aligns with the upper boundary of a long-term descending channel from 2022
A confirmed break above $70.20 could shift the long-term trend, transitioning from consolidation to a potential bullish reversal.
From the downside:
Failure to hold above $61 could see a retest of the 2025 lows, with key support levels at: $60.20, $59.20, $58.00.
Key events:
• FOMC meeting – Wednesday
• Ukraine-Russia refinery attacks
• Demand vs OPEC unwinds
Written by Razan Hilal, CMT

Crude Oil Monthly Forecast: September 2025
The West Texas Intermediate Crude Oil market has been rather negative during the month of August, but at the end of the month we saw the market bounce roughly 50% of the move, and as I do this analysis at the end of the month, we are sitting at a crucial level.
This does make a certain amount of sense, because there are a lot of questions right now about where the global economy is going.
Crude Oil and the Economy
Keep in mind that crude oil is extraordinarily important for most economies, and of course the transportation of goods and services. In other words, crude oil will rally in times of economic growth but also will struggle in times where growth is extraordinarily limited. That’s the question we find ourselves trying to answer at the moment, and this may be part of the reason why we are hanging around and trying to sort out where we are going next.
Another major problem at the moment is the fact that Russia, OPEC, in the United States are all ramping up production, which of course will drive down price as supply is getting to be too much. Between that and the possibility of the global economy slowing down, this could be a very bad sign for crude oil. This isn’t to say that we need to fall apart, just that it might be extraordinarily difficult for oil to get a bit of a bid at the moment.
Ultimately, I think the $65 level continues to be an area of interest, as the price has acted like a magnet more than once. If we can rally from here, somewhere around the $60 level I would expect to see a lot of resistance. On the other hand, if we drop from here, I think somewhere around the $60 level there should be significant support. Anything below would be an extraordinarily negative sign. I believe we are trying to find some type of range, perhaps between the $62 level and the $67 level, but we will have to wait and see how that plays out. Either way, I would anticipate choppy and basically sideways action for the month.

Oil gains amid geopolitical risks, supply outlookOil gains amid geopolitical risks, supply outlook
Oil rose in early trade as markets weighed rising geopolitical tensions against forecasts of oversupply. Trump warned of major sanctions on Russia and urged allies to impose steep tariffs on China and India for buying its crude, while Ukraine’s drone strikes on Russian refineries added to risks.
Goldman Sachs expects oil to trend lower next year on strong supply growth but says prices may rebound sooner if inventories peak or OPEC cuts output. The bank now sees Brent in the low $50s and WTI near $50 by end-2026.

USOIL might be the next commodity to be on the look out of!USOIL is still yet anticipated to fulfill the completion of its bearish structure, before it could breverse to the bullish side!
Crude Oil (USOIL) – Long SetupOil is currently trading around $63.20 and has formed a clean ascending structure, pushing into the breakout zone. Price is respecting the trendline well and is consolidating just below the EMA cluster – a breakout could be next.
We're currently in a narrow entry zone where bulls may gain control if we see a clean break above the local resistance range.
Trade Setup:
Entry: within the purple box (current zone)
Stop Loss: $62.60 just below the trendline – invalid if broken
Breakout Confirmation: clear candle close above $63.45
Targets:
T1: $63.70
T2: $64,60
Why Long?
Trendline support is holding – price has been bouncing cleanly off the rising line.
Momentum building – repeated tests of resistance without strong rejection.
EMA cluster as magnet – price may want to retest and potentially break through the EMA zone sitting above.
Summary:
Crude oil is coiling tightly just below resistance and trendline support is holding strong.
If we get a push above the breakout zone, I expect follow-through toward T1 = $63.70 and T2 = $64.60
Setup becomes invalid if the ascending trendline breaks clearly to the downside.
No financial advice – just how I see the chart.

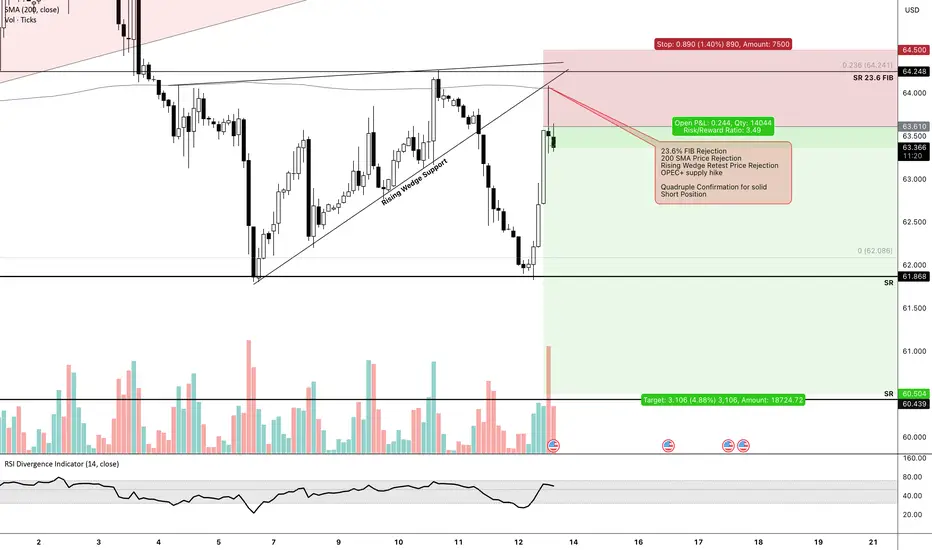
OIL Trade Setup - September 12th📲 NFX TRADE ALERT – Swing Setup
💹 Instrument: Crude Oil GBEBROKERS:USOIL
🛒 Trade Type: Swing – Sell at Market
📍 Entry: $63.60
⛔ Stop Loss: $64.50
✅ Target Profit: $60.50
📊 Trade Setup Analysis – GBEBROKERS:USOIL
🔻 23.6% FIB rejection
🔻 200 SMA rejection
🔻 Rising wedge retest rejection
🔻 OPEC+ supply hike
That’s quadruple confirmation supporting a solid short position.
Crude: Importance Of The 61.8% Shows Resistance at 64Crude, always came close to the important 61.8% Fib, then it turned lower, broke the channel. Resistance is at $64.

Manage Crude Oil Risk with Weekly Energy OptionsOn Sunday Opec+ agrees further oil output boost by 137K barrels per day, but less than Sep / Aug output, when market open it went higher.
How to manage short-term risk, in this case opportunity with CME Group weekly energy options on such a scheduled announcement?
Crude Oil Futures & Options
Ticker: CL
Minimum fluctuation:
0.01 per barrel = $10.00
Disclaimer:
• What presented here is not a recommendation, please consult your licensed broker.
• Our mission is to create lateral thinking skills for every investor and trader, knowing when to take a calculated risk with market uncertainty and a bolder risk when opportunity arises.
CME Real-time Market Data help identify trading set-ups in real-time and express my market views. If you have futures in your trading portfolio, you can check out on CME Group data plans available that suit your trading needs www.tradingview.com

CRUDE OIL (WTI): Strong Bearish Pressure
WTI Crude Oil is under a strong bearish pressure after
US CPI release today.
A bearish breakout of a support line of a flag pattern
in a clear intraday downtrend on a 4H time frame leaves
a strong confirmation.
I think that the price will reach 62.0 level soon.
❤️Please, support my work with like, thank you!❤️
I am part of Trade Nation's Influencer program and receive a monthly fee for using their TradingView charts in my analysis.

Oil at the crossroads - buy zone or bear trap?Technically , WTI is testing the lower boundary of a converging wedge, hovering around the identified buy zone. Holding above 62–63 is critical for bulls, as a breakdown would expose targets at 61.30 and 58.80. Conversely, a rebound from current levels could trigger a move toward 70.50 and even 77.60 if momentum builds. The daily stochastic hints at a potential reversal to the upside, suggesting that a short-term bounce may be in play.
Fundamentally , the outlook remains tense: weak demand from China and global economic uncertainty are weighing on prices, while OPEC+ continues to maintain control over supply. U.S. inventory swings, with alternating builds and exports, add to volatility. Overall, the setup looks neutral with elevated risk - macro data could easily tip the balance either way.
Tactically , the market is facing a binary scenario: sustained strength above 63 opens the way to 70.50 and 77.60, while failure here brings 58.80–55.60 into focus.
In short, oil is at a crossroads and the next decisive move depends on whether bulls can hold the line.

Oil near $63 as Middle East tensions and tariff risks drive gainOil near $63 as Middle East tensions and tariff risks drive gains
WTI crude traded around $63 August 10, marking a third day of gains as Middle East tensions escalated after Israel struck Hamas leadership in Qatar. The move adds to years of regional operations and heightens supply concerns, supported by OPEC+’s smaller October output hike.
Meanwhile, U.S. President Trump urged the EU to impose 100% tariffs on Chinese and Indian goods to pressure Russia, with Washington ready to match. U.S. crude inventories rose 1.25M barrels, tempering the rally. Global stocks gained and the dollar steadied ahead of key U.S. inflation data, while gold held near record highs.

Market Analysis: WTI Crude Oil StrugglesMarket Analysis: WTI Crude Oil Struggles
Crude oil is showing bearish signs and might decline below $62.25.
Important Takeaways for WTI Crude Oil Price Analysis Today
- Crude oil price failed to clear the $65.60 region and started a fresh decline.
- There is a short-term bullish trend line forming with support at $62.25 on the hourly chart of XTI/USD.
WTI Crude Oil Price Technical Analysis
On the hourly chart of WTI Crude Oil, the price struggled to clear $65.60 against the US Dollar. The price started a fresh decline below $64.60.
The bears gained strength and pushed the price below $62.00. Finally, the price tested $61.20 and recently started a recovery wave. There was a move above $62.00, the 50-hour simple moving average, and the 23.6% Fib retracement level of the downward move from the $65.63 swing high to the $61.23 low.
The bears are now active near $63.00. If there is a fresh increase, the price could face a barrier near $63.05. The first major resistance is near the 50% Fib retracement at $63.40. The next stop for the bulls could be near $64.60. Any more gains might send the price toward $65.60.
Conversely, the price might start another decline and test a short-term bullish trend line with support at $62.25 and the 50-hour simple moving average.
The next major support on the WTI crude oil chart is $61.20. If there is a downside break, the price might decline toward $60.50. Any more losses may perhaps open the doors for a move toward $60.00.
This article represents the opinion of the Companies operating under the FXOpen brand only. It is not to be construed as an offer, solicitation, or recommendation with respect to products and services provided by the Companies operating under the FXOpen brand, nor is it to be considered financial advice.

USOIL LOCAL SHORT|
✅CRUDE OIL is going up to retest
A horizontal resistance of 63.00$
And as OIL is in the downtrend
I am locally bearish biased
So I think that we will see a pullback
And a move down from the level
Towards the target below at 62.20$
SHORT🔥
✅Like and subscribe to never miss a new idea!✅
CRUDE OIL Support Ahead! Buy!
Hello,Traders!
CRUDE OIL keeps falling
In a downtrend which seems
To indicate that the market
Has its doubts about the
Economy, however, a strong
Horizontal support is ahead
Around 60.00$ and after the
Retest we will be expecting
A local bullish rebound
Sell!
Comment and subscribe to help us grow!
Check out other forecasts below too!
Disclosure: I am part of Trade Nation's Influencer program and receive a monthly fee for using their TradingView charts in my analysis.
