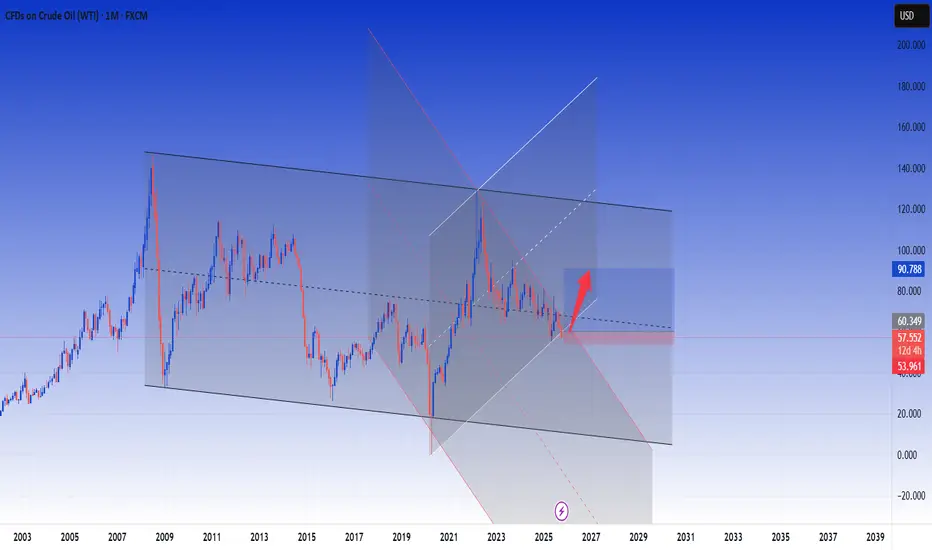
WTI bullish swing setupRSI divergence
Bullish chart pattern
Wait for trend reversal
red line is previous major level
Entry on trend reversal
RRR 1:2
Crude Oil

Oil - Expecting Bullish Continuation In The Short TermM15 - Strong bullish momentum.
No opposite signs.
Until the two Fibonacci support zones hold I expect the price to move higher further.
If you enjoy this idea, don’t forget to LIKE 👍, FOLLOW ✅, SHARE 🙌, and COMMENT ✍! Drop your thoughts and charts below to keep the discussion going. Your support helps keep this content free and reach more people! 🚀
--------------------------------------------------------------------------------------------------------------------

XTI/USD : Oil Prices Rise Following Trump’s Sanctions DecisionXTI/USD Chart Analysis: Oil Prices Rise Following Trump’s Sanctions Decision
According to the XTI/USD chart, WTI crude is now trading above the key psychological level of $60, marking a sharp rebound of over 3% from October’s lows.
The surge came after U.S. President Donald Trump announced sanctions against major Russian oil producers Rosneft and Lukoil, which together account for more than 5 million barrels of oil per day.
The move is expected to reduce global oil supply; however, media outlets point out that:
→ there is no certainty that China and India will refrain from purchasing Russian crude;
→ previous sanctions introduced under the Biden administration — targeting companies such as Gazprom Neft and Surgutneftegaz — had little impact on Russian oil exports.
What could happen next?
Technical Analysis of the XTI/USD Chart
On 20 October, we noted that two descending channels had formed:
→ Red channel – a long-term pattern that developed following the Middle East escalation in June;
→ Purple channel – indicating accelerated downside pressure driven by rising OPEC+ output and hopes for a U.S.–China trade accord.
Our earlier assumption that the market was oversold and that the Falling Wedge pattern might trigger a bullish reversal proved correct (as shown by the arrow). Following the formation of an inverted head and shoulders pattern, oil prices climbed towards the median line of the purple channel.
At this stage, consolidation appears the most likely scenario, as supply and demand may stabilise around the channel’s median. Much will depend on statements from the White House, since higher oil prices could threaten U.S. inflation objectives.
However, if bullish momentum persists, WTI may continue to rise towards the next resistance area, defined by:
→ the upper boundary of the purple channel;
→ the 8–9 October highs, where a false breakout similar to the bear trap seen on 26 September cannot be ruled out.
This article represents the opinion of the Companies operating under the FXOpen brand only. It is not to be construed as an offer, solicitation, or recommendation with respect to products and services provided by the Companies operating under the FXOpen brand, nor is it to be considered financial advice.

Trading Crude Oil and the Geopolitical Impact on PricesIntroduction
Crude oil is one of the most strategically significant commodities in the global economy. It fuels transportation, powers industries, and serves as a critical input for countless products ranging from plastics to fertilizers. Because of its universal importance, crude oil trading is not just a financial endeavor—it is a reflection of global political stability, economic growth, and international relations. The price of crude oil is highly sensitive to geopolitical events, including wars, sanctions, alliances, and policy changes. Understanding how geopolitical dynamics affect oil trading and pricing is vital for traders, investors, and policymakers.
1. The Fundamentals of Crude Oil Trading
Crude oil trading involves the buying and selling of oil in various markets, primarily through futures contracts on exchanges such as the New York Mercantile Exchange (NYMEX), Intercontinental Exchange (ICE), and Dubai Mercantile Exchange (DME). These contracts allow traders to speculate on the future price of oil, hedge against risks, or facilitate physical delivery. Two main benchmark grades dominate the market: West Texas Intermediate (WTI) and Brent Crude.
WTI Crude Oil is primarily sourced from the U.S. and traded in dollars per barrel.
Brent Crude Oil is produced in the North Sea and serves as the global benchmark for pricing.
Oil prices are influenced by multiple factors, including supply and demand fundamentals, global economic growth, production levels, inventory data, transportation costs, and geopolitical events. Among these, geopolitical tensions often have the most immediate and dramatic impact.
2. Geopolitics as a Determinant of Oil Prices
The global oil market is uniquely vulnerable to geopolitical developments because a significant portion of reserves and production is concentrated in politically sensitive regions such as the Middle East, North Africa, and Russia. Around 60% of proven oil reserves lie in OPEC (Organization of Petroleum Exporting Countries) member nations, many of which have experienced conflict, sanctions, or regime instability.
Geopolitical risk refers to the potential disruption in oil supply or transportation routes due to international conflicts, political upheaval, or policy decisions. When such risks escalate, traders often bid up oil prices in anticipation of supply shortages—even before any actual disruption occurs.
3. Historical Perspective: Major Geopolitical Events and Oil Prices
a. The 1973 Arab Oil Embargo
One of the earliest and most significant examples of geopolitically driven oil price shocks occurred in 1973 when Arab OPEC members imposed an oil embargo against the United States and other nations supporting Israel during the Yom Kippur War. Oil prices quadrupled within months, leading to inflation, recession, and a global energy crisis. The embargo demonstrated the power of oil as a political weapon and the vulnerability of consumer nations.
b. The Iranian Revolution (1979)
The overthrow of the Shah of Iran and the subsequent decline in Iranian oil production reduced global supply by nearly 5%. This shortage, coupled with the Iran-Iraq War (1980–1988), sent prices soaring again. The resulting volatility highlighted how political instability in a single oil-producing nation could ripple through the entire global economy.
c. The Gulf War (1990–1991)
Iraq’s invasion of Kuwait disrupted nearly 5 million barrels per day of oil production. The U.S.-led coalition’s response and the ensuing war created massive uncertainty in the Middle East, briefly pushing oil prices above $40 per barrel—a significant level for that time.
d. The Iraq War (2003)
The U.S. invasion of Iraq reignited geopolitical fears about supply disruptions. Although global production eventually stabilized, the war contributed to sustained higher oil prices in the early 2000s, further compounded by rapid industrialization in China and India.
e. The Arab Spring (2010–2011)
The wave of protests across the Middle East and North Africa led to regime changes and unrest in key producers such as Libya and Egypt. The civil war in Libya, in particular, cut oil output by over one million barrels per day, causing Brent crude prices to exceed $120 per barrel.
f. Russia-Ukraine Conflict (2014 and 2022)
Russia’s annexation of Crimea in 2014 and its full-scale invasion of Ukraine in 2022 significantly disrupted global energy markets. As one of the world’s largest oil and gas exporters, Russia faced Western sanctions that restricted exports, insurance, and financing. In early 2022, Brent crude spiked above $130 per barrel, reflecting fears of prolonged supply shortages and energy insecurity across Europe.
4. Channels Through Which Geopolitics Impacts Oil Prices
Geopolitical events influence oil prices through several interconnected channels:
a. Supply Disruptions
Conflicts or sanctions can directly reduce oil supply by damaging infrastructure, limiting production, or restricting exports. For example, sanctions on Iran in 2012 and again in 2018 led to significant declines in its oil exports, tightening global supply.
b. Transportation and Shipping Risks
Chokepoints such as the Strait of Hormuz, Suez Canal, and Bab el-Mandeb Strait are vital for global oil transportation. Any military conflict or threat in these areas immediately raises concerns about shipping disruptions, leading to higher prices. Nearly 20% of global oil passes through the Strait of Hormuz daily.
c. Speculative Reactions
Traders and hedge funds respond quickly to geopolitical news, often amplifying price movements. Futures markets price in expected risks, causing volatility even when actual supply remains unaffected.
d. Strategic Reserves and Policy Responses
Nations often release oil from strategic reserves or negotiate production increases through OPEC to stabilize markets. For example, the U.S. and IEA (International Energy Agency) coordinated strategic reserve releases in 2022 to offset supply disruptions caused by the Russia-Ukraine conflict.
e. Currency Movements
Since oil is traded in U.S. dollars, geopolitical tensions that weaken the dollar or create global uncertainty can influence oil prices. A weaker dollar often makes oil cheaper for non-U.S. buyers, boosting demand and raising prices.
5. OPEC and Geopolitical Strategy
The Organization of Petroleum Exporting Countries (OPEC), formed in 1960, and its extended alliance OPEC+, which includes Russia, play a pivotal role in determining oil supply and prices. The organization uses coordinated production quotas to manage global prices, often aligning decisions with geopolitical interests.
For instance:
In 2020, during the COVID-19 pandemic, OPEC+ cut production by nearly 10 million barrels per day to support collapsing prices.
In 2023, Saudi Arabia and Russia announced voluntary cuts to maintain price stability amid slowing demand and Western sanctions.
OPEC’s policies are inherently geopolitical, balancing the economic needs of producers with the political relationships among member states and major consumer nations.
6. Energy Transition and the New Geopolitics of Oil
The growing global emphasis on renewable energy and decarbonization is reshaping the geopolitical landscape of oil trading. As nations transition to cleaner energy, oil-producing countries face the challenge of maintaining revenue while managing political stability.
However, this transition also introduces new geopolitical dependencies—for example, on lithium, cobalt, and rare earth metals used in electric vehicle batteries. While demand for oil may gradually plateau, geopolitical risks remain as nations compete over new energy supply chains.
Additionally, U.S. shale production has transformed the country from a net importer to a major exporter, reducing its vulnerability to Middle Eastern geopolitics but also introducing new market dynamics. Shale producers can ramp up or scale down production relatively quickly, acting as a “shock absorber” to global price swings.
7. The Role of Technology and Market Transparency
Technological advancements in trading—especially algorithmic and data-driven models—have increased market liquidity but also heightened sensitivity to news. Real-time tracking of geopolitical developments via satellites, social media, and analytics platforms allows traders to react instantly.
For example, satellite data showing tanker movements or refinery fires can trigger immediate price adjustments. The intersection of AI, big data, and geopolitics now defines modern oil trading strategies, with traders assessing both quantitative signals and qualitative geopolitical intelligence.
8. Managing Geopolitical Risk in Oil Trading
Professional oil traders and corporations employ various strategies to manage geopolitical risks:
Diversification: Sourcing oil from multiple regions to minimize reliance on unstable producers.
Hedging: Using futures, options, and swaps to lock in prices and reduce exposure to volatility.
Scenario Analysis: Running stress tests based on potential geopolitical outcomes (e.g., war, sanctions, embargoes).
Political Risk Insurance: Protecting investments against losses due to government actions or conflict.
Strategic Reserves: Governments maintain emergency stockpiles to stabilize supply during crises.
In addition, diplomatic engagement and international cooperation—such as IEA coordination or U.N.-mediated negotiations—can help mitigate disruptions and maintain market balance.
9. The Future Outlook: Geopolitics and the Oil Market
As of the mid-2020s, the global oil market faces a new era of geopolitical uncertainty. Key issues shaping the future include:
The U.S.-China rivalry, which may influence energy trade routes and technological access.
Middle Eastern realignments, including normalization of relations between former rivals and shifting alliances.
Climate policy conflicts, as nations balance carbon reduction commitments with economic growth needs.
Sanctions regimes on Russia, Iran, and Venezuela, which continue to restrict global supply flexibility.
The digitalization of trading, which increases speed and transparency but also amplifies volatility.
Although long-term demand growth may slow due to renewable energy adoption, oil will remain a central geopolitical and economic asset for decades. The world’s dependence on energy ensures that geopolitics will continue to shape price trends, investment decisions, and market psychology.
Conclusion
Crude oil trading is not merely a reflection of supply and demand; it is a barometer of global stability and geopolitical tension. From the 1973 oil embargo to the ongoing Russia-Ukraine conflict, political decisions have repeatedly proven capable of reshaping energy markets. For traders and policymakers alike, understanding the geopolitical dimensions of oil is crucial for navigating price volatility and maintaining economic resilience.
As the energy transition accelerates, the nature of geopolitical risk will evolve—but it will not disappear. The intersection of oil, politics, and global economics will continue to define international relations and financial markets, ensuring that crude oil remains one of the world’s most geopolitically sensitive and closely watched commodities.

Market Analysis: WTI Crude Oil Attempts ReboundMarket Analysis: WTI Crude Oil Attempts Rebound
WTI Crude oil is now attempting to recover after sliding toward $56.00.
Important Takeaways for WTI Crude Oil Price Analysis Today
- WTI Crude oil prices extended losses below the $60.00 support zone.
- It cleared a key bearish trend line with resistance at $57.50 on the hourly chart of XTI/USD.
WTI Crude Oil Price Technical Analysis
On the hourly chart of WTI Crude Oil, the price struggled to continue higher above $62.00 against the US Dollar. The price formed a short-term top and started a fresh decline below $61.20.
There was a steady decline below the $60.00 pivot level. The bears even pushed the price below $58.50 and the 50-hour simple moving average. Finally, the price tested $56.00. The recent swing low was formed near $55.94, and the price is now correcting losses.
There was a move above the 23.6% Fib retracement level of the downward move from the $62.45 swing high to the $55.94 low. The price cleared a key bearish trend line with resistance at $57.50.
On the upside, immediate resistance is near the 50% Fib retracement at $59.20. The main hurdle is $59.95. A clear move above $59.95 could send the price toward $62.45. The next stop for the bulls might be $64.00.
If the price climbs further, it could face sellers near $65.00. Immediate support is $57.50. The next major level on the WTI crude oil chart is $55.95. If there is a downside break, the price might decline toward $55.00. Any more losses may perhaps open the doors for a move toward the $52.00 zone.
This article represents the opinion of the Companies operating under the FXOpen brand only. It is not to be construed as an offer, solicitation, or recommendation with respect to products and services provided by the Companies operating under the FXOpen brand, nor is it to be considered financial advice.

CRUDE OIL (WTI): The Price Will Drop Lower!
Crude Oil is going to reach the year's low soon.
A confirmed bearish break of a minor structure on a daily time frame
suggest a strong selling pressure.
Be ready to see a test of 55.6 soon.
❤️Please, support my work with like, thank you!❤️

XTI/USD Chart Analysis: Oil Prices Fall to Yearly LowsXTI/USD Chart Analysis: Oil Prices Fall to Yearly Lows
As shown on the XTI/USD chart, WTI crude is trading below $57 today, with the 2025 low sitting near $55. Several factors are currently weighing on oil prices:
→ Uncertainty surrounding the US-China trade deal — the world’s two largest oil consumers — continues to cloud the outlook for global growth and crude demand.
→ Increased output from OPEC+ members has added further pressure, with the IEA last week raising its forecast for a global oil surplus.
→ A decline in the risk premium following the peace agreement in the Middle East has also reduced support for oil prices.
So, what could happen next?
Technical Analysis of the XTI/USD Chart
Seven days ago, we noted that:
→ In the long-term context, oil price fluctuations — following the June escalation in the Middle East — have formed a downward channel (shown in red). The current price has now slipped below its lower boundary.
→ In the short term, the pace of the decline appears to be accelerating, highlighted by the purple trajectory lines.
At that time, we suggested a scenario in which WTI could drift towards its yearly low near $55, which is now materialising. However, note the following:
→ The RSI indicator is hovering near oversold territory.
→ The chart shows signs of a Falling Wedge pattern, which often precedes a bullish reversal.
Given these signals, it is reasonable to assume that, after a roughly 10% decline since the start of the month, bears may begin locking in profits on short positions. This could trigger a technical rebound in WTI prices — potentially towards the resistance area defined by:
→ The lower boundary of the red channel;
→ The psychological level of $60;
→ The median line of the purple channel.
This article represents the opinion of the Companies operating under the FXOpen brand only. It is not to be construed as an offer, solicitation, or recommendation with respect to products and services provided by the Companies operating under the FXOpen brand, nor is it to be considered financial advice.

USOIL Trading IdeaBased on Simple Technical Analysis ( Trendline + Support & Resistance )
Risk Disclaimer:
Please be advised that I am not telling anyone how to spend or invest their money. Take all of my analysis as my own opinion, as entertainment, and at your own risk. I assume no responsibility or liability for any errors or omissions in the content of this page, and they are for educational purposes only. Any action you take on the information in this analysis is strictly at your own risk. There is a very high degree of risk involved in trading. Past results are not indicative of future returns. Good luck :-)
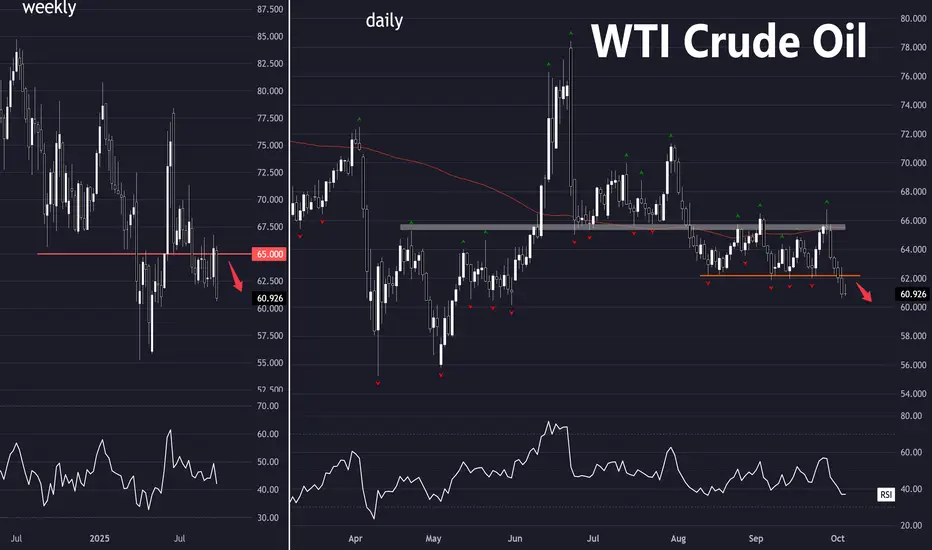
Crude Oil Outlook: Pressure Mounts as 2025 Lows Come Into ViewCrude oil prices are tracing another plunge back to yearly lows amid mounting oversupply, weak demand, and tariff concerns. New 2025 lows may be reached in the short-term horizon, aligning with the lower boundaries of a 3-year down trending channel
From a weekly time frame perspective, crude oil is facing the lower border of a three-year descending channel extending from the 2022 highs. The $55 support currently holds as the 2025 low, but a clean break below it could extend losses toward the $49 zone, aligning with the channel’s bottom boundary — a potential area of support. If this level fails, a deeper selloff could extend toward the $37 region.
On the upside, should prices recover above the $58 mark, a bullish rebound may extend toward $60, $63, and $66, respectively. However, for a sustainable bullish outlook on crude, a breakout above both the three-year downtrend and the $70 resistance is required.
Looking closely at the daily RSI, it is nearing oversold levels last seen in April 2025, suggesting that downside momentum could be approaching exhaustion.
In line with the recent movements of U.S. indices, will we see another dip-and-rebound scenario on crude oil — not identical, but perhaps reminiscent of April 2025?
- Written by Razan Hilal, CMT

WTI to $55 amid excess supply concerns?There was some relief at the start of the week for oil prices as traders reacted to the weekend news of de-escalation in the trade war between the US and China and figured that a potential extension of the tariff truce would be net positive for the demand outlook. However, the recovery stalled as WTI prices couldn’t break above $60 per barrel and have since turned flat on the week. The bearish trend thus remains intact for oil. Here, investors are concerned about the excess supply of the stuff hitting the markets, as the OPEC+ is gradually releasing some withheld oil supplies to win back market share. The group’s plan is to increase production by a total of 1.65 million barrels per day by the end of 2025. It has already increased output by 137K bpd from October. Against a backdrop of increasing supplies, it looks like WTI is heading towards the April lows of around $55.00 again.
By Fawad Razaqzada, market analyst with FOREX.com

Why Oil’s Drop Fuels a Global Risk-Off SentimentWTI Crude Oil Monthly Technical Outlook: Below $60 and the Broader Market Implications
As the fourth quarter of 2025 unfolds, the WTI Crude Oil (USOIL) chart offers a critical perspective on the state of global supply-demand balance and its broader impact on market sentiment. Trading near $58.5 per barrel, oil prices have fallen below a key psychological threshold, and while the move may seem technical at first, its implications reach far beyond the energy market.
The combination of weakening momentum indicators, rising supply projections, and softening global demand paints a nuanced but important story: oil’s slide below $60 is no longer just a chart event, it’s a macro signal about global growth, supply dynamics, and investor positioning.
Technical Overview: Momentum Loss Deepens
The monthly chart for WTI shows a clear picture of fatigue after multiple failed rebound attempts over the past 18 months. Since peaking near $130 in early 2022, prices have formed a persistent pattern of lower highs and lower lows, reflecting an extended process of distribution.
In recent months, WTI has failed to sustain moves above $70, with sellers consistently stepping in on rallies. The October bar extended losses toward the $58 level, marking the weakest monthly close since mid-2023.
Structurally, this decline puts WTI in a critical support zone between $55 and $57, which coincides with the base that previously stabilized prices in late 2023. Should this zone fail, the next major support rests around $50 per barrel, aligning with a key Fibonacci retracement of the 2020–2022 rally.
On the upside, the resistance band remains in the $65–$68 range, a descending trendline that has capped every rebound since early 2024. A decisive monthly close above that zone would be the first confirmation of renewed strength, but momentum indicators are still leaning toward continued weakness or sideways consolidation.
MACD and Stochastic RSI: Weakening Momentum Signals
The MACD (12,26,9) indicator remains subdued below the zero line, underscoring a prolonged loss of upside momentum. The histogram has recently turned red again, indicating that the MACD line may cross below the signal line, a potential confirmation that sellers still control the trend.
Meanwhile, the Stochastic RSI, which measures RSI velocity, has rolled over from midrange levels and is pointing lower again. Its failure to sustain a rebound above 50 shows that bullish energy has faded.
If this oscillator drops below 30, it would confirm a continuation of weak-to-neutral price action through the rest of Q4. Historically, such conditions precede prolonged consolidation phases, where volatility contracts before a new trend forms.
Together, these indicators portray a market not in full capitulation, but clearly lacking conviction for an upside breakout.
Fundamental Picture: Oversupply Meets Slowing Demand
While technical signals reveal a loss of momentum, the fundamental backdrop provides stronger clues about why oil has struggled to maintain value above $60. Recent data from major energy agencies, including the International Energy Agency (IEA), the U.S. Energy Information Administration (EIA), and multiple Reuters reports, converge on one central theme:
the global oil market is entering a surplus phase, with supply growth outpacing demand.
Large Oversupply Projections
Read full analysis on my website
darrismanresearch com
LONG ON USOILOIL has give us a nice (CHOC) change of character to the upside from a major demand area.
I will be buying oil looking to catch 300-400 pips.

WTI (Crude Oil) — Bullish Bat in ProgressOANDA:WTICOUSD
A bullish Bat pattern is currently forming, with a potential completion near $57.86 — the 88.6% Fibonacci retracement of the prior leg.
If the pattern confirms, it could trigger a bullish move toward $65.70, aligning with the 38.2% retracement level.
Price action around $57–58 will be key — watch for reversal confirmation, as momentum divergence before validating long positions.

WTI Crude Oil – Elliott Wave Analysis🛢️ WTI Crude Oil – Elliott Wave Analysis
Wave Structure · Smart Money · Fib Confluence · Price Action
🔎 Market Context & Overview
WTI Crude Oil remains one of the most critical and closely watched commodities in the global market. After decades of dramatic price swings driven by geopolitical events, supply shocks, and evolving demand patterns, the market now appears poised at a pivotal juncture. Combining Elliott Wave theory , Smart Money Concepts , Fibonacci retracements & extensions , and price action analysis with fundamental macro insights reveals a compelling narrative: Crude is concluding a prolonged corrective phase and preparing for a significant breakout. This analysis breaks down each wave, highlighting key technical and fundamental factors shaping the future trajectory of oil prices.
🔹 Wave 1 – Early Impulse (1970s–1985)
📉 Technicals: Formed the foundational uptrend post-oil embargo.
🧠 SMC: Accumulation following global inflation shock.
📊 Fib: Initial rally; shallow extension, not impulsive in character.
🌍 Macro: Oil embargo, inflation, and a restructuring of global energy markets gave birth to this initial move.
🔹 Wave 2 – Complex Correction (1985–1999)
🔁 Technicals: Multi-decade W-X-Y corrective pattern, fully retracing Wave 1.
🧠 SMC: Smart Money accumulation masked by long-term bearish structure.
📊 Fib : Deep correction toward 78.6%, classic for Wave 2.
🌐 Macro: OPEC instability, Gulf War, rising non-OPEC supply, and suppressed demand through globalization.
🔹 Wave 3 – Supercycle Rally (1999–2008)
🚀 Technicals: Powerful impulsive rally, achieving 1.618 Fib extension of Wave 1.
🧠 SMC: Clear Break of Structure (BoS) in early 2000s; institutions led the markup.
📊 Fib: Ideal third-wave behavior — extended and directional.
📈 Macro: China-led supercycle, supply bottlenecks, geopolitical conflict, and a commodities renaissance pushed oil to $147.27.
🔹 Wave 4 – Still In Progress (2008–2026 est.)
🔄 Technicals: Long, complex W-X-Y-X-Z or potential triangle; entering final E-leg now.
🧠 SMC: Liquidity grabs during COVID (2020) and 2022–24 highs; Smart Money sweeping both ends.
📊 Fib: Final leg projected to terminate near 0.5 retracement of Wave 3 (~$47.55).
🔍 Price Action: Distribution in 2011–14, liquidation in 2020, false rallies, and compression since 2022.
🧨 Macro: GFC aftermath, shale oversupply, COVID demand crash, ESG underinvestment. Currently driven by energy policy chaos and geopolitical rebalancing.
⏳ Wave 4 is near completion , with the final move expected to tag the 0.5 retracement before reversal.
🔹 Wave 5 – Upcoming Macro Breakout (2026–2032 est.)
⚡ Technicals: Expected impulsive breakout wave toward price discovery.
🧠 SMC: Anticipate Break of Structure (BoS) above $147 for confirmation of markup phase.
📊 Fib: Target zone between previous high ($147) and 2.618 extension (~$366.58).
🔥 Macro: Long-term underinvestment, peak cheap oil, geopolitical tension (Russia, Middle East), energy transition bottlenecks. Inflation & policy shifts will add fuel.
📍 This is the final leg of the cycle and could mirror or even exceed the explosiveness of Wave 3 due to multi-decade supply-demand imbalances.
✅ Final Summary
Crude Oil is completing its Wave 4 correctio n, expected to bottom around $47.55 — the 0.5 retracement of Wave 3 . The corrective structure is nearly exhausted, showing signs of Smart Money accumulation and multi-leg exhaustion. Once Wave 4 completes, a powerful Wave 5 is expected to begin, targeting $195–$366 , driven by macro energy scarcity, inflation, and long-term capital flow back into commodities.
This is a strategic inflection zone — where technical compression meets macro ignition.
"Master the waves, follow the smart money, and let Fibonacci guide your path to consistent trading success." — FIBCOS
#WTICrudeOil #ElliottWave #Fibonacci #SmartMoneyConcepts #WaveTheory #TechnicalAnalysis #TradingStrategy #OilTrading #CommodityAnalysis #MarketCycles #PriceAction

XTI/USD Chart Analysis: Oil Price Falls Below $60XTI/USD Chart Analysis: Oil Price Falls Below $60
Friday’s comments from President Trump about the potential introduction of 100% tariffs on trade with China pushed WTI crude oil below the $60 level for the first time in four months. The bearish sentiment stemmed from fears of a global economic slowdown amid escalating trade tensions between the world’s two largest economies.
The decline was further supported by news of peace efforts in the Middle East, which reduced the impact of geopolitical risk on oil prices.
As the XTI/USD chart shows, WTI is currently trading below $60. How might the situation unfold next?
Technical Analysis of the XTI/USD Chart
In the long-term view, oil price movements (following the flare-up in the Middle East in June) have formed a descending channel shown in red — notably, the current price has fallen below its lower boundary.
In the shorter term, we can observe an acceleration of the decline, emphasised by the purple trajectory lines.
These observations suggest that selling pressure remains dominant, while any recovery attempts are likely to meet resistance near:
→ the psychological level of $60;
→ the lower boundary of the red channel;
→ the purple median line.
Given that the White House is reportedly in favour of lower oil prices (as a means of stimulating the US economy and exerting pressure on geopolitical rivals), WTI crude could drift towards the year’s low around $55.
However, from the demand-side perspective, it cannot be ruled out that the oil market, known for its false breakouts above previous highs (A, B, C), may repeat a similar move above peak D — a pattern that, in Smart Money Concept terms, would represent a liquidity grab.
This article represents the opinion of the Companies operating under the FXOpen brand only. It is not to be construed as an offer, solicitation, or recommendation with respect to products and services provided by the Companies operating under the FXOpen brand, nor is it to be considered financial advice.

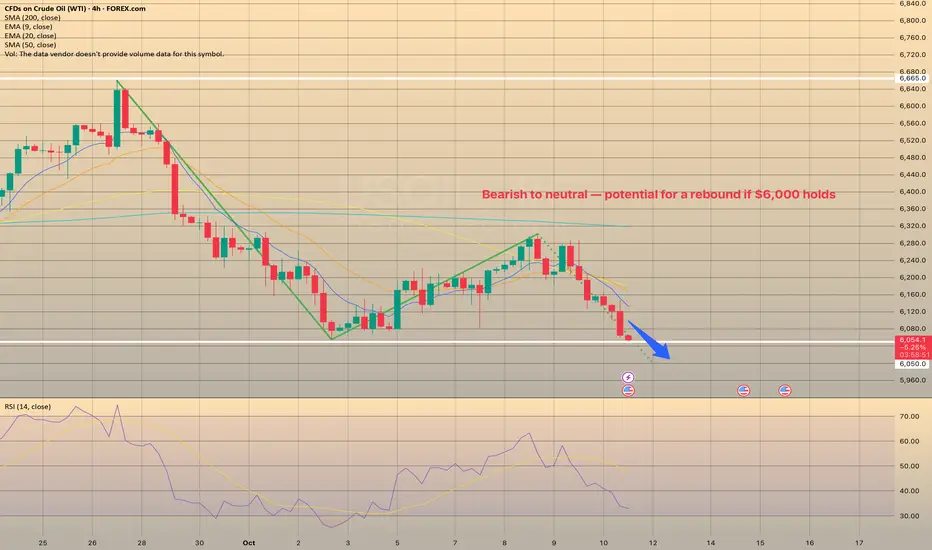
Oil Market: Bearish to neutral — potential for a rebound if $6,0Oil Market: Bearish to neutral — potential for a rebound if $6,000 holds
Crude and gasoline prices fell on Oct. 9 as market sentiment shifted amid rising supply expectations.
OPEC+ agreed to raise output by 137,000 bpd starting November, well below expectations of a 500,000 bpd hike. The group continues to unwind earlier cuts, aiming to restore 1.66 million bpd of production by year-end. OPEC’s September output rose 400,000 bpd to 29.05 million bpd, a 2.5-year high.
On Oct. 10 supply concerns eased after Israel accepted a U.S.-brokered cease-fire deal in Gaza, reducing geopolitical risk premiums. Still, new U.S. sanctions on Iran—targeting over 50 entities linked to oil and LPG trade—helped limit further losses.
Russian supply disruptions remain a supportive factor after drone attacks forced shutdowns at key refineries, while floating storage volumes fell 7% week-on-week to 82.8 million barrels, signaling tighter near-term supply.
Meanwhile, Iraq’s plan to resume Kurdish exports (up to 500,000 bpd) could weigh on prices, offsetting some of the geopolitical support.
EIA data showed U.S. crude inventories 4.5% below the 5-year average, with production up 0.9% w/w to 13.63 million bpd, near record highs. Active U.S. oil rigs slipped by two to 422, just above the four-year low.
Outlook:
Crude oil continues to display a bearish short-term structure, extending its recent downtrend after failing to sustain above the $6,300–$6,350 resistance zone. The price has now revisited the local support area around $6,050–$6,000, which has acted as a key pivot level in recent sessions.
ANZ Research expects near-term downside risks amid higher OPEC+ supply and weaker refinery demand, though low stockpiles outside China may cushion prices into 2026.
A clean rebound from $6,000 could trigger a short-covering move toward $6,200–$6,300.
CRUDE OIL REBOUND AHEAD|LONG|
✅WTI OIL has tapped into the demand level after a sharp decline, showing signs of accumulation. A reaction from this discount area could drive price higher toward 61.10$, where liquidity above minor highs is resting. Time Frame 2H.
LONG🚀
✅Like and subscribe to never miss a new idea!✅

BUY USOILOur trade today on USOIL is bullish, you can buy following the same levles as mine.
We bought after that the market did a liquidity sweep and gave us a reversal.
Follow for more!
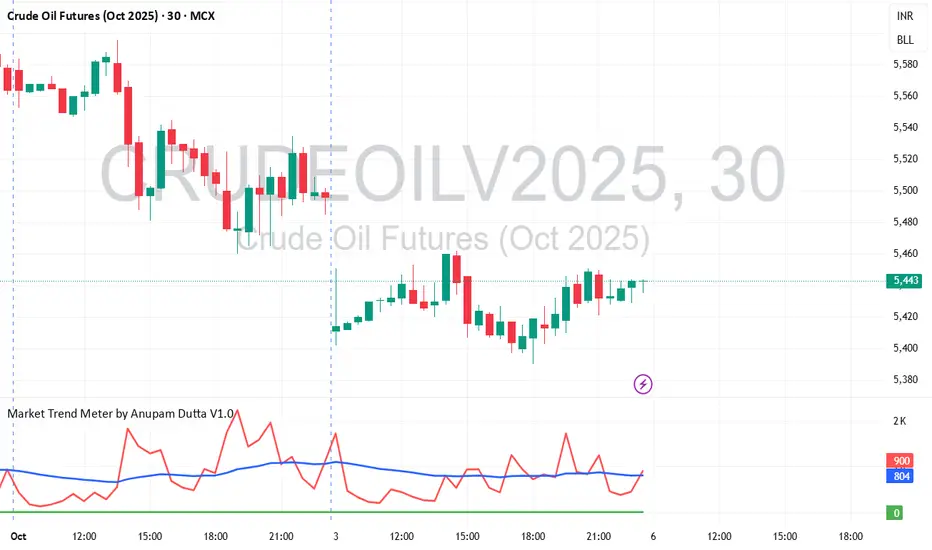
MCX Crude Oil Options (16th Oct Expiry)MCX Crude Oil Options (16th Oct Expiry)
Buy 5400 Call option only if price breaks above 188.60
Target: 208.60
Trade must activate tomorrow (6th Oct 2025), else the view is canceled.
Once activated, target remains valid till 15th Oct session.
📌 Disclaimer: This is a directional view, not a recommendation. Do your own analysis before taking any position.
#crudeoil
Market Analysis: WTI Crude Oil StrugglesMarket Analysis: WTI Crude Oil Struggles
Crude oil is recovering and might rise toward the $63.20 resistance zone.
Important Takeaways for WTI Crude Oil Price Analysis Today
- WTI Crude oil is recovering losses and trading above $61.20.
- There is a short-term rising channel in place with support at $61.20 on the hourly chart of XTI/USD.
WTI Crude Oil Price Technical Analysis
On the hourly chart of WTI Crude Oil, the price found support near $60.25 against the US Dollar. The price formed a base and started a recovery wave above $60.80 and the 50-hour simple moving average.
The bulls were able to push the price above the 23.6% Fib retracement level of the downward move from the $66.16 swing high to the $60.26 swing low. The hourly RSI is above the 60 level, but the price is struggling near $62.00.
The next hurdle could be $63.20 and the 50% Fib retracement. A clear move above $63.20 could send the price toward $63.90. Any more gains might open the doors for a test of $64.75.
Conversely, the price might start a fresh decline from $62.00. Immediate support sits near $61.20 and the 50-hour simple moving average. There is also a short-term rising channel in place at $61.20. The key breakdown zone on the WTI crude oil chart might be $60.25.
If there is a downside break, the price might decline toward $58.40. Any more losses might encourage the bears for a push toward $55.00.
This article represents the opinion of the Companies operating under the FXOpen brand only. It is not to be construed as an offer, solicitation, or recommendation with respect to products and services provided by the Companies operating under the FXOpen brand, nor is it to be considered financial advice.

CRUDE OIL Will Keep Falling! Sell!
Hello,Traders!
CRUDE OIL retested the horizontal supply area cleanly and is now forming a pullback, confirming Smart Money’s intent to continue distribution. Liquidity above recent highs is likely absorbed, with price expected to target 60.10$ to rebalance inefficiency and continue bearish flow.Time Frame 3H.
Sell!
Comment and subscribe to help us grow!
Check out other forecasts below too!
Disclosure: I am part of Trade Nation's Influencer program and receive a monthly fee for using their TradingView charts in my analysis.

Key pivot resists followed by breakdown (WTI Crude)Setup
Bearish. Breakdown
Bearish engulfing candle
Failure at key 65.0 pivot
Signal
Looking to sell while price holds below support-turned-resistance at 62.
(Watch for possible intraday fakeout above 62 before daily close lower)
Agree / disagree? Let me know - happy to discuss :)
USOIL WILL GO DOWN|SHORT|
✅WTI OIL Price rejects supply after distribution and forms bearish orderflow, ICT suggests liquidity is being targeted below. Market likely seeks drawdown into 60.00 demand imbalance. Time Frame 4H.
SHORT🔥
✅Like and subscribe to never miss a new idea!✅
