BTCUSDT | 1W – Technical Analysis (Educational)Bitcoin has recently shown a shift in higher-timeframe structure after failing to hold above previous highs. Price swept buy-side liquidity (BSL) and was followed by a strong bearish displacement, indicating potential distribution rather than continuation.
Technical Observations:
Previous bullish structure experienced a market structure shift (MSS)
A clear change of character (CHoCH) is forming after downside displacement
Price reacted from a weekly order block (1W OB) and is now trading below key structure
The current move appears corrective within a broader bearish context
Lower weekly imbalance / FVG remains unmitigated below
Outlook:
If price continues to trade below the marked resistance zone, further downside toward lower liquidity and imbalance areas remains a valid scenario. Sustained acceptance back above the weekly supply zone would weaken this bearish view.
This chart reflects a technical perspective only, based on market structure, liquidity, and higher-timeframe price behavior.
Crypotocurrency

BMNR HIGH PROBABILITY LONG SETUP SOON!!!!🚨 BMNR HIGH PROBABILITY BUY SETUP 🚨
* Here We Can See Clearly The Next Potential Moves For BMNR Coming Hours/Days.
* Keep Your Eyes Close On Your Trading Positions.
* Happy PIP Hunting Traders.
FXKILLA.

Whats next after the Bitcoin correction In this video I Breakdown a couple of potential Targets for longs .

Bitcoin buy zone approaching really quick LAMBO ZONE SOON AFTERFollowing a nice run early this year we have gone through a period of profit taking/distribution. The fundamentals creating the environment for such a nice run up haven't changed much, however there will be a new catalyst towards the end of this summer that will create an environment for a HUGE Bitcoin run above £100k. It's all going to be closely related with COVID and further QE.
Why $25,000 is the buy zone?
Simple maths
ATH - $65,000
Golden Fib - 0.618
$65,000 * Golden FIb = $40,000
$65,000 - $40,000 = $25,000
Major resistance?
$80k
$105k
And then obviously the LAMBO ZONE

SOL beginning to set? Elliott WaveIf you find this information inspiring/helpful, please consider a boost and follow! Any questions or comments, please leave a comment! Also, check out the links in my signature to get to know me better!
Getting a deeper retrace, which will hopefully lead to some #Elliottwave clarity of count degree wise.
Some areas I am looking for a reaction at.
Below $40, sus for this count.

KEY Falling wedgeKEY UPDATE: KEY created falling wedge on 4hrs TF…I’m waiting for breakout from the resistance on 1hr TF and take a long with it….
Always follow for more alts update
KLong


BTC bearish Signwe broke our ascending line, which show a bear control, we need to hold above the 20k$+ to have reversal and a correction to the bullish momentum once we break the 25k$+.
if we dont hold above the support 20K$, we going to see the lowest $ of the year above the 13k$.

Bitcoin (BTC) next move ?We have seen some downside volatility from BTC today, but this is just consolidation between 21-week EMA and 50-week EMA.
This is the second time we've seen this with BTC PA this year. We can see what BTC did once it broke out of the consolidation in July.
This two weekly EMA's are main bullish indicators.
The second support is the diagonal thats is marked green from which BTC broke out in October and is now been retested as support.
The current price action is neutral on the weekly, or even bullish, but on the low time frames it looks bearish, so you just need to zoom out.
Once BTC breaks above 21-week EMA and retest it successfully, we'll see exponential growth towards $100k IMO.
Patince is needed right now.

BTC BrokeOut Chart In One Day$BTC (Update)
Finally,
BTC BrokeOut At it's Fourth Attempt 🚀🚀🚀🚀
And Reached Around $47600....

Strong S&R at 3234There is strong (but not the strongest) S&R at the 3234-3248 level. We have drawn in a long term fib line that matches pretty close to this level at the moment. The only problem with it is that there is not much back data to go on just a total 7 daily candles have held an S&R at this level.
If we get a break above then look for a continuation to 3K and a stop will mean at return to 2850.x range

XLM On the go to "Down"XlM price is below the 200 EMA and now also under the sell zone of the PMax indicator. It's not wise to long until we see at least a bullish engulfing candle

Do Traders Use Logarithmic Charts? - Bitcoin Stock to FlowI was asked on social media if I use logarithmic charts in my trading. The short answer is "no, not tactically for short term trading" but they do have use in analyzing long term exponentially growing instruments when trying to find patterns. One key use of logarithmic chart analysis is for the Bitcoin Stock to Flow model. This model calculates the price of Bitcoin in relation to its supply and decreasing production.
Link to source: medium.com

$BTC - slow start but an explosive end?When we broke the correction downtrend we retested the downtrending line twice
Usually this would only happen once, indicated low momentum
Once we claimed $34.5 it has been very cleanly upwards
Formed a bullish flat top triangle also, break of this using the measurement method would take us perfectly to the purple line which is the 2.618 fib retracement of the 2017 ATH to 2018 low
I would expect a pretty explosive move from this with resistance at previous ATH
HOWEVER
If we don't claim 38.5K I would fully expect a retest of 34.5K where will then decide are we going towards 45K or towards 26K. So don't get too comfy crypto trading view

sell at 30900-31200 and take profit around 27000-27500 short timSELL #BITCOIN AT 30900 WIHT 3 TP ON THE CHART (21700 decent pullback) he is much overbought in all time frame and indicator + he forming an ascending wedge thar usually price break down on this figure #btcusd #Crypto #cryptocurrencies #Cryptomonnaies #Bitcoin #forexsignal
i do 2 lot
the first lot o will cut at 28500 and take full profit
the 2nc lot when it will reach 28500 i will put hios stop loss at 30 000 like that if he back up before my target i keep profit and no loss.
ON THIS TYPE OF CONFIG WHERE OBERGOUGHT LIKE CRAZY , YES I DO NOT PUL STOP LOSS BUT I NOT HAVE ANY LEVERAGE AND A GOOD CAPITAL BUT I THINK HE CAN DO A KNEE JERK IN THE WORST CASE?INVESTOR ARE NTO CRAZY THEY WANT TAKEZ THEM PROFIT SOON


Bull run coming for ZILLIQA on MACD reversal.Lots of good news has pushed zilliqa in the last few days.
Following this retracement and macd reversal means its time for the bulls to be back!
Get ready for another bull run until 0.024

TRXBTC (TRON) Bullish Technical Analysis Update#TRXBTC TA Update:
Tron current price is 182 Satoshi.
#TRX Looks Good For new Setup but if any 1 Day Candle close above 190 Sat then Best confirmation for Entry.
Entry: 176-182 Sat
Targets: 274/348 Sat
SL: if any 1 Day candle close bellow 170 Sat them exit.
Please like and follow me for latest crypto updates.
your like = I motivate
Thank you guys

Ascending Wedge PatternPeople have been talking about ascending triangles for a couple of weeks now, but I can't see it. This is the pattern I've been keeping my eye on, though it has admittedly taken longer to develop than originally expected.

STPT/BTC 27% profit done#STPT/BTC TA Update:
finally hit 280 satoshi and 27% profit booked,
#stpt Hit 27% profit as we predicted.
I bought more at dip and Sold 267 Satoshi.
Please like and follow me for latest crypto updates.
Thank you
SLong

STPT/BTC TA Update in small Time Frame#STPT/BTC TA Chart:
#stpt now Looking bullish in short Term.
Bounce back from 50MA Support.
So we can see 20-30% and we can also see new ATH.
Entry: 240-250 Sat.
Targets: 284 / 340 Satoshi.
SL: bellow 230 Sat.
Please like and follow me for latest crypto updates.
Thank you
SLong

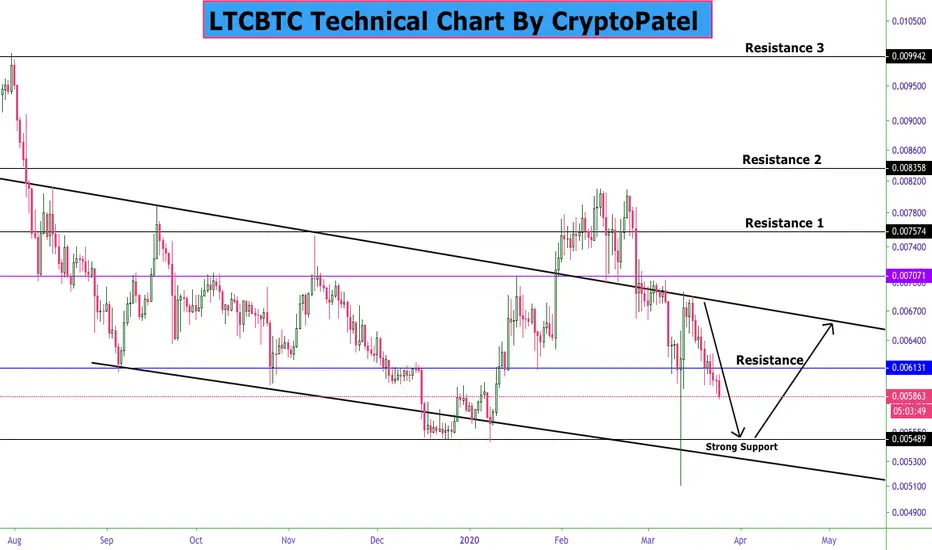
LTCBTC Technical Chart Update#LTCBTC Chart Update:
#LTC still Look bearish.
But we can expect bounce from 0.054-0.055 BTC.
Support: 0.0054/0.0051 BTC
Resistance: 0.0061/0.0071 BTC
Please like and follow me for latest Crypto updates
Thank you
Bitcoin last drop $4000 ..?#BTCUSD Chart Update:
#BTC breakdown 50MA support and we can see last drop.
Support1: $5250
Support2: $4250
Resistance: $6200 (if breakout upward $7749)
So guys be prepare for long entry at dip.
Please like and follow me for latest crypto updates.
Thank you
