ETH XMAS SWING LONGHello dear traders, we have the day before Christmas and volatility is really very low but I believe the Asians can surprise over the holiday nights and end December in the green numbers, let's see how my support zones at $1210 to $1215 will react, if we hold this support we will go up
Crypotrading

REVAIN : TRADE CHARTREVAIN showing since today since some hours ago a trend view that could be interesting for the coming time
Since the full market is into breakdown and stability it is always good to see first some confirmations on any coin.
This is only a view chart, to check if there are confirmations coming on it coming time.
If yes, then it would be interesting.
Most coin markets are not in movement at this moment.
Until now there is no confirmation for long at this coin, but the reason for this view is that this coin able to make confirmation coming time.

BTCUSD Prepare for Long position!Congrats to sellers. Now we are preparing for long position! For me im waiting for little bit drop or spike down a bit for good divergence and will find long. Good luck!

Weekly Momentum On Major Pairs (Week 47/2022)First Thing First: This analysis is for “general overview only” as it is solely based on price action. That’s why it is called momentum analysis in the first place. Support/Resistant, Volume Macro view nor any other factors are not used during write up. Refer to the individual pair analysis for a more comprehensive write up.
XXX/USD: Neutral/Slightly Bullish
Gold & Silver: Slightly Bearish
XXX/JPY: Very Bullish
Stock Indexes: Slightly Bullish
BitCoin: Bearish

DXYmoving as we predicted few days ago
this is what i was trying to explain how accurate price action can be
dxy is key driver of forex and crypto markets

Ada- #ada $ada Important Dear Friends
This is an important analysis for ADA. because the price touched an essential zone.
maybe it'll go up until 20-25%.
if it is not consolidated in the upper zone, it can go down to under 1$.

#btcstarburst A Gann WEEKLY>>THIS Chart has many useful geometric shapes weekly and monthly zoom in and out, you can. All are support and resistance. 25k is are goal. 20,600k is are short term… laser eyes needed… many people have already used these charts around the globe, according to the web.
DCA safely this is a Gann Study be safe… We can go up we don’t have to hit 6k 12k 10k 14k 17k or what ever k… the DXY can crash and BTC can sky rocket or everything can go to $0

CRVInverted head & shoulders pattern in play here, and we are loaded in this coin. (my group) we been buying last 2-3 months.
$4 is only the beginning CRV will do some amazing moves IMO. One of my favorite coins.
And you ain't seen nothing yet IMO.

XRPUSD Aug 2022 W.1: Medium-term trend!Hi friends, I hope y'all had a fantastic weekend ;)
Today, we're looking at a bullish counter-trend signal that's derived on the monthly time frame. If you look at the monthly, you'll see that the price closed with a bullish reversal candle pattern that represents the huge double tops accumulation phase. The patterns neckline was previous bearish broken and not retested together with other key levels. Usually, when the price broke and didn't retest key levels and closes with a reversal candle pattern that faces the targets. it trends or counter-trend to them. With that said, let us take a look at how the bulls and bears will trigger our trade and dis-confirm it.
Bull: -If the price bearish spikes the 50 and 8 m.a's with a bullish reversal candle that's followed by a bullish break and retest of the Mini Weekly Neckline, that would trigger our trade and confirm the monthly's counter-trend signal. I call this type of trade signal a "Double Bottom B-E.2".
Bears: -If the price forms a bearish reversal pattern that leads it to bearish break and retest the 4H Neckline 3 together with the 50 and bearish crossed short-term m.a's, that will dis-confirm our trade, and we'll wait for another set-up.
That's it for today. I hope you found value in this trade idea. If you have a different concept in mind, feel free to share it in the comments section or in private, I'd love to know your thoughts!
Stay Blessed,
Doji.2k1

RSI broke out downside in weekly; waiting for the close.As you can see RSI is breaking downside. Looking at the macro conditions here, BTC can fall to the next strong support at 12k. No one can be sure if that happens or not but seems possible now.
If you see my previous published charts we almost hit the target so I bought 20% of my BTC there. Now, will buy the remaining at around the 12k zone (50%), and then I'll be DCAing just in case the market leads the BTC to go down further, highly unlikely but def. not impossible.

Bears Aren't done yet ETHEREUMHi Traders,
ETH/USD Is showing pretty simple price action today, Yesterday price has tanked and broke out of support with very strong momentum.
I love that the resistance has not been retested as yet which will give me a chance to participate in this move if price pulls back.
Looking at how price has moved before the breakout, we can see that the support of 1735 Has been respected multiple times before it actually broke out. it also created lower highs each time which essentially created a triangle. Now that price broke out of it we can expect a retest and continuation to the downside.
Apart from the technicals, the current state of the global economy has brought lots of uncertainty and many investors are selling out of fear. This could fuel price to tank way more than my current target.
I will go into more depth about the global economy and how we can capitalize on the fear of others in the next few months. For now, let us enjoy the fact that we can make money in good and bad times.
Have a great weekend and keep pushing to get better.
Renaldo Philander

Bitcoin Market update#Bitcoin has been ranging from the last few days between $31.3k - 28k, if we flip the above resistance zone of 31.3k - 30.5k level, we could see #Btc price head towards 34.1-35k zone and possibly continue towards 37.5k - 40k. This zone is likely to act as major resistance since its untouched supply on the daily and could predict a lot of sell order flow coming in from trapped and fresh traders.Hence pushing price aggressively down to $25k and below.
The other scenario is if we break 28.9k - 28k critical support zone, #Bitcoin could fall all the way down to 17k- 20k, which is the next support zone. The chances of this happening is less likely but we need to consider when to be bullish and bearish in the short term in order to get best entry levels while trading.

ALTCOINS Holders should be happy with BTC increase, but when?BTC moves the most crypto markets, and yes, you have here and there sometimes a coin that increases by itself for example depending on high volume, as good news, or new futures or a whale interesting and more reasons.
The title says when? nobody will know 100% when - with data, we can count the chance.
But the main trend will stay that BTC is the coin that has the most support for all coins.
The question can be: we see BTC increase, then after some time it breakdown again, when do we have more chance to stay into the increasing trend?
There is no 100% guarantee in treading, but a price target of 32600 could support the price action to stay positive, so those holding altcoins should hope for this BTC price action. this does not mean a hope that it will happen, but if it hit that price again that BTC can enter into a new range, and with time we will see or we are going to hit this target.
Historical study of BTC did shows that 30K did get before more respected, also known also Elon musk place, so more whales interesting also in 30K, we will see how this time it will play out.
Thanks for reading this small view about BTC, and the important 32600 target.

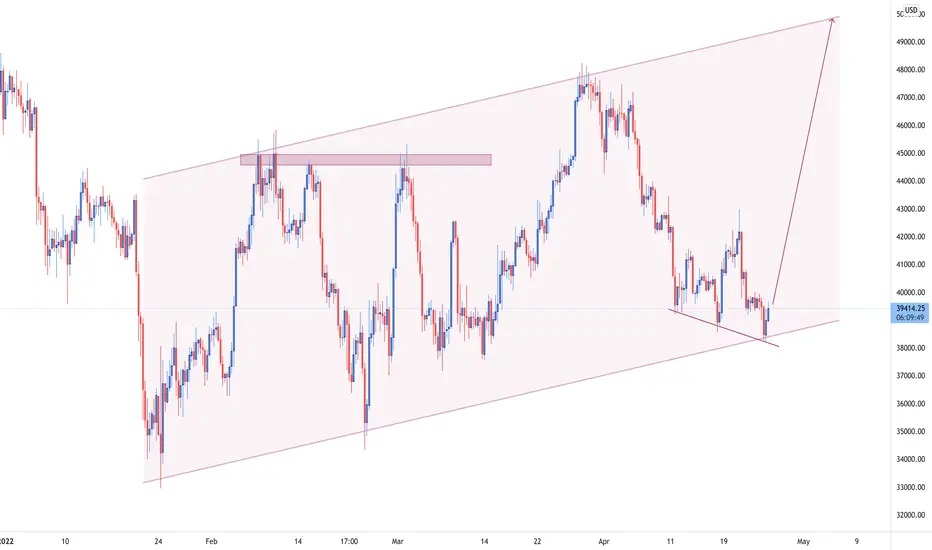
BITCOIN: enough playing games! Time to pumpAs it can be inferred from the BTC/USD chart, the up-trending channel is still holding. The price has managed to drop below the lower boundary of the channel, but now it is once again trading within the borders of it. We are pretty positive that the price will keep rising from now on and we are waiting for more confirmations before launching BUY positions and aiming for the upper boundary of the up-trending range.
Happy new trading week, everyone!
Gold XAU/USD analysisGOLD market is looking quite bullish for upcoming weeks and market is going to make new highs in GOLD this year , wait for right pull back or breakout in Gold
Bias :- Bullishj
Please Like, share and comment

GMT - Potential buying timing!BYBIT:GMTUSDT
4H trend chart
-
GMT is converging and approaching to the downtrend line(resistance) currently.
If price can break out the downtrend line, trading strategy as below.
-
Profit Targets:
a) 2.7093-----Blue horizontal ray
b) 3.1341-----Fib(1)
c) 3.7059~3.9731-----Fib(1.272~1.382)
d) 5.2362-----Fib(2)
Stop losses:
a) 2.0126-----Red horizontal ray
-
If you like this analysis, smash the "like button" and leave a comment below to share your thoughts
or let me know what crypto you want to see!
Trading is a reflection of yourself. Learn more daily and be ready for every opportunity.
Have a nice trading!

BTCUSDT ⬇️ NOT FEELING BULLISH BTC has been in an upward movement for days and now the ascending trendling just got broken and retested below it
🚦 Signal 🚦
BTCUSDT
SHORT
EP: 46300
TP1:45000
TP2:43000
TP3:40000

Victor Cobra's Market Update 3.26.22In this analysis, I try to provide a balanced view of what's happening with Bitcoin, crypto, AMZN, Uranium, and weed. Hope you enjoy! Thanks for watching.
As always, this is meant for speculation and entertainment only - not as financial advice.
-Victor Cobra

Bullish Dogecoin SetupEven trash coins can provide opportunities for us, so don’t laugh. But the crypto market is looking good to me. And if the crypto market runs, Doge will run too. Doge has been grinding lower while MACD is turning up, bullish divergence. This looks ripe for a pop to 0.16-0.17 area which is the breakdown area, the point of control on the volume profile, and also a fibonacci level as well. So i think we can get a 30% move here soon.

Bullish LUNAThis structure is very strong in my personal opinion and i feel this will reach $400 sooner than later.

SHIBA I see an opportunity for shiba for now, on the chart that I have drawn it appears that shiba has the potential to increase with several areas I will write that this
demand area 0.000027 - 0.000029
supply area 0.000037-0.000039
supply area 2
0.000053 - 0.0000055

TS ❕ BTCUSD: sell priority Sell priority remains on the coin and is still expected to approach 35741.35.
SELL scenario: Sell can be planned approximately from the resistance line. Or from the level of 38814.50, which will be a more conservative way.
-----------------------------------------------------------------------------
Remember, there is no place for luck in trading - only strategy!
Thanks for the likes and comments.

SHIB/USD Shiba Inu Token Pitchfork Things are beginning to look interesting... This is the Pitchfork projection with the metrics provided @ this current time/space. The Crypto market has had a correction that should have cleaned things up. It is Good to keep the Weeds out of the Garden...
