BTC pennant updateAn update to my previous post...
Adjusting the support line slightly (the added blue line) the chart can be seen as already having broken out of a pennant.
After the initial breakdown, it retested the support as resistance and failed. It then dropped 1.80% within the hour.
In hindsight, it seems like a textbook pennant. In my previous post where I had a larger pennant (yellow line), I don't think it was based on enough data points (only 2 for the support). Whereas the green line has 3 points of contact.
Of course, it should not be ignored that BTC is currently still in the larger pennant that I originally drew. The brief breakdown seen in the chart may be seen as a fakeout in the future before we pump and reach targets around 42k.
Else there is still the possibility of breaking down to 38k. And the fakeout was simply bought up with some buying pressure before the real drop comes.
I guess time will tell which way it will go...
Let me know what you think below :)
Crypto-analysis

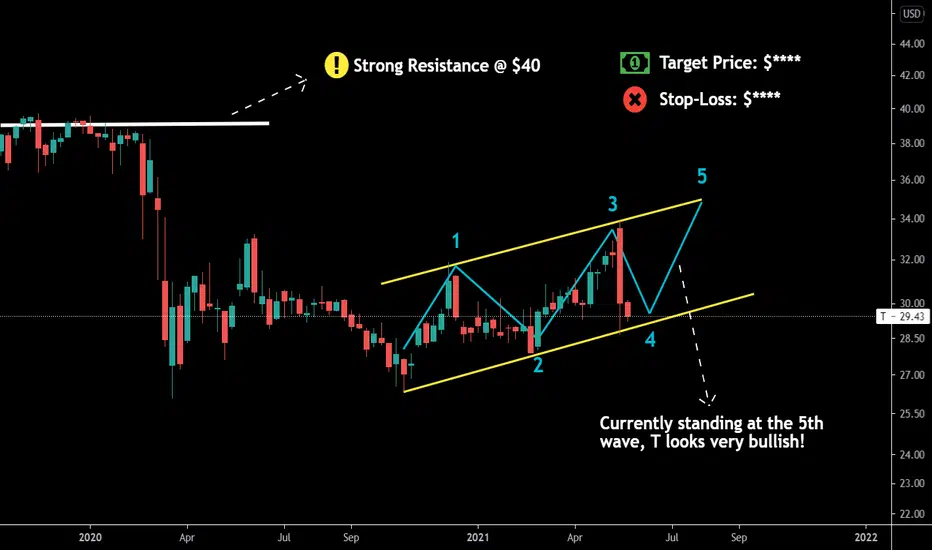
AT&T - Standing on the 5th Wave! 🌊-Being a defense stock, AT&T is especially safe for today's market as the volatility and tech's slumped movement continues.
-We keep a bullish buy on T stock!
ZRX - 0x Price Idee and targetAfter the previous analysis which has been invalidated by BTC retracement we have a new bullish setup, let s recap the analysis:
Rsi- pretty good, arround the middle leaving space for ZRX for growing
MACD - Golden cross forming on 4H chart
3 higher highs follower by 3 higest lows confirming the bullish channel
Fibbonacci - just closed 2 candels above the 0.50 zone leaving space for the new target at 0.618 zone
Targets: 1.97 short term, probly gonna see ZRX at 2$ tomorrow 12/05
In the middle term the target for me is going to be 2.30$ then if by the end of the month we can consolidate above 2$ zone we might see a new ATH very soon

TrendyTrades: XRP May 2nd Analysis XRP has show some significant growth in the last few months. Looking at where it is today, I've analyzed a few key hourly and daily levels; along with some predominant Supply and Demand zones. I can see one of two different scenarios playing out here, first being that price breaks lower passed the Supply turned Demand area and into a 3HR Demand that hasn't been used yet at around: 1.3978 which is also confluent with a 1-Hour key level . If it reaches there, I can see a nice bounce up back into the supply zone around 1.6660, breaking it and reaching the next Supply zone at 1.7473 which is also confluent with a 1-Hour key level .
Second scenario is displayed using the dotted line, please refer to the chart for direction. BINANCE:XRPUSDT

EURAUD - FOREX - 25 April 2021This is my Euro / Australian Dollar Technical Analysis.
so in this case I'm waiting for breakout of pattern and after that if I see any confirmation I'll enter a trade.
In 4h timeframe as you can see price gonna retrace at least to 1.58555 and the next retrace level is 1.60000.
Look at the 4h Timeframe:
Good Luck!
show me some love with following my tradingview page and please don't forget to like ❤️❤️❤️


XLM is ggetting ready for collapsingAs you see the image above, XLM has moved within a impulsive wave. Wave 5 is the ending one and as candlestick pattern shows (Shooting Star) a collapsing may occur. Summary you should be very careful! Divergence probability is obvious and it's a another reason for what I've said.

Ethereum - Long Term Outlook with Potential Buy Zones!Ethereum - Daily Chart
Zoom out for the bigger picture. Crypto investments can offer a great way to diversify your portfolio!
We have identified two potential buy zones on Eth. Lets see if price does dip to one of these levels. Patience is key!
Disclaimer: Crypto investments carry a high level of risk and you should only risk money you can afford to lose!


SFP/BTC - Will the level 0.000042 provoke pumping?Hello everyone, analyzed the SFP/BTC pair
Long fall period
Exit from the triangle. Several retests to the support level.
Target on the chart. Stop loss for your trading system. A close above the level of 0.000042, in my opinion, will provoke an impulse growth. I do not look into the future - I trade wisely, and I wish you the same.


Bear Trap, Don't PanicTook a fractal from the same timing in the previous bull run. We may go to 28k at the lowest, but it will be followed by a violent swing past the all time highs. It might be worth DCAing into a position as we go lower.

Bitcoin Meets Powerful Resistances, to the moon or to the mud! Hello traders! You may be wondering... why can't Bitcoin break $40k so easily like the previous resistances? Today, I will explain with an analysis of why.
Let's look at the diagram above. If we notice, there is strong resistance, the red dashed line, and the Fibonacci line. This may explain why it was so difficult to penetrate the $40k levels. Just look at the daily chart:
Wow, tough. But it doesn't end there. IF we look at the RSI in the chart, we just bumped all-time high resistance! This makes the resistances at $40k even more powerful! Oversold RSI makes it scary...
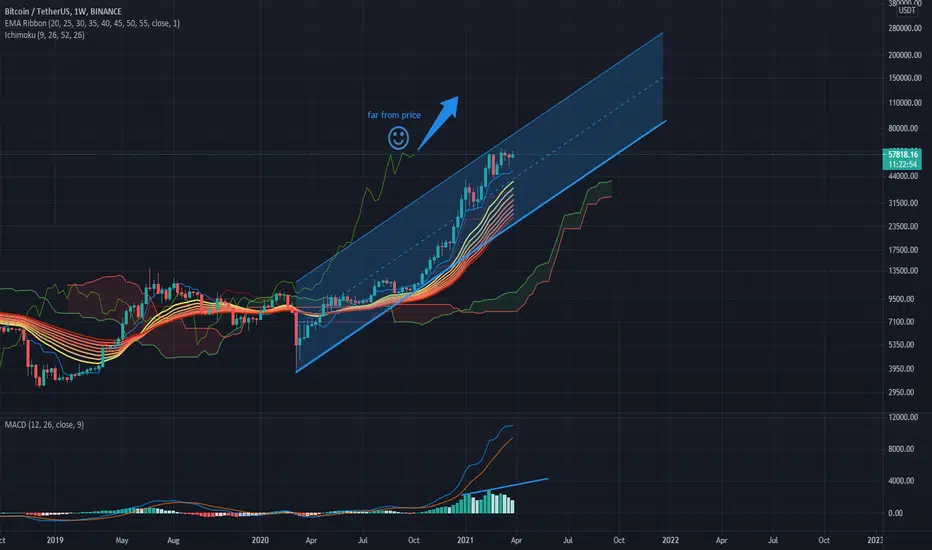
We don't end it here. The last time Bitcoin had a rally from the lower channel to the middle channel line, it miserably failed. Just look:
Will we have the same thing happen? We have some support that the same thing may happen:
1. 5-wave Elliot, trend completed according to this evidence
The image explains itself. Yikes!
2. Divergence Patterns, head and shoulders in Stochastics
Image explains itself. 1 image = 1000 words
3. Parabolic Increase with both 300% increase
Image explains itself again. 100 words = blurry images
These factors increase the chance that we go to the floor, not the ceiling. What do you think? Tell me in the comments below!
Based on these present-and-past facts, we can't decide just YET. It is a do or die, folks, and a matter of price and time. Good luck!
Do not forget to click that like and follow buttons! Cheers!

BTC Dip - Buy opportunityBTC is clearly not making a double top, if anyone thought so.
It's a perfect level to accumulate more

540 up and 400 down - BTCUSD nice moves....A nice run on BTCUSD trends.
We will soon be upping our ideas again, once our optimisation testing is complete.
If you have any questions, feel free to drop me a DM.
Thank you
Darren

Bitcoin Correction Price targets! Live stream this afternoonWe hit our 41,937 price target from December almost on the damn nose!
Clear bearish divergence at the 40,700 rejection yesterday.
I tried to take a couple small positions as we came down but the momentum just kept going. We had a lot of support at 32,300 but have found ourselves bouncing off the 30k handle.
I do not fully trust this is the bottom, but i dont think its the range we will start finding support in either. I think we MAY see a flash move down to lower areas where buy orders will be hit, resulting in a swift momentum to the upside. I dont really have a time frame but ive set up orders for when it happens
We are printing hidden bullish divergence on the MACD hourly chart, but im not sure if the momentum is strong enough to pull us back up higher than 33178 short term
That would be an area id watch for a reversal back to the downside. If we break the heartline support trend, and 30k support we could fill a futures gap as low as 25-26
I dont believe we will stay in that range but if you have cash on the side and want to do some averaging, id consider setting up a limit order for some lower levels
If we continue to the upside from here, i will be a buyer above 34500 if we get solid confirmation of support but im focused mainly on trying to land a nice lower position
29500
28500
27500
and a big one in at 26500

DO NOT SELL BITCOIN BEFORE WATCHING THIS!Hello everyone, if you like the idea, do not forget to support with a like and follow.
Here is the top-down analysis for BTCUSD, feel free to request any pair/instrument or ask any questions in the comment section below.
Best of luck!

NEO in HS pattern around neckline.This crypto currency is reaching point of control for bottom in March at 1D chart.
I personally not buying. But it will be interresting to wach, how this pattern figure out.
Beam indicator is green and volume tightening so breakout is near.
However, if NEO fall below lower blue rising line, I expect this asset below 10usd ( HS target ).
This HS is officialy broken. Conclusion probably come next week with Bitcoin direction.
Let's see what happen.
*This is not a financial advice.

Monero to $133.Monero - Short term
We look to Sell at 133.4 (stop at 136.1)
147.4 has been pivotal.
Bespoke resistance is located at 134.0.
We look to sell rallies.
The RSI is trending lower. Our outlook is bearish.
Our profit targets will be 124.8 and 118.4
Resistance: 126.0 / 129.0 / 133.0
Support: 124.0 / 121.0 / 117.5

bitcoin continuedstill respecting our levels, look to buy as dollar continues to fall on stimulation to inflate us stocks anything /usd is going bullish

BTC - Must Read Analysis !Hello traders,
Here is a full breakdown of what I see on the chart and what is likely to come.
everything is explained on the chart clearly and in a simple beginner manner so everybody can understand it.
Share & Like
Monthly:
Weekly:
Daily:
