Silver Breakout From Demand Zone – Eyes on $82 and $87 TargetsSilver has successfully bounced from the marked demand zone and broken out of the falling channel structure. Price is now respecting the ascending channel and building bullish momentum. As long as price holds above the breakout level, upside continuation remains likely.
The first bullish target is $82.49, followed by the second target at $87.18 if momentum extends. Watch the channel support for continuation or potential pullback entries.
This setup highlights clean market structure: breakout → retest → bullish trend development.
Crypto

$AVAX Warning: Big Mountain Ranges = BIG Crevices!Why the MountainBears are Growling
The "Mountains of Avalanche" is looking shaky.
Avalanche by name.
Avalanche by nature?
While the bulls are trying to hold the line, the chart is printing a Head and Shoulders pattern that looks like a final warning for Q1 2026 before breakdown (maybe q2)
Negative Momentum: The MACD histogram on longer timeframes is showing weak momentum, and the RSI is hovering in a neutral-to-bearish zone near 38–42, suggesting sellers are slowly taking control.
Institutional Caution: Despite ETF rumors earlier in the month, the current market structure favors caution over aggressive long positions until major resistance at $16.55 is cleared.
Supply Hangover: A massive token unlock (9.5 million AVAX) is on the horizon, which could dump $240 million of fresh supply onto an already shaky market.
#AVAX #Avalanche #HeadAndShoulders #CryptoWarning #TechnicalAnalysis

Long Dimon, Short Corn: $XLF vs. $BTC🏛️🏛️🏛️🏛️🏛️
🌽🌽🌽🌽🌽
Banks make profits
Banks can innovate and adopt new technologies
Bitcoin core devs can't.
Goal: Capture the capital flight from the meme of decentralised money and the central bank disruptor, back to the money centers of the US empire.
I believe a retest of December 2017 is on deck.
#XLF #BTC #Bitcoin #Corn #MacroTrade

Expecting a move from bearish OB on XAUSDWe can expect those below liquidity levels as our targets.
Lets see how it goes.

BTC - The Last Standing Checkpoint!This blue zone is the line in the sand.
Right now, BTC is sitting at a critical checkpoint, where multiple reactions already took place. As long as this blue demand zone holds, the plan remains simple:
👉 Look for longs, in line with a potential continuation toward the upper bound of the structure.
However, this level matters a lot.
If price loses this blue zone and breaks down, that would signal a clear shift in control, and the bears would take over entirely, opening the door for much deeper downside.
⚠️ Disclaimer: This is not financial advice. Always do your own research and manage risk properly.
📚 Stick to your trading plan regarding entries, risk, and management.
Good luck! 🍀
All Strategies Are Good; If Managed Properly!
~Richard Nasr

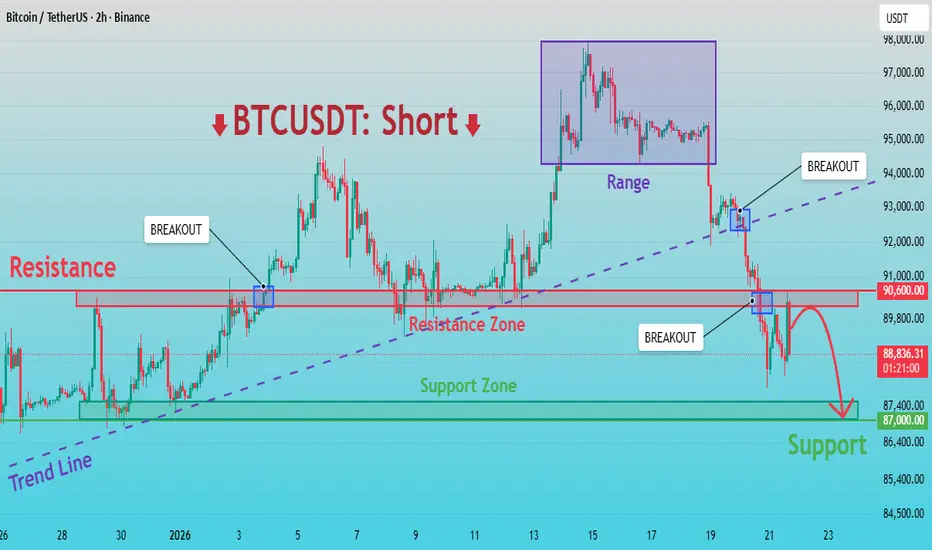
BTCUSDT: Breakdown Confirmed – Sellers in Control, Target to 87KHello everyone, here is my breakdown of the current BTCUSDT setup.
Market Analysis
BTCUSDT previously traded within a bullish structure, supported by a well-defined ascending trend line that reflected strong buyer control. After an impulsive upward move, price formed a consolidation range near the highs, indicating a temporary balance between buyers and sellers. Eventually, BTC failed to continue higher and broke down from the range, which became the first sign of weakening bullish momentum. This was followed by a decisive break below the ascending trend line, confirming a structural shift in favor of sellers. Subsequent recovery attempts were capped by a clearly defined Resistance Zone around 90,600, where multiple breakout attempts failed, signaling strong selling pressure.
Currently, BTCUSDT is trading below the resistance zone, forming lower highs and maintaining a bearish market structure. Upward moves appear corrective rather than impulsive, reinforcing seller dominance. Below the current price, a Support Zone near 87,000 stands as the next key area where buyers may attempt to slow the decline.
My Scenario & Strategy
My primary scenario remains bearish as long as BTCUSDT stays below the 90,600 resistance zone and does not reclaim the broken trend line. Any pullbacks into resistance that show rejection may be considered potential short opportunities. The main downside target is the 87,000 support zone, where price could react or temporarily consolidate.
However, a clean break and sustained acceptance above 90,600 would invalidate the bearish bias and suggest a possible transition back into consolidation or recovery. For now, market structure and momentum clearly favor sellers.
That's the setup I'm tracking. Thank you for your attention, and always manage your risk.
Why Does Bitcoin Often Top When Everyone Is Bullish?In the Bitcoin market, there is a familiar paradox:
The more people believe price will keep going up, the closer the market often is to a top.
This isn’t superstition or coincidence.
It’s the result of capital flow, crowd psychology, and how markets truly work.
1. When Everyone Is Bullish, New Buyers Are Running Out
Price can only continue to rise if there are new buyers willing to pay higher prices.
But when:
- Positive news is everywhere
- Social media is full of higher price targets
- “Buy the dip” becomes automatic
→ Most of the available capital is already in the market.
At this stage:
- Those who wanted to buy → already bought
- Those who haven’t → either lack capital or are unwilling to chase price
Demand weakens, while supply quietly starts to appear.
2. Smart Money Doesn’t Buy When Optimism Is Extreme
Large institutions don’t accumulate Bitcoin when:
- News is overwhelmingly positive
- Retail traders are FOMOing
- Price is far from its accumulation zone
Instead, they tend to:
- Buy during doubt
- Dustribute during certainty
When the crowd turns aggressively bullish, it often signals:
Smart money is reducing exposure, not adding to it.
3. Extreme Bullishness Creates Psychological Imbalance
Near market tops, you often see:
- No bearish scenarios considered
- Anyone questioning the trend labeled as “FUD”
- Stop losses ignored in the name of “conviction”
This is a psychological imbalance:
- Expectations are stretched
- Risk is underestimated
At this point, the market doesn’t need bad news.
A lack of new buyers is enough to trigger a correction.
4. Tops Form Quietly, Not in Panic
Many believe a top must come with a violent crash.
In reality:
- Tops often form through choppy price action and slowing momentum
- Volume fades
- Breakouts repeatedly fail
This is when:
Confidence remains high, but underlying strength is already weakening.
5. The Key Lesson for Traders
- Tops don’t form when the market is fearful
- They form when risk is ignored and confidence becomes one-sided
Understanding this helps you:
- Avoid FOMO when everyone is bullish
- Stay cautious when “everyone is right”
- Realize that market psychology matters as much as technical analysis
Final Thoughts
Bitcoin doesn’t top because too many people are bullish.
It tops because when everyone is bullish, the market runs out of fuel.
In trading:
The crowd is usually right in the middle of a trend — and wrong at turning points.
Keeping a calm, rational mindset while others are euphoric
is the true edge of a mature trader.

Canary Litecoin ETF | LTCC | Long at $16.90Litecoin's price has returned nearly to my original $65 entry in 2024 . With Litecoin's halving scheduled in 2027, I am bullish long-term. Short-term could be volatile. Instead of the coin, I'm going into the ETF at $16.90 for less fees and easier management.
Targets into 2029
$21.00 (+24.3%)
$25.50 (+50.9%)

Bitcoin running to 290k or 440k this year *Updated/Fixed*This chart fixes the accidental shifted long term uptrends in my previous chart. Since Greenland/tariff fears broke through the latest short term uptrend yesterday we now have a new short term uptrend off the tap on the long term trend. This is pretty common and doesn't necessarily void the old uptrend as it can still, and likely will, jump back above it.
I just want to reiterate how rare these hits of the long term trend are as Bitcoin usually accelerates the trend by a lot, which is why people grow to expect dramatic corrections back to the mean. The last 3 years of Bitcoin have been very similar to 2015-late 2016 where the market didn't have any large exponential growth moves and that's why the corrections have been tempered.
Currently, bitcoin is setting up for the largest draw down of Bitcoins on the exchanges that we've ever seen. This in the past has happened proceeding late 2017 and late 2020 bubbles, the difference here is the scale of Bitcoins removed from exchanges has been massive (500K+) since April 2024 and accelerating significantly in the last 6 months, since September last year (200K+). For the first time in Bitcoin's history the amount of Bitcoins on the exchanges has been consistently falling ever since November 2022. Betting on Bitcoin falling from here is really not a great bet.
Good luck everyone!

BTCUSDT Long: Rising Trend Line and Demand Supports Bullish BiasHello traders! Here’s a clear technical breakdown of BTCUSDT (2H) based on the current chart structure. Bitcoin is trading within a developing bullish structure after forming a clear pivot low, from which a rising trend line has been established. This trend line reflects increasing buyer participation and gradual strength returning to the market. Following the pivot, price moved higher and transitioned from consolidation into an impulsive bullish leg, confirming a structural shift. After the upside move, BTC reached a clearly defined Supply zone around 94,500, where selling pressure stepped in. This reaction led to a range formation just below supply, indicating temporary consolidation after the impulsive rally. This range reflects short-term equilibrium rather than a trend reversal, as price remains structurally supported.
Currently, BTC is reacting from a strong Demand zone around 91,900, which aligns closely with the rising trend line. This confluence between horizontal demand and dynamic support strengthens the level. The recent pullback into demand appears corrective rather than impulsive, suggesting that sellers are losing momentum and buyers continue to defend structure.
My scenario: as long as BTCUSDT holds above the 91,900 demand zone and respects the ascending trend line, the market structure remains bullish. A sustained reaction from demand could lead to another attempt toward the 94,500 supply zone, and a confirmed breakout above this level would open the door for further upside continuation. A decisive breakdown and acceptance below demand would invalidate the bullish bias and shift focus toward deeper corrective levels. For now, price remains compressed between demand and supply, with buyers maintaining structural control. Manage your risk!

NZDJPY NEXT MOVENZDJPY is showing a strong bullish continuation after reclaiming and holding above a key demand and resistance flip zone, confirming a market structure shift in favor of buyers. The impulsive move higher followed by shallow consolidation signals healthy momentum and sustained buying interest, often seen before another expansion leg. From a fundamental perspective, the New Zealand dollar remains supported by relatively resilient economic outlook and carry trade demand, while the Japanese yen continues to weaken due to accommodative monetary policy, low yield environment, and persistent divergence against higher-yielding currencies. As long as price maintains above the breakout zone and continues to print higher highs and higher lows, the probability favors further upside continuation, making pullbacks into structure attractive for trend-following long opportunities with momentum, liquidity flow, and macro bias aligned for profit potential.

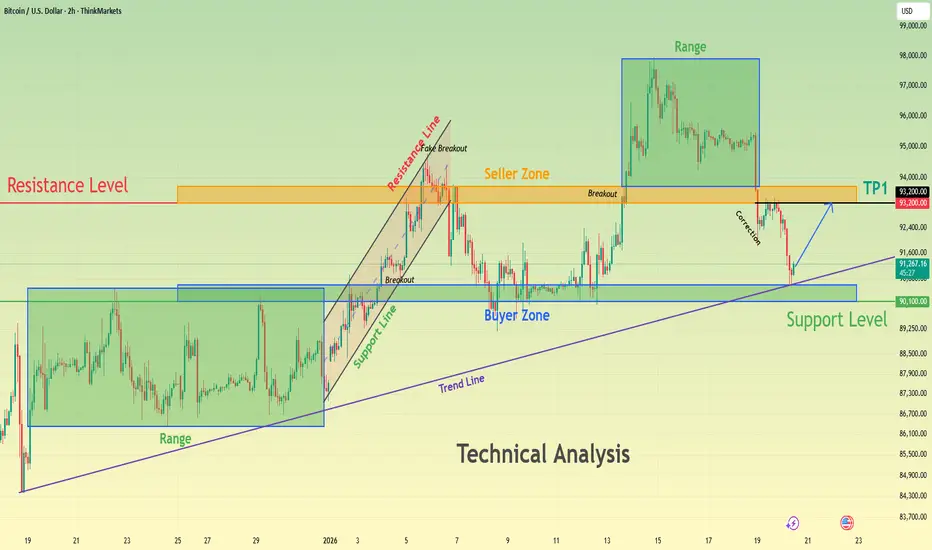
BTCUSD Holds Above Demand - Next Move Toward 93,200 ResistanceHello traders! Here’s my technical outlook on BTCUSD (2H) based on the current chart structure. Bitcoin is trading within a clear bullish environment after transitioning from a prolonged consolidation phase into an impulsive upward move. Earlier on the chart, price was moving inside a well-defined range, indicating balance between buyers and sellers and a period of accumulation. This range was eventually resolved to the upside, confirming a shift in market control in favor of buyers. Following the breakout, BTCUSD accelerated higher and successfully established acceptance above the former range highs. Currently, price is trading above the Support Level around the 90,100 area, which aligns with a clearly defined Buyer Zone and a previous structural level. This area is now acting as a key demand zone after the breakout and is reinforced by the rising trend line, strengthening its importance. The recent pullback into this support appears corrective rather than impulsive, suggesting healthy profit-taking instead of aggressive selling pressure. Buyers are actively defending this zone, keeping the bullish structure intact as long as price remains above support. If buyers continue to defend the 90,100 Buyer Zone, BTCUSD could resume its upward move toward the 93,200 Resistance Level, which serves as the next key objective. A clean continuation and acceptance above this resistance would confirm further upside momentum and open the door for continuation toward higher targets (TP1 and beyond). However, a decisive breakdown and acceptance below the support zone and rising trend line would signal a deeper correction and weaken the bullish setup. For now, the overall structure favors buyers while price respects support. Please share this idea with your friends and click Boost 🚀
ETH/USDT – 4H Chart Update. ETH/USDT – 4H Chart Update
ETH is trading inside a descending broad structure, but the price is now testing a strong demand + trendline support zone.
The current dip looks like a liquidity sweep / stop-hunt into support rather than a trend breakdown.
Price is near the lower rising trendline + horizontal demand high reaction area.
Immediate Support: 2,900 – 2,880
Major Support: 2,780 2,680
Invalidation: Below 2,650 (structure weakness)
Resistance: 3,200 – 3,300
Major Supply: 3,450 – 3,500
Expected Scenario (as marked):
Hold above 2.88K–2.9K base formation → strong bounce
Upside targets: 3.1K 3.3K 3.5K
If support fails deeper pullback toward 2.78K, 2.68K
Neutral-to-bullish as long as demand holds. Patience is key here—reaction at support will decide the next leg.
Not financial advice. Trade with risk management.

Why Does BTC Often Move Strongly During the U.S. Session?Not by coincidence — but because real money enters the market
If you’ve traded BTC long enough, you’ve probably noticed a familiar pattern:
Asian session: slow price action, compression, sideways
European session: increased volatility, trap-building
U.S. session: BTC makes the real move
So the question is:
👉 Why does BTC usually show its strongest volatility during the U.S. session?
1. The Largest Capital Flows Enter During the U.S. Session
The U.S. session is when:
U.S. banks
Hedge funds
Prop desks
Institutional traders
U.S.-based crypto whales
👉 Start trading aggressively
This is not retail money.
This is institutional capital, trading large size — not scalping a few dozen dollars.
When big money enters → the market must move.
2. The U.S. Session Is When News Gets “Activated”
Most major news that impacts BTC happens during the U.S. session:
CPI, PPI, FOMC
Fed interest rate decisions
DXY and U.S. Treasury yields
U.S. stock market open
👉 All occur during the U.S. session.
BTC doesn’t exist in isolation.
It reacts strongly to:
Risk-on / Risk-off sentiment
USD strength or weakness
Capital flowing into or out of risk assets
3. Highest Liquidity → Structure Breaks More Easily
The U.S. session has:
The highest daily volume
The deepest liquidity
More stable spreads
➡️ This makes it the ideal time to break ranges,
take out highs and lows from the Asian and European sessions.
💡 Many:
True breakouts
Large stop hunts
Strong expansions
👉 Happen at the start or middle of the U.S. session.
4. Europe–U.S. Overlap: BTC’s “Golden Hour”
During the Europe–U.S. overlap:
European traders are still active
U.S. traders are just entering
📌 Liquidity + liquidity = explosive volatility
If BTC has:
Been compressed all day
Accumulated for a long time
Gathered enough liquidity
👉 The U.S. session is often when that energy is released.
5. Retail Traders Get Trapped the Most During the U.S. Session
One hard truth:
Retail traders often FOMO on large candles
Enter when volatility is at its peak
Place stop losses where everyone can see
👉 And that’s also when:
Whales sweep stops
The market shakes violently before moving in the real direction
💡 The U.S. session is not just when BTC moves,
but also when those without a plan get eliminated the fastest.

Cardano Price Analysis: Can ADA Deliver a 2x Move From Here?* ADA is sitting right on a major support zone, and traders are starting to watch closely for any early signs that a reversal could be taking shape.
* The chart makes it clear what needs to happen before a 2x move even becomes realistic, not just hopeful.
* On-chain data and market structure aren’t fully aligned yet, which makes this a setup worth monitoring rather than chasing.
When you zoom out and look at what Cardano has been doing lately, it’s pretty clear the market isn’t panicking, even though the ADA price is still stuck inside a broader downtrend.
The ADA price didn’t slide lower in a slow and gentle way. It dropped back toward the bottom of its descending channel with speed, flushing out late longs and cooling off the optimism that had started building during earlier consolidation. That move forced a reset in expectations. But since then, the tone has started to change a bit.
Instead of continuing to sink without any pauses, ADA has begun to stabilize around the low-to-mid $0.30s. This is the first area where selling pressure has clearly slowed after that drop from the middle of the channel. The price isn’t falling apart anymore, and dips into this zone are getting absorbed faster than before.
After cutting through several support levels on the way down, this is the first place where the market looks willing to slow down instead of accelerating lower. It doesn’t mean the bottom is in, but it does indicate the market is starting to digest the move rather than reacting emotionally to it.
Market cap data backs that up. After peaking near $15.4 billion and sliding toward $13.6 billion, Cardano’s valuation has stopped dropping aggressively and has begun moving sideways. Money isn’t rushing out anymore, even if fresh inflows haven’t shown up yet.
So what comes next for Cardano?
The main challenge is still overhead resistance. The ADA price is repeatedly being held back below the level of $0.3966 on the 4-hour chart, where the 100-period SMA is placed. Each attempt at a rebound has so far not managed to get back above there.
Until ADA can break above that zone and hold it, upside moves are better seen as relief rallies, not real trend reversals. The bigger downtrend stays in control as long as price remains capped there and the descending channel keeps guiding price action.

This Does Not Look Good For Bitcoin!Trading Fam,
Real talk. It does not look good for Bitcoin.
I will not make friends with this post. But I'm not into popularity contest. I simply want to show you what the charts are saying.
My old followers know that I ignored the Head and Shoulders pattern I spotted last cycle. Though, I got a much higher ratio of "likes" on that one post because I continued to believe in hope and hype ...I paid dearly.
I show my wins. And I show my most embarrassing losses. But one thing I will not do is lie.
After all, there is truly no loss if we learn. And so, we will either win here with me OR we will learn.
I learned. And maybe? So did you. I'm tired of paying for expensive lessons. It's time to be cautious and preserve our capital.
Though this Head and Shoulders pattern is not even complete yet, we have to put it on our radar. It's an ominous looking beast. Over 85% of the time, these things do play out. If you're into hopium you might be like, "So you're saying there's still a chance"? Well, yeah. I guess. If you want to look at it that way. Maybe, up to a 15% chance Bitcoin negates this pattern. But let's review a few of the other bearish indicators that have already played out (I have noted these numerous times in previous posts and videos):
Couldn't break above that Pi Cycle Top Trendline. Hit it to the 'T' three times but could not break it.
Wyckoff Market Cycle (previous post) currently playing out.
Megaphone pattern (previous post) played out
Bear Flag broken today (though not yet confirmed)
Below that orange 350-day SMA - almost always indicates entry into a bear cycle
A "SELL" signal from my most reliable indicator, The Pivot Zones Indicator .
And now?
Now, we are forming that very ominous Head and Shoulders pattern. I will not ignore it again. A break below that RED 2021 Top Trendline, which is also acting as the neckline, is not good. It's not good at all.
I'll leave it at that and let the chart do the rest of the talking.
Take care friends,
✌️Stew

Bitcoin's Santa Claus Rally-January ForecastAfter studying historical cycles I have found some striking similarities. I Hope this helps some traders through these uncertain times.
I believe there will be a couple more attempts to break that upper trend line this week before and after Christmas giving up a couple of short-term trading opportunities from current levels.
History has proven that 80% of the time, Bitcoin will post its monthly high within the first 12 days of the month. With that being said, I think we finally breakout of that upper trend line and start an extended rally towards the .382 Fib levels (or higher) by the middle of January before ultimately falling lower and finishing the second half of this bear cycle. (This would also complete the right shoulder of the head and shoulders formation on larger time frame charts)
I am a buyer at 86k levels and a seller above 92k levels until the end of January. Then I am short.
Tell me what you think and I hope this helps some folks that are currently having a hard time finding clarity in this market.
If my ideas are received well and produce positive results, I will continue sharing them in the future. Thank you for your feedback and I hope everyone has a happy holiday season! Merry Christmas and Happy New Year!!!

CTK Prepping for a Monster Move? Breakdown or Breakout Yello Paradisers! Are you about to catch one of the cleanest reversals of the month, or will you watch CTK take off without you?
💎#CTKUSDT is currently forming a textbook falling wedge pattern. The price has now reached the bottom of this wedge and is sitting directly inside the major support zone between 0.2300 and 0.2400. This is the same area where previous reactions triggered strong upside momentum, and once again, buyers seem to be defending it.
💎What makes this setup more interesting is the clear bullish divergence forming on the MACD. While the price has been making lower lows, the indicator is printing higher lows, which shows that bearish momentum is fading. This divergence, combined with the falling wedge support, gives us a strong probability of an upside breakout in the short term.
💎If the wedge breaks to the upside, the next target is the minor resistance level at 0.2813. That’s the first area where profit-taking might occur. But if bulls manage to reclaim that zone, the strong resistance cluster around 0.3673 to 0.3765 becomes the next magnet for price. This area aligns with previous supply zones and volume profile resistance, so it won't be easy to break, but if momentum carries, it could be a major move.
💎On the flip side, if CTK closes below 0.2124, the entire bullish setup is invalidated, and a deeper correction becomes likely. That’s our invalidation zone, lean, clear, and non-negotiable.
Strive for consistency, not quick profits. Treat the market as a businessman, not as a gambler.
MyCryptoParadise
iFeel the success🌴

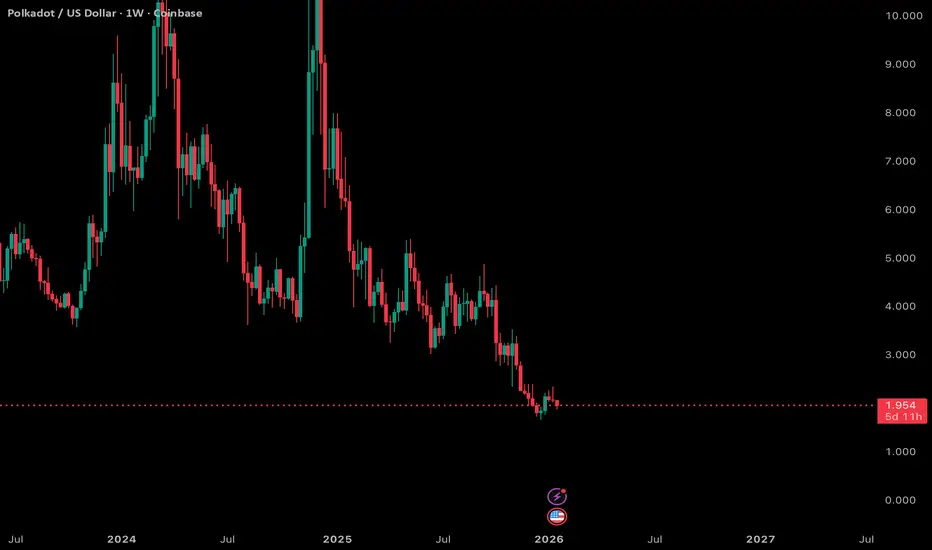
1W Polkadot (DOT): Full updates & thoughts on the chain Technical situation (chart)
On the weekly, DOT is still struggling to show sustainable strength. Price continues to sit near the low end of the range around ~2.0, failing to make meaningful higher highs or clear range expansion. This looks like more consolidation and distribution pressure rather than a clean breakout, and recent candles confirm a bearish tone with lower peaks and no strong follow-through. Price action is choppy and defensive, reflecting weak conviction from buyers.
Regarding upgrades and fundamentals
Polkadot has a long roadmap of structural upgrades that are intended to boost the network’s utility and developer appeal. The ecosystem is transitioning to Polkadot 2.0 with features like Agile Coretime, Async Backing, and Elastic Scaling fully rolling out, which are designed to improve performance and flexibility for parachains. A hard cap on DOT supply and stepped-down issuance is also being introduced starting in 2026, reducing inflation over time. Smart contract support and increased Ethereum compatibility are targeted, potentially lowering friction for dApp developers and deployment.
CoinMarketCap
+1
Additionally, the Join-Accumulate Machine (JAM) architecture and new identity (“Individuality”) tooling are part of the broader 2026 roadmap, making Polkadot more scalable and feature-rich.
CoinMarketCap
There are also ecosystem developments like bridges (e.g., Hyperbridge enabling multi-chain connectivity) and improvements to developer tooling, which bolster long-term fundamentals.
Wikipedia
So what does that mean right now?
I looked at the chart through the lens of these upcoming upgrades to see whether news flow is already reflected in price. The short answer: not really — at least not yet. Despite strong on-chain activity and a clear roadmap, DOT price has been weak and range-bound. In fact, it’s down significantly over the past year even as the protocol continues to build out features.
Nasdaq
This divergence between fundamentals and price action is typical in environments where upgrades are slow to translate into actual adoption and utility — especially when broader market sentiment is range-bound or bearish for altcoins.
Overall take
From a technical perspective, DOT looks a bit bearish and indecisive right now, trapped at lows with no clear breakout structure. The long-term fundamental backdrop (protocol upgrades, supply cap, smart contract support) is constructive, but price isn’t yet reflecting that optimism. It’s a classic case of tech building ahead of price action, and until the market starts valuing those upgrades — likely via adoption, volume growth, or real activity metrics — the chart remains choppy and tilted bearish near current levels.
Will #XRP Finally Recover or Is This Just Another Trap? Yello Paradisers! Are you keeping your eyes on #XRP? While most traders are zoning out, the next move might catch the crowd sleeping. Let's view #Ripple trading setup:
💎Over the past few weeks, #XRPUSDT has been trading inside a textbook falling wedge pattern on the 4H chart. Just recently, we saw a liquidity sweep below the descending support trendline, an early signal that smart money could be accumulating before a breakout move.
💎The price is currently hovering just above a strong demand zone around $1.73, with a clear descending resistance capping price action. A clean breakout above that resistance, especially if followed by a successful retest and the 50EMA flipping into support, would significantly boost the probability of a bullish move.
💎If this scenario plays out, the first minor resistance for #XRPUSD stands near $1.95, which could act as an initial profit-taking zone. Beyond that, momentum could accelerate toward $2.1951, marked as moderate resistance. But the ultimate upside target is at $2.4175, a strong resistance level with a high volume node, where aggressive sellers are likely to show up.
💎However, caution is key here. If #XRP fails to hold above the current support zone and closes below $1.7366, the bullish setup would be invalidated. That would likely trigger more downside toward $1.70 and possibly lower, especially as weak hands start exiting the market.
Trade smart, Paradisers. This setup will reward only the disciplined.
MyCryptoParadise
iFeel the success🌴

BTCUSD Time for LONG1h - bullish divergence
4h - hidden bullish divergence
15m - new low with US open and than it could star the bullrun on 15m
Target for this movement will be 93k
Stay profitable !

EURUSD Short: Supply Holds, Bears in Control, Move To 1.1550Hello traders! Here’s a clear technical breakdown of EURUSD (3H) based on the current chart structure. EURUSD initially traded within a consolidation range, where price moved sideways after a prior decline, indicating temporary equilibrium between buyers and sellers. This range acted as a base for the next directional move. A confirmed breakout from the range triggered a bullish recovery, shifting short-term control to buyers. Following the breakout, price developed a well-defined ascending channel, marked by consistent higher highs and higher lows. Pullbacks during this phase were corrective and respected the channel structure, confirming sustained bullish momentum. However, as EURUSD approached the upper boundary of the channel, upside strength began to fade. A fake breakout above channel resistance signaled buyer exhaustion and increasing sell-side pressure at higher prices. Near the highs, price formed a clear rounding top pattern around a key pivot point, reflecting a gradual loss of bullish momentum rather than an impulsive reversal. This topping structure was followed by a breakdown below internal support, confirming a short-term shift in market control. After losing the ascending structure, EURUSD transitioned into a descending channel, establishing a bearish corrective phase characterized by lower highs and lower lows.
Currently, EURUSD is trading within the descending channel and moving toward a key Demand Zone around 1.1550, which aligns with previous structural support and historical reactions. This zone represents the next important area where selling momentum may slow and buyers could attempt a defensive response.
My primary scenario remains bearish as long as EURUSD stays below the 1.1680 Supply Zone and continues to respect the descending channel structure. Pullbacks into supply that show rejection can be viewed as potential continuation opportunities, with 1.1550 Demand Zone acting as the first downside target (TP1). A clean breakdown and acceptance below 1.1550 would open the door for a deeper bearish continuation toward lower demand levels. However, a strong bullish breakout and sustained acceptance above 1.1680 would invalidate the short bias and signal a possible transition back into consolidation or bullish recovery. Until such a breakout occurs, market structure favors sellers, and upside moves are considered corrective. Manage your risk!

BTCUSDT: Buyers Defends, Preparing for Breakout Above $96.5KHello everyone, here is my breakdown of the current BTCUSDT setup.
Market Analysis
BTCUSDT is trading within a well-defined ascending channel, confirming a strong bullish market structure. After a prolonged consolidation phase earlier on the chart, price successfully broke out to the upside and began forming higher highs and higher lows, signaling renewed buyer strength. Following the breakout, BTC rallied aggressively toward a key Resistance Zone around 96,500, where selling pressure became evident. Multiple tests of this resistance area failed to produce a clean continuation higher, leading price into a range formation just below resistance. This range reflects temporary equilibrium between buyers and sellers after the impulsive move up.
Currently, on the downside, price is being supported by a clearly defined Support Zone around 94,000, which previously acted as a breakout level and is now serving as demand. The market recently tested this support and reacted positively, indicating that buyers are still active and defending the level. Structurally, BTC remains above both the channel support and the horizontal support zone, keeping the broader bullish bias intact. The presence of a descending triangle resistance line within the range highlights short-term compression, suggesting that a volatility expansion may follow once price decisively breaks out of the current structure.
My Scenario & Strategy
My primary scenario remains bullish as long as BTCUSDT holds above the 94,000 Support Zone and respects the ascending channel structure. In this case, I expect price to continue consolidating briefly before attempting another move toward the 96,500 Resistance Zone, with a potential breakout opening the way for further upside continuation.
However, a clean breakdown and acceptance below 94,000 would invalidate the bullish setup and signal a deeper corrective move within the channel, possibly toward lower support levels. Until that happens, the market structure favors buyers, and pullbacks into support are viewed as potential long opportunities, while resistance remains the key level to watch for confirmation.
That’s the setup I’m tracking. Thank you for your attention, and always manage your risk.
