Are tech stocks about to surge? Nasdaq New Highs? The market is very close to making a big move.
We believe the market is still bullish and will likely trend higher.
Today crypto was strong when the market was weak. This could be signaling tech is about to capture some bullish liquidity.
Banks got decimated today, which allows lots of capital to rotate back into tech.
The Nasdaq is lagging and the only indices to not make new all time highs.
Crypto

Monero Breaks All-Time Highs As Bullish Structure Points HigherMonero (XMRUSD) is now aggressively breaking into new all-time highs, in line with expectations. On the monthly chart, price action continues to suggest significant room for further upside. Monero may be unfolding a five-wave bullish impulse, or alternatively, breaking out from a larger bullish triangle formation. In both scenarios, the technical picture supports much higher levels.
On the weekly timeframe, we are still tracking a projected extended wave (5) of wave 3. Fibonacci cluster targets continue to point toward the 1000 area before a higher-degree wave 4 correction is expected to unfold. At the moment, price appears to be rising within subwave 3 of an ongoing five-wave bullish impulse for wave (5). This suggests that additional gains are likely in the near term.
That said, traders should remain aware of a potential subwave 4 pullback, which would be a normal part of the structure, before a renewed bullish continuation in subwave 5 of wave (5) of 3.

SOL 1D Update: Looking to establish new uptrendSOL update.
SOL is now establishing a new short-term uptrend after spending months inside a descending channel. The key shift is structural: price has broken out of the downtrend and is no longer making lower lows. Instead, it’s holding above former support around the $125 level and building higher lows, which is exactly what you want to see in an early trend transition.
The move higher toward the $140–145 area has been more controlled and constructive than prior bounces. Instead of sharp relief moves that fade immediately, SOL is grinding higher and holding gains, suggesting real demand rather than just short covering.
This strength is also starting to show up across the Solana ecosystem. Several SOL meme coins are attempting to break out of their own basing structures, which typically happens when SOL itself stops trending down and begins to lead. That kind of breadth is important and often precedes stronger continuation if it sustains.
Key levels to watch:
As long as SOL holds above $125, the uptrend structure remains intact.
Acceptance above $145 opens the door for a move toward the $160–180 region, where heavier resistance sits.
A failure back below $125 would invalidate the breakout and shift this back into range behavior.
Overall, SOL’s character has changed from sell-the-rip to buy-the-dip. It’s still early and likely to be choppy, but the market is finally starting to lean in the right direction. If this structure holds, both SOL and its meme ecosystem have room to expand further.

#VET Ready for a Major Bullish Move | Key Levels to Watch Yello, Paradiser! Is #VeChain about to trap all the late bears, or are we about to witness one more brutal shakeout? Let's view the #VETUSDT trading setup:
💎#VET is currently trading around $0.0116 on the 1D timeframe, and just completed a breakout from a textbook Falling Wedge, one of the most reliable bullish reversal patterns when combined with confirmation signals.
💎The breakout has already occurred, and most importantly, it is now retesting the descending resistance to validate this breakout. This is often a critical validation of strength and suggests the move is likely not a fakeout. In addition, we’ve already seen a bullish crossover on the momentum oscillator, which adds further confirmation to this bullish setup.
💎The Strong Demand Zone between $0.0094 and $0.010 is now acting as the base of this bullish structure. Holding above this level is essential. If bulls continue to defend this zone, we anticipate a potential push toward the first major resistance at $0.0138, followed by the strong resistance area between $0.019 and $0.020, where sellers are likely to step in more aggressively.
💎Below the structure, we’ve clearly marked Key Support at $0.0078 for #VETUSD. If price closes below this zone, it would invalidate the bullish scenario and open the door for further downside, potentially into illiquid areas where volatility could spike.
Be patient, wait for structure to confirm, and stick to your plan. That’s what keeps you consistent while others chase.
MyCryptoParadise
iFeel the success🌴

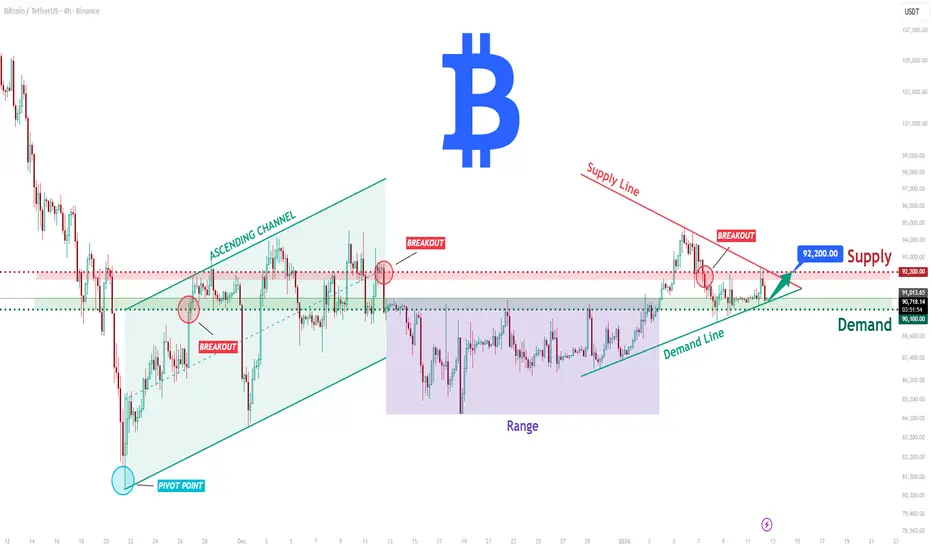
BTCUSDT Long: Demand Holding at 90,100 - Eyes on 92,200 SupplyHello traders! Here’s a clear technical breakdown of BTCUSDT (4H) based on the current chart structure. After a strong bearish move, BTC formed a clear pivot low, from which price transitioned into a bullish recovery phase. From this pivot point, the market developed a well-defined ascending channel, confirming a shift in market structure and increasing buyer control through a sequence of higher highs and higher lows. This channel guided price higher until BTC reached a key Supply Zone around 92,000–92,200, where selling pressure emerged. At this supply area, price experienced a rejection and breakout failure, indicating that sellers are actively defending this level. Following the rejection, BTC briefly broke below short-term structure and moved into a consolidation range, reflecting temporary balance between buyers and sellers. More recently, price has started to recover again, respecting a rising Demand Line, which signals that buyers are still defending the broader bullish structure.
Currently, BTC is trading between a key Demand Zone near 90,100–90,300 and the overhead Supply Zone around 92,200. This area represents a critical decision zone for the market, where the next directional move is likely to be defined.
My scenario: as long as BTCUSDT holds above the Demand Zone and continues to respect the rising demand trend line, the bullish bias remains valid. I expect buyers to attempt another push toward the 92,200 Supply Zone. A clean breakout and acceptance above this level would confirm bullish continuation and open the door for further upside. However, a strong rejection from supply followed by a breakdown below demand would weaken the structure and increase the probability of a deeper corrective move. For now, price remains in a compression phase between demand and supply — patience and proper risk management are key. Manage your risk!
SOLUSDT – Daily Follow-Up UpdatePrice is reacting well after bouncing from daily support.
We’re now pushing into a key resistance zone that previously acted as support.
Bullish scenario:
A clean daily close above resistance + successful flip into support opens the door for a move toward the daily FVG around 170–176.
That level is the main upside target.
Bearish scenario:
Failure to hold this resistance could lead to a rejection and a move back toward daily support / lower FVG.
Bias stays neutral → bullish, but confirmation is required.
No breakout = no trade.
👉 Do you expect SOL to flip this level and continue higher, or will we see another rejection?
MrC

ETHUSD At a Critical Support Test — Accumulation or Breakdown?On the H1 timeframe, ETHUSD is currently trading at a key decision zone, where market structure, EMA positioning, and liquidity dynamics are all converging. From a broader perspective, the market previously completed a clear bearish cycle, with price trending below the EMA and producing lower highs and lower lows. This confirms that the dominant structure before the current phase was bearish, not impulsively bullish.
As price reached the lower area around 3,080–3,100, selling pressure began to weaken. The market transitioned into a sideways accumulation phase, marked by compressed candles and reduced downside follow-through. This zone now acts as a critical support and liquidity base, where buyers and sellers are actively battling for control.
Currently, price is trading below the EMA, which is an important technical detail. As long as ETH remains below this dynamic resistance, upside moves should be treated as corrective pullbacks, not confirmed trend reversals. The recent push up and rejection back into the support zone reinforces the idea that the EMA is still capping price.
Two primary scenarios are now in play:
In the bullish cycle continuation scenario, if price holds above the highlighted support zone and forms a higher low, this would signal successful absorption of sell-side liquidity. A reclaim and acceptance above the EMA would then shift the structure into early markup. In this case, the first upside target sits near 3,163, followed by a higher liquidity objective around 3,218, where previous supply and imbalance remain untested.
In the bearish continuation scenario, a clean break and close below the support zone would confirm that accumulation has failed. This would open the door for a renewed markdown phase, with price likely targeting the lower liquidity pool around 3,036–3,026, where unfilled demand and stops are resting.
In summary, ETHUSD is sitting at a cycle inflection point. The support zone is the line between accumulation and further distribution. Traders should remain patient and wait for confirmation — either a strong reclaim above the EMA for bullish continuation, or a decisive breakdown below support to confirm bearish expansion.

Ethereum Enters a New Market Cycle — Accumulation CompleteOn the H1 timeframe, Ethereum is showing a classic market cycle transition, aligning well with Wyckoff / cycle theory rather than random price movement. The recent structure strongly suggests that ETH has already completed a full corrective cycle and is now rotating into a new bullish expansion phase.
From a cycle perspective, the market first experienced a distribution phase near the previous highs around the 3,280 region, where strong selling pressure entered and ended the prior uptrend. This was followed by a markdown phase, clearly visible in the sustained bearish leg where price traded below the fast and slow moving averages, confirming bearish control and momentum continuation to the downside.
As price approached the 3,050–3,080 area, selling pressure began to weaken. This zone marked the accumulation phase of the cycle. Price action shifted from impulsive bearish candles into a rounded, basing structure, forming a smooth curvature that reflects smart money absorption rather than panic selling. This rounded bottom is a textbook sign that supply is being absorbed and that the market is preparing for a trend transition.
The current price action shows Ethereum moving into the early markup phase. This is confirmed by higher lows, improving structure, and price reclaiming and holding above the faster moving average while compressing toward the slower one. The slope of price is now turning upward, indicating momentum rotation from bearish to bullish control.
From a cycle continuation standpoint, as long as ETH holds above the basing area and maintains acceptance above the moving averages, the bullish cycle remains intact. The projected path aligns with a healthy expansion structure: impulsive pushes higher followed by shallow pullbacks, targeting the previous liquidity high near 3,280 as the next major cycle objective.
In summary, Ethereum is no longer in a corrective or bearish phase. The cycle has reset, accumulation appears complete, and the market is transitioning into markup. Unless price aggressively re-enters the accumulation range, the dominant expectation remains higher highs as the bullish cycle unfolds.

BTCUSD – The Uptrend Is Being ReinforcedAs the market waits for key macroeconomic data, BTCUSD is telling a clear and constructive technical story: price is building a solid base for a sustainable uptrend, rather than reacting in a chaotic way to short-term news.
Looking at the chart, Bitcoin continues to maintain a structure of higher lows, closely respecting a long-term ascending trendline. Each corrective move has stalled precisely within demand zones, confirming that active buying interest remains present. Most importantly, price is now holding firmly above the Ichimoku Kumo — a strong signal that the bullish trend is being accepted by the market, not merely forming a temporary technical rebound.
The 89,400 USD zone is acting as a key support level. Repeated positive reactions from this area clearly highlight it as a defensive zone for buyers. In a constructive scenario, as long as BTCUSD continues to hold above this support and absorb short-term volatility, the next upside objective points toward 94,900 – 95,000 USD, aligning with the upper supply zone and previous reaction highs.
When combined with the news backdrop, as long as CPI data does not come in excessively “hot” , Bitcoin has a solid foundation to extend its current bullish momentum. Technical structure remains supportive, while overall market sentiment is gradually stabilizing — a combination that favors continuation rather than reversal.

ETH Bullish Reversal Setup - $2800ETH Bullish Reversal Setup
⸻
🔍 Quick Summary
Ethereum is bouncing from a major weekly demand zone around the 0.618 retracement and is holding a strong ascending trendline. I expect ETH to reclaim the $3,600–$4,000 region before making a move toward the weak high above $5,200 as the next liquidity target 🔥.
⸻
📊 Deep Analysis
On the weekly chart, ETH has tapped into a clean confluence zone:
• 0.618 retracement from the larger swing
• Strong historical demand zone ($2,750–$2,850)
• Ascending trendline support
• A clear CHoCH signalling early bullish shift
Each of these factors reinforces the likelihood of ETH forming a higher low before pushing higher.
The red zone between $3,600–$4,000 is a previous distribution region, but if ETH can reclaim it, momentum shifts decisively bullish. Above this level sits the Weak High at ±$5,230, a typical liquidity magnet. The blue projection path on your chart makes sense: pullback → reclaim → expansion toward the next liquidity pool.
Volume shows initial absorption at support, and the last strong rejection wick near the green zone suggests buyers are stepping in. As long as ETH holds above $2,750, the macro bullish structure remains intact.
⸻
📰 News Supporting My Bias
• ETF flows have been strengthening, with Ethereum-related funds showing renewed inflows as institutional interest returns.
• ETH staking continues to rise, tightening supply and supporting price appreciation.
• Developers are preparing for Pectra upgrade phases, which aim to improve wallet UX and account abstraction — bullish for long-term network adoption.
• Ethereum’s L2 ecosystem (Arbitrum, Base, Optimism) continues growing in TVL, increasing overall activity.
All of this fundamentals momentum aligns with the bullish chart structure.
⸻
🎯 Trade Idea Scenario
Bullish Scenario
• Entry: Current region or any pullback into $2,750–$2,850
• TP1: $3,600–$3,800 (first structure zone)
• TP2: $5,200+ (Weak High liquidity target)
• SL / Invalidation: Below $2,280 (breaks trendline, strong low threatened)
Bearish Scenario
Only activated if ETH loses the ascending trendline and breaks below $2,750 with weekly closes — that opens downside toward $2,200. At the moment, structure supports the bullish case.
⸻
📌 What I’m Watching Next
I’m watching how ETH behaves around $3,600–$3,800. A weekly close above this zone confirms momentum and likely sends price toward $5k+. Weakness or heavy wicks here could delay the breakout, but the broader structure still favours upside.
⸻
⚠️ Disclaimer
This is my personal analysis and not financial advice. Always do your own research and manage risk carefully 📉📚.

INJ Breaking Out From Descending ChannelINJ has been trading inside a well-defined descending channel and is now reacting strongly from the lower boundary. Price swept the channel support near 4.18 and formed a bullish reaction from the 4.48–4.76 demand zone, aligning with the 0.618–0.786 retracement area.
The current move suggests a potential short-term trend shift. A sustained move above 5.23 would confirm strength, opening the path toward 6.18 as the first major resistance, followed by 8.99 if momentum expands. As long as price holds above the demand zone, bullish continuation remains valid.
A breakdown below 4.18 would invalidate this recovery and expose deeper downside toward 2.73.

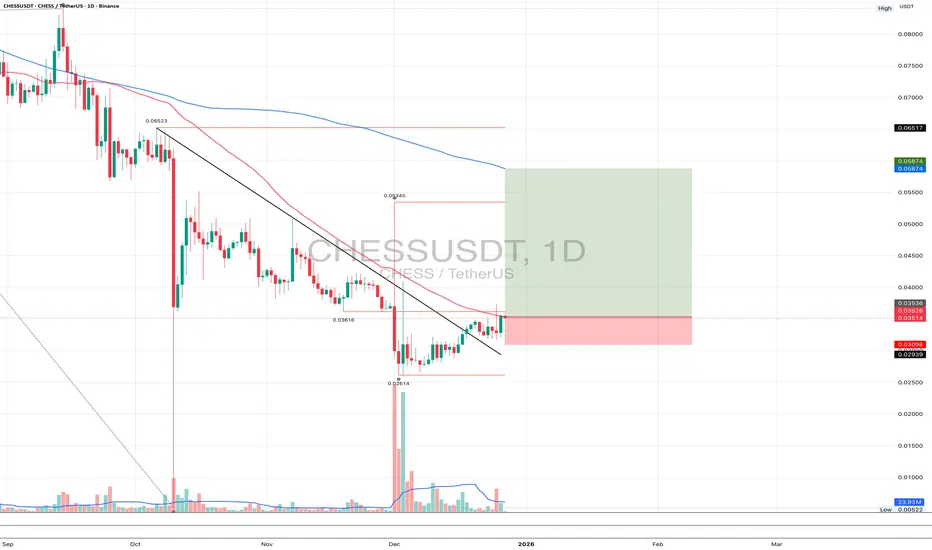
CHESSUSDT 1DShort technical update 👇
On the daily timeframe, CHESS broke its bearish structure and completed a clean retest of the breakout level. The retest held, selling pressure is fading, and higher local lows are forming. The current structure suggests a recovery phase after a prolonged decline. The base scenario is a continuation to the upside with a move toward the MA200 as the next key mid-term target.
XMRUSDT - Another push up… or time for a healthy reality check?Alright, XMR is absolutely trending like a maniac right now.
Strong momentum, clean structure, zero chill.
But let’s be honest — nothing goes up forever. Not even Monero.
What we’re looking for here:
• A retracement within the uptrend, not a trend reversal
• A chance to catch a better entry near the bottom
• Basically: buy fear, not euphoria
This is one of those trades where:
• If it triggers, it might take time
• Levels can shift
• And patience is part of the strategy (unfortunately 😅)
Why this makes sense:
• Similar setup to PIPPIN
• Strong trend intact
• Waiting for a pullback instead of chasing green candles like a tourist
Also — let’s talk black swan energy 🦢:
• If we get a sudden market panic
• Expect nasty wicks
• And yes, that’s actually part of the plan
We’re not predicting chaos — we’re just prepared for it.
So the idea is simple:
👉 Let XMR cool off
👉 Let panic do its thing
👉 Step in on the retracement
👉 Ride the trend continuation (if the market allows it)
This is a slow-cooker trade, not microwave money.
If it sets up, great.
If not — no FOMO, no drama.
Let’s see how it plays out 👀📊

PIPPIN - Another push up… after it scares everyone first?Alright, let’s talk PIPPIN, aka “emotional damage in candle form”.
Big picture first:
• On the DAILY timeframe, PIPPIN is still in a clear uptrend
• Trend is alive, breathing, and not dead yet
But — because this is PIPPIN — nothing comes easy.
What I’m expecting:
• A bit more downside first to shake out weak hands
• Followed by a classic wick fiesta 🕯️🕯️🕯️
• And then… continuation upwards
This coin is hectic by nature:
• Long wicks
• Fake breakdowns
• Random panic candles before liftoff
That’s exactly why the plan exists.
Trade idea:
👉 Let price dip into the zone
👉 Let the market scare everyone out
👉 Enter when it looks the worst
👉 Ride the move up (if it decides to behave)
Take Profit:
Will be updated after the limit order gets filled
(if it gets filled — no fill, no trade, no stress 😌)
This one is not about prediction, it’s about reaction.
If it hits, great.
If it doesn’t, we move on like emotionally stable traders.
Let’s see what PIPPIN decides to do 👀📊

BTCUSD (15m) — Bullish RSI Divergence 📈 BTCUSD (15m) — Bullish RSI Divergence Signals Momentum Shift
Timeframe: 15m
Market: BTCUSD (Bitstamp)
Indicator: RSI
🧠 Idea Overview
BTC printed a clear bullish divergence on the 15-minute chart, suggesting selling pressure was weakening despite lower price lows. This divergence preceded a strong upside reaction, highlighting a potential local trend reversal / continuation higher.
🔍 What We’re Seeing
Price made a lower low (highlighted by the descending trendline on price)
RSI made a higher low (ascending trendline on RSI)
This creates a classic bullish divergence
RSI held above the extreme oversold region, signaling bear exhaustion rather than panic selling
At the same time, price reclaimed short-term structure and expanded upward with momentum, confirming the divergence.
✅ Confirmation Factors
RSI turned up and crossed back above its signal / mid-range
Strong bullish candles followed the divergence
Volume expanded on the move higher
No immediate acceptance below the prior low (failed breakdown)
This confirms the divergence was actionable, not just theoretical.
❌ Invalidation
This bullish thesis would have been invalidated if:
Price accepted below the prior swing low
RSI broke down and made a new lower low
The bounce failed to reclaim local structure
None of those occurred — instead, price accelerated upward.
🎯 Takeaway
Bullish divergences work best:
After a pullback in an overall bullish context
When paired with structure reclaim or momentum expansion
As early warning signals, not standalone entries
This setup was a good example of momentum shifting before price.
⚠️ Reminder
Divergences do not call exact bottoms — they highlight probability shifts. Always combine with structure, trend context, and risk management.

ADA - Liquidity sweep first, then straight to the basement?ADA – Liquidity sweep first, then straight to the basement?
Alright, déjà vu alert 🚨
This setup is giving strong WIF flashbacks.
Same movie, different actor:
• We’ve got liquidity sitting above price, just begging to be tapped
• Market loves doing one last “hope pump”
• And then… surprise, ADA remembers gravity exists
So yeah, the idea is simple:
👉 Quick move up to grab liquidity
👉 Immediate mood swing
👉 Downside continuation
Could this be a clean, fast trade?
Absolutely.
Could it also turn into a speedrun to your stop loss?
Also absolutely 😅
That’s why this one comes with a mandatory disclaimer:
⚠️ Risk Management Is Not Optional Here
• This can be fast money
• Or fast loss
• There is no emotional middle ground
Keep position size small, stops tight, and ego even tighter.
If liquidity gets swept and price rejects → beautiful.
If ADA decides to cosplay as a “long-term investment” → we step aside and live to trade another day.
Trade the plan, not the hope.
And remember: Cardano loves to give just enough confidence before doing the opposite. 😌📉

WIFUSDT - Up first, then gravity does its jobAlright, hear me out before you ape in.
So far, I’ve lined up 4 trades that all follow the same classic crypto ritual:
👉 grab liquidity → fake everyone out → nuke the opposite direction.
Now, yes, we might get a market-wide pump this week…
or it could just be another episode of “Crypto: Market Manipulation – Season 47”. We’ll find out soon 🍿
First on today’s menu: WIF 🐶
Here’s what’s cooking:
• There’s a HIGH above price that still hasn’t been taken (liquidity is screaming “come get me”)
• A Fair Value Gap (FVG) sitting there, patiently waiting to be filled
• And, just to make it more obvious, clean resistance above us
So yeah, a move up makes total sense before anything ugly happens.
Take Profit?
Depends on how far the pump wants to flex. But if you zoom out to the DAILY timeframe, you’ll notice something important:
👉 We can actually go much, much lower.
So the plan is simple:
• Short-term pump to clean highs & fill inefficiencies
• Then… down only, as tradition demands 🧨
This setup actually makes sense — which in crypto usually means “let’s see how it tries to ruin us”.
Let’s watch it play out 👀📉

CVD and Open Interest DivergenceOpen Interest answers a simple but critical question: are traders committing new risk, or are they exiting existing positions? When price rises while Open Interest increases, new contracts are being added in the direction of the move. This confirms expansion and signals that the market is willing to fund higher prices. When price rises while Open Interest falls, positions are being closed into strength. That behavior reflects distribution rather than continuation. The same logic applies on the downside. Falling price with rising Open Interest signals aggressive short participation. Falling price with declining Open Interest signals profit-taking, not fresh selling pressure.
Cumulative Volume Delta adds context to this positioning data. It measures whether aggressive market orders are driving price or being absorbed by passive liquidity. When price prints higher highs but CVD fails to confirm, buying pressure is weakening despite higher prices. Participants are lifting offers with less urgency, and absorption is occurring. When price stalls or compresses while CVD continues to rise, it suggests that aggressive buyers are being absorbed by larger passive sellers. The move looks strong on price, but commitment is thinning.
These divergences become most meaningful when they appear at structurally relevant locations. Inside ranges, they frequently expose failed breakouts where price briefly escapes but participation does not follow. At highs and lows, they reveal exhaustion, where liquidity has been collected but no new initiative remains. During established trends, they help differentiate healthy continuation from late-stage rotation, where the trend persists visually but weakens internally.
The highest-quality environments occur when structure and participation align. A clean break of structure followed by expanding Open Interest and confirming CVD indicates that the market has accepted the new direction. Risk is being added, not removed, and aggressive flow supports price discovery. When one of these components is missing, vulnerability increases. Breaks without Open Interest expansion often fade. Moves with Open Interest but no CVD confirmation frequently stall or retrace.
Many traders struggle because they trade direction without measuring commitment. They react to candles instead of assessing whether the move is being funded. CVD and Open Interest shift the focus from where price moved to why it moved. This perspective reduces overtrading, filters false momentum, and clarifies when patience is required.
Used correctly, these tools are not predictive indicators. They do not call tops or bottoms. They expose when a market narrative is weakening before structure fully changes. That awareness improves timing, limits unnecessary exposure, and prevents chasing moves already sustained by trapped or exiting participants. In leveraged markets, understanding participation is not an edge. It is a requirement for survival.

BNB 1W Update: Slowly improving, still skeptical BNB update on the weekly.
BNB continues to look structurally strong despite the recent pullback from the highs. After a sharp impulsive rally, price has transitioned into consolidation rather than unwinding aggressively, which is generally a sign of strength, not weakness.
The ~$900 area is acting as a key pivot zone. Price has pulled back into this region and is chopping rather than breaking down, suggesting the market is digesting gains instead of distributing heavily. This is typical behavior after a strong expansion leg.
The most important higher timeframe support remains around $660–670. That level was former resistance, then flipped to support, and it’s the level that defines whether this move remains a bullish continuation structure or turns into something more corrective. As long as BNB holds above that zone on a weekly basis, the broader uptrend remains intact.
From a structure standpoint, this looks like a potential higher low forming after an impulsive move. The curved projection on the chart reflects what often happens in strong markets: a deeper pullback to reset momentum, followed by a renewed expansion once sellers are absorbed.
If BNB can continue to base above the $900 region and eventually reclaim upside momentum, the path opens toward new highs later in the cycle. If instead price rolls over and loses $660, that would signal a deeper corrective phase and more time needed before continuation.
Overall, BNB still looks like a leader relative to many other large-cap alts. This is consolidation after strength, not breakdown behavior, and as long as higher timeframe support holds, the bias remains constructive with patience favored over chasing short-term moves.

Is #IOTA Ready For a Major Bullish Wave or Will it Fall Further?Yello, Paradiser! Are you ready for what could be a brutal shakeout for bears or a golden entry for bulls on #IOTAUSDT? This falling wedge might not stay quiet for long. Let’s break down the #IOTA Setup:
💎#IOTAUSD is currently trading around $0.084 on the 4H timeframe and has just broken out of a textbook falling wedge pattern. This pattern typically signals a bullish reversal, but only when confirmed by proper retest and strength.
💎We’ve already seen a breakout followed by a retest of the descending resistance, which is a key early sign that momentum might be shifting. Adding to that, the 50 EMA is now attempting to turn into support, and if it holds, it significantly increases the probability of a strong bullish follow-through.
💎The demand zone between $0.080 and $0.084 is now acting as the make-or-break level for bulls. Holding above this zone keeps the bullish setup alive. If price continues to build structure above this area, we could see acceleration toward the first major resistance at $0.100, followed by a strong resistance near $0.120, where we expect sellers to become more aggressive.
💎However, as always, risk management comes first. The bullish thesis is invalidated if price breaks below the key support at $0.0717, where the structure would be compromised, and a bearish continuation toward lower liquidity zones could begin.
Trade smart, Paradisers. This setup will reward only the disciplined.
MyCryptoParadise
iFeel the success🌴

EURUSD Long: Bulls Defend 1.1620 Demand, Targeting Supply 1.1680Hello traders! Here’s a clear technical breakdown of EURUSD (2H) based on the current chart structure. EURUSD initially traded within a well-defined range, where price moved sideways for an extended period, reflecting a balance between buyers and sellers. During this consolidation phase, the market attempted several breakouts, including a fake breakout to the upside, which signaled weakness and lack of bullish continuation. Eventually, price achieved a valid range breakout, initiating an impulsive bullish move. Following this breakout, EURUSD reached a pivot point, where bullish momentum stalled and sellers began to step in. From this pivot high, price structure shifted into a descending channel, characterized by a series of lower highs and lower lows, confirming short-term bearish control. Price respected the channel boundaries well, indicating an orderly corrective move rather than panic selling. As EURUSD continued lower, it approached a strong Demand Zone around 1.1620, which aligns with a rising higher-timeframe trend line. This confluence area acted as a key support, where buyers responded aggressively. From this demand zone, price broke out of the descending channel, signaling weakening bearish momentum and a potential shift back toward bullish control.
Currently, price is reacting positively from demand and attempting to move higher. The next key level to watch is the Supply Zone around 1.1680, where previous selling pressure is expected to reappear. This level also coincides with prior structural reactions, increasing the probability of a pause or rejection.
My scenario: as long as EURUSD holds above the 1.1620 Demand Zone and respects the rising trend line, the bullish bias remains valid. I expect buyers to push price toward the 1.1680 Supply Zone, where a reaction or short-term pullback may occur. A clean breakout and acceptance above supply would confirm bullish continuation. However, a strong rejection from supply or a breakdown below demand would increase the probability of bearish continuation. For now, price is at a key decision area, and disciplined risk management is essential. Manage your risk!

XAUUSD Long: Demand Defended - Bulls Prepare for Push To $4,530Hello traders! Here’s a clear technical breakdown of XAUUSD (3H) based on the current chart structure. Gold is trading within a well-defined ascending channel, confirming sustained bullish control and a strong trending environment. Price has consistently respected both the channel support and resistance, forming higher highs and higher lows. This structure highlights healthy momentum rather than an exhausted move.
Earlier, XAUUSD pushed into the Supply Zone around 4,500–4,530, where selling pressure appeared and price experienced a sharp rejection. This rejection led to a corrective pullback, during which price briefly broke below short-term structure before finding support at the Demand Zone near 4,400. This area aligns with the channel support and acted as a key reaction level. Within the pullback, price formed a Head and Shoulders–type corrective pattern, which completed near demand. Instead of continuation lower, sellers failed to follow through, and buyers stepped in aggressively. Price reclaimed structure with a clean breakout back above local resistance and the rising Demand Line, signaling that the move lower was corrective rather than a trend reversal. Currently, XAUUSD is holding above the 4,400 Demand Zone and continues to respect the ascending channel. Price is consolidating and building higher lows, suggesting accumulation before the next impulse.
My scenario: as long as Gold holds above the demand zone and the rising demand line, the bullish structure remains intact. I expect buyers to defend this area and push price toward the 4,530 Supply Zone (TP1). A clean breakout and acceptance above supply would confirm bullish continuation and open the door for further upside expansion. However, a decisive breakdown below the demand zone would weaken the structure and increase the risk of a deeper correction. For now, the trend favors the bulls, with demand holding and momentum gradually rebuilding. Manage your risk!

BTCUSDT: Consolidates Above Support, Bulls Preparing Next MoveHello everyone, here is my breakdown of the current BTCUSDT setup.
Market Analysis
BTCUSDT previously traded inside a well-defined range, where price moved sideways for an extended period, indicating balance and accumulation between buyers and sellers. This consolidation phase ended with a clean breakout to the upside, confirming a shift in market control toward buyers. Following the breakout, price respected a rising trend line, forming higher highs and higher lows, which validated a bullish market structure. As BTC continued higher, it reached a key Resistance Zone around 91,700, where selling pressure appeared. Price reacted from this area and pulled back, but the move remained corrective rather than impulsive. During the pullback, BTC found support at the Support Zone near 90,100, which aligns with previous breakout structure and the rising trend line. At the same time, price is trading below a descending triangle resistance line, suggesting compression and preparation for a directional move.
Currently, BTC is holding above the support zone and the ascending trend line, while consolidating below resistance. This structure suggests buyers are still defending the market, and the overall bullish bias remains intact as long as support holds.
My Scenario & Strategy
My primary scenario: as long as BTCUSDT remains above the 90,100 Support Zone and continues to respect the rising trend line, the bullish bias remains valid. I expect buyers to defend this area and attempt a breakout above the 91,700 Resistance Zone, which would open the door for continuation toward higher levels.
However, a decisive breakdown below support and the trend line would weaken the bullish structure and increase the probability of a deeper corrective move. Until that happens, price action favors consolidation followed by potential upside continuation.
That's the setup I'm tracking. Thank you for your attention, and always manage your risk.
