SOL Short-term analysis | Trading and expectationsCRYPTOCAP:SOL
🎯Price caught a strong bid moving bullishly above the daily pivot but struggling at the High Volume Node resistance. Wave 1 of a new motif wave appears to be underway with an inital target of the daily 200EMA.
📈 Daily RSI has bearish divergence, price must get above $145 to negate this or face further downside.
👉 Analysis is invalidated below wave C, $110
Safe trading
Crypto

ONDO Short-term analysis | Trading and expectationsLSE:ONDO
🎯Price printed a 3 white knight bullish engulfing pattern, jumping above the daily pivot and the descending resistance trend-line. Price must get above $0.5 to negate the bearish divergence that has emerged. Wave 1 of a new uptrend appears to be underway.
📈 Daily RSI tapped oversold with bullish divergence, where it caught a bid.
👉 Analysis is invalidated below the swing low, $0.35
Safe trading

HBAR Short-term analysis | Trading and expectationsCRYPTOCAP:HBAR
🎯Price caught a strong bid on bullish divergence, flipping the local structure bullish. However, bearish divergence has emerged at High Volume Node resistance. Price is above the daily pivot, which is bullish, but has a long way to go to reach the daily 200EMA.
📈 Price must get above $0.148 to negate the bearish divergence.
👉Analysis is invalidated below the swing low, keeping wave 2 alive.
Safe trading

ETH Short-term analysis | Trading and expectationsCRYPTOCAP:ETH
🎯Wave 1 appears to have completed a leading diagonal. Wave 2 appears complete with the recent higher high. Price was rejected at the daily 200EMA but is attempting to break through again. Overcoming this will be very bullish, especially as we are above the daily pivot.
📈 Daily RSI is printing bearish divergence. A move above wave (1) is essential to negate this, or prices could head to new local lows.
👉 Analysis is invalidated below wave (2)
Safe trading

DOGE Short-term analysis | Trading and expectationsCRYPTOCAP:DOGE
🎯 Price printed a bullish engulfing 3 white knight candle pattern. It is above the daily pivot, showing a bullish trend is emerging, but still below the daily 200EMA. Overcoming this will be very bullish. The Elliot wave count is tricky, so I will await more confirmation.
📈 Daily RSI has printed bullish divergence. The RSI shot up too hard and fast, which often results in a reversal, potentially testing the daily pivot as support.
👉 Analysis is invalidated below the swing low, keeping the downtrend alive
Safe trading

BNB Short-term analysis | Trading and expectationsCRYPTOCAP:BNB
🎯Price has closed above the daily 200EMA and daily pivot, suggesting a new bull trend has taken hold. If this is wave (3), we should expect a strong breakout in the coming days/weeks towards the all-time high. Wave 4 appears complete, with a textbook ABC correction ending at High Volume Node support.
📈 Daily RSI is currently showing bearish divergence across many altcoins, including BNB. A push above wave (1) will negate this divergence.
👉 Analysis is invalidated below wave (2), daily pivot and 200EMA.
Safe trading

AAVE Short-term analysis | Trading and expectationsCRYPTOCAP:AAVE
🎯 Price printed a bullish engulfing candle from daily RSI bullish divergence and High Volume Node support. It is currently testing the pivot. Overcoming this will add confidence to the bullish move, with a first target of the daily 200EMA and High Volume Node resistance at $220. Overcoming the daily 200EMA will add confluence to a major bottom being in.
📈 Wave (C) of triangle wave (D) appears to be underway. Daily RSI sits at the channel EQ and is crossed bullishly.
👉 Analysis is invalidated if we drop below $148, keeping wave (B) alive.
Safe trading

BTCUSDT Long: Uptrend Continues Toward 94,500 ResistanceHello traders! Here’s a clear technical breakdown of BTCUSDT (4H) based on the current chart structure. BTCUSDT initially traded within a well-defined descending channel, reflecting sustained bearish pressure during that phase. This move ended with a clear pivot point, followed by a strong breakout from the descending channel, signaling a shift in market control from sellers to buyers. After this breakout, price transitioned into a broad range, where BTC consolidated for an extended period, showing balance between supply and demand with multiple internal reactions.
Currently, BTC is approaching a key Supply Zone around the 94,500 level, where previous selling pressure is expected to re-emerge. This area aligns with the upper boundary of the ascending channel, increasing the likelihood of a reaction. Below current price, the Demand Zone near 86,800 remains a critical support level, marking the prior breakout area and the base of the bullish structure.
My scenario: as long as BTCUSDT holds above the Demand Zone and stays within the ascending channel, the bullish bias remains intact. I expect price to test the 94,500 Supply Zone, where a reaction or short-term pullback may occur. A clean breakout and acceptance above supply would signal further upside continuation. However, a strong rejection from supply followed by a breakdown below channel support would suggest a deeper corrective move. For now, structure favors buyers while price remains within the ascending channel. Manage your risk!

BTCUSDT: Sellers Defend 91,800 as Bullish Momentum WeakensHello everyone, here is my breakdown of the current BTCUSDT setup.
Market Analysis
BTCUSDT spent a significant period trading inside a well-defined range, where price oscillated between clear support and resistance levels, showing indecision and balanced participation from both buyers and sellers. Multiple breakout attempts from this range failed, confirming the strength of the boundaries and the lack of sustained momentum during that phase. Eventually, price broke out of the range to the upside and transitioned into a clean ascending channel, signaling a short-term bullish shift. This move was supported by higher highs and higher lows, reflecting increasing buyer control. However, as price approached the major Resistance Zone around 91,800, bullish momentum started to fade. The market printed reactions and hesitation near this resistance, indicating strong selling interest at higher levels.
Currently, the upper boundary of the ascending channel is being tested, and price is currently struggling to hold above the 90,000 Support Zone, which previously acted as a key breakout and demand area. The recent price action suggests that the upside move is losing strength and may be corrective rather than impulsive.
My Scenario & Strategy
My primary scenario: as long as BTCUSDT remains below the 91,800 Resistance Zone and fails to reclaim the upper part of the ascending channel, the bias favors a short-term bearish correction. A rejection from resistance increases the probability of a pullback toward the 90,000 Support Zone, which is the first key downside target. If this support fails to hold, further downside continuation toward lower range levels becomes possible.
However, a strong bullish breakout and acceptance above 91,800 would invalidate the short bias and open the door for renewed upside continuation within or above the channel. For now, price is at a critical decision area, with sellers defending resistance and buyers attempting to hold structure. Caution and proper risk management are essential in this zone.
That's the setup I'm tracking. Thank you for your attention, and always manage your risk.

Chainlink (LINK) Price Eyes a Push Toward the Top of Its Channel* The Chainlink price is trading inside a tight channel, with momentum slowly starting to pick up.
* On-chain data indicates steady, real network usage rather than short-term speculation.
* LINK is approaching the top of its channel, a level that could shape the next move.
If you step back and look at what Chainlink has been doing lately, one thing stands out right away: nothing feels rushed. There’s no panic, no aggressive selling, and no breakout mania either. LINK is just moving sideways inside a tight range, and that kind of price action tends to make people tune out because it feels boring.
For a while now, the LINK price has been slowly compressing inside its channel. Every bounce runs into resistance, and every dip finds buyers waiting. It’s the kind of market that feels awkward to trade because nothing follows through. Momentum traders lose interest, and the broader narrative around LINK goes quiet.
That’s exactly why this phase is important. LINK isn’t falling apart. Buyers are clearly defending the $12–$13 area, and sellers haven’t managed to push the price meaningfully lower. At the same time, buyers aren’t quite strong enough yet to break through the top of the channel. The market is paused, not weak.
This setup is nothing new for Chainlink. In past cycles, similar low-volatility stretches showed up near the end of long consolidation periods. Volume dried up, momentum flattened, and the price went nowhere long enough for most people to stop watching. When that happened, LINK often moved once expectations were low and positioning had thinned out.
On-chain data backs this up. Market cap has been creeping higher, active addresses are still rising, and transfer activity looks steady. That points to ongoing network use and gradual positioning, not speculation or large-scale selling.
So what comes next for LINK?
At this point, structure matters more than hype. As long as the LINK price holds its support zone and continues tightening beneath resistance, the setup stays intact. A move toward $14.63 with stronger volume would start putting real pressure on sellers.
Right now, LINK isn’t grabbing headlines. Price is grinding, volatility is low, and excitement is missing. But those quiet phases are often when things start to shift, especially for an asset that tends to move once the market stops paying attention.

Can #SNX Recover From Here or Will it Continue to Fall?Yello, Paradiser! Are you prepared for the moment when #SNXUSDT finally decides whether it will punish late bears or wipe out impatient longs? Let's look at the #Synthetix trade setup:
💎#SNX is currently trading around $0.418 on the 4H timeframe and remains stuck inside a clearly defined descending channel, respecting both the descending resistance and descending support with high precision. This type of structure tells us one thing very clearly: the market is compressing, and a decisive move is getting closer.
💎Price is now sitting just above a key demand zone around $0.38–$0.39, where buyers have already shown interest multiple times. This zone is crucial. As long as #SNXUSD holds above it, bulls still have a chance to regain control. The chart also highlights that a clean breakout above the descending resistance, combined with a reclaim of the 50 EMA as support, would significantly increase the probability of a bullish continuation.
💎If that bullish scenario plays out, the first upside target sits at the moderate resistance near $0.51, followed by a much more important strong resistance around $0.60–$0.61. A move toward those levels would likely happen fast, as many traders are currently positioned defensively and would be forced to react to a breakout.
💎However, this setup comes with a very clear invalidation. If price loses the $0.38 support zone decisively, the bullish idea is off the table. A breakdown below this level would confirm weakness and open the door for a deeper move toward the $0.33 support zone, where the next significant liquidity sits. That scenario would likely come with increased volatility and emotional selling from inexperienced traders.
Trade smart, Paradisers. This setup will reward only the disciplined.
MyCryptoParadise
iFeel the success🌴

TOTAL3/BTCTOTAL3/BTC is holding very good and continue to breaks the resistance very likely in the coming weeks. All-season may be so close

BTC/USDT | Going higher? (READ THE CAPTION)In the 4H chart of BTCUSDT we can see that it finally broke through the bearish OB and going into the FVG zone, reaching 94,789, and it swept the liquidity pool above the 94,700 level, but it dropped in price afterwards and is now being traded at around 93,300. I expect BTC to retest the FVG again.
Current targets for now: 94,100, 94,800, 95,500 and 96,200.

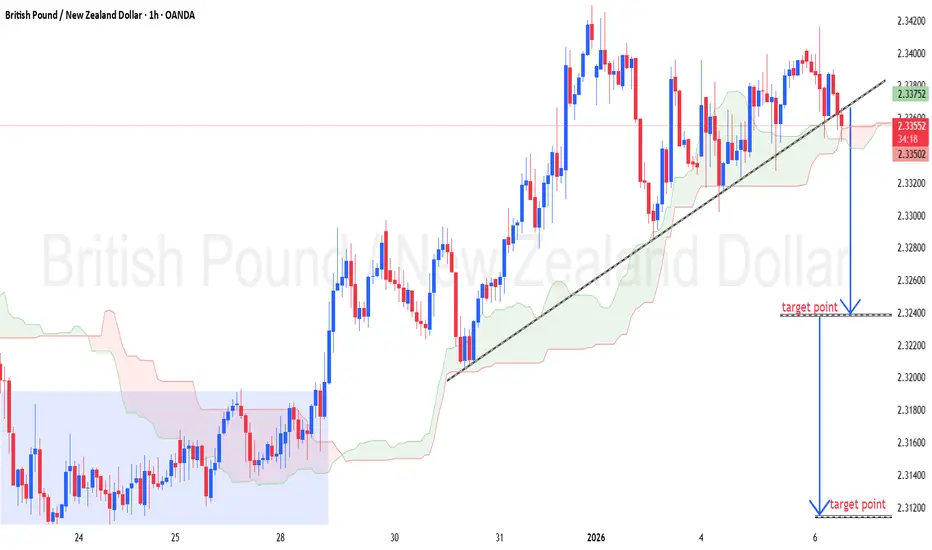
GBPNZD (H1) – Chart pattern...GBPNZD (H1) – Chart pattern.
My shared (trendline break + price under support):
Sell targets:
🎯 TP1: 2.3200
🎯 TP2: 2.3100
Invalidation / SL idea:
❌ Above 2.3450 (recent high & trendline area)
Bias stays bearish as long as price remains below the broken trendline.
If my want, I can also give entry + SL + risk setup clearly.
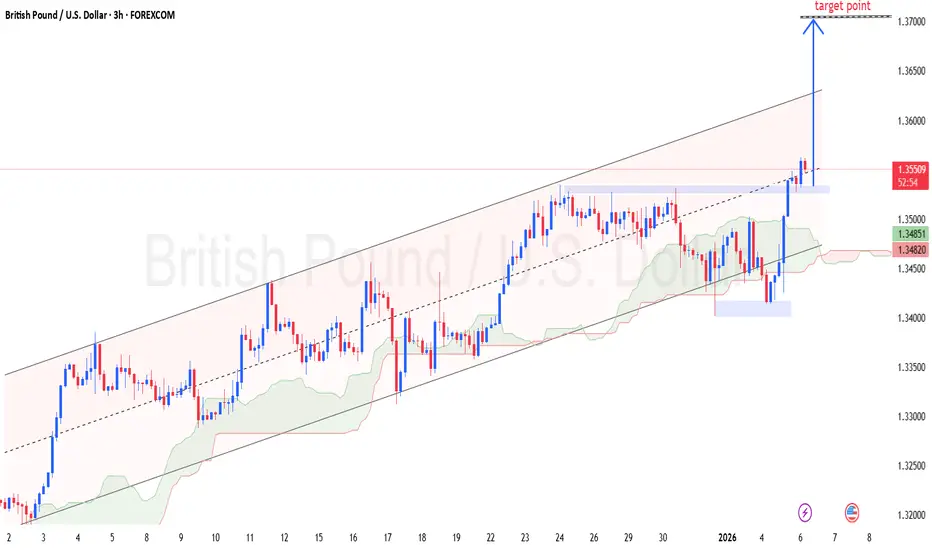
GBPUSD – (3H) Chart pattern...GBPUSD – (3H) Chart pattern.
📍 Current price area: ~1.3550
📊 Structure: Ascending channel + bullish continuation
🎯 Targets
TP1: 1.3600 (recent structure / minor resistance)
TP2: 1.3650 (channel mid–upper zone)
TP3 (final): 1.3700 🎯 (upper channel target point my marked)
🛑 Stop Loss
SL: 1.3480 – 1.3500 (below demand zone & cloud support)
🧠 Trade Logic
Strong bullish impulse from demand
Price holding above Ichimoku cloud
Clear upside space to upper channel
✅ Safe plan: Partial at TP1, move SL to BE
🔥 Aggressive: Hold till 1.3700 with trailing SL
If my want, I can give exact entry, RR ratio, or scalp version.
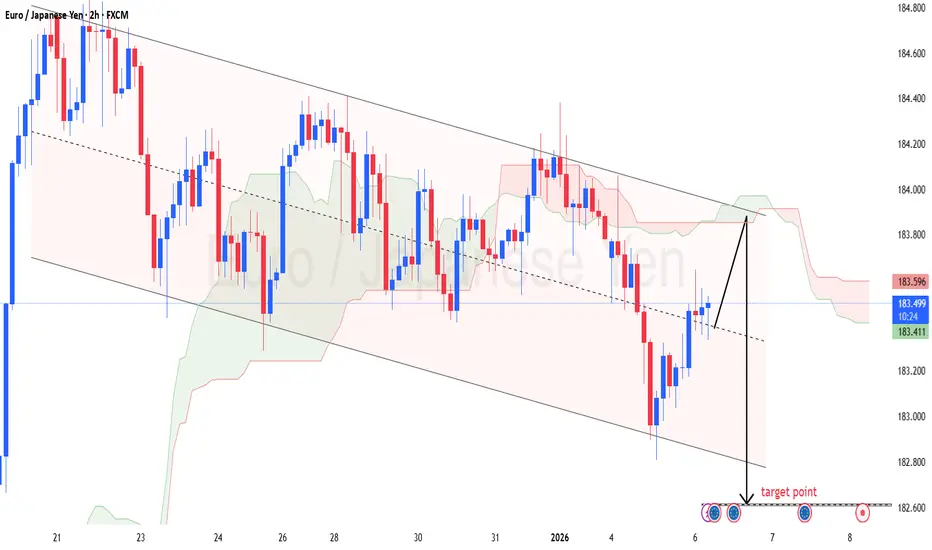
EURJPY – 2H Chart Pattern...EURJPY – 2H Chart Pattern.
📍 Current area: ~183.45
TP1: 183.85 (near dashed mid-channel / minor resistance)
TP2: 184.10 (Ichimoku cloud top + structure)
TP3 (extended): 184.35 – 184.50 (upper channel resistance)
🛑 Stop Loss
SL: 182.95 – 183.00 (below recent swing low & channel support)
🧠 Logic
Price bounced from lower channel support
Bullish correction inside a descending channel
Upside room till cloud + channel top
👉 Conservative traders: book partial at TP1
👉 Aggressive traders: hold for TP2–TP3 with trailing SL
If my want, I can also give exact entry, risk–reward, or scalp setup.
BTC Update — Rising Risk of a Pullback Toward 85KBTC Update — Rising Risk of a Pullback Toward 85K
Last update with Data proven trend.
Bitcoin is currently trading inside a strong resistance / supply zone around 93–94K, where price is starting to show signs of exhaustion after a sharp impulsive move up.
What the Chart Is Showing
📉 Rejection risk at resistance: Price is pushing into a heavy supply zone with limited follow-through.
🧱 Weak continuation structure: Momentum is slowing, and upside progress is becoming inefficient.
🔄 Distribution signals: The current range suggests potential distribution rather than accumulation.
Bearish Scenario (High Probability)
If BTC fails to hold above the 92–93K zone, a deeper correction becomes likely.
The projected move points toward the 85K area, which aligns with:
Previous demand
Liquidity resting below recent lows
A clean reset level for structure
Key Levels to Watch
93–94K: Major resistance / invalidation zone for shorts
92K: Short-term support — loss of this level increases downside momentum
85K: Primary downside target and potential bounce zone
Summary
At this stage, BTC has a high probability of rolling over from resistance.
Unless price reclaims and holds above 94K with strong volume, the path of least resistance points down toward the 85K zone.
📌 Caution is advised — this looks more like a pullback phase than a breakout continuation.

ETHEREUM: Crucial Formation, Important Levels to Watch!Hello There,
on the short-term perspective Ethereum is forming crucial bearish pressure which could be decisive within the near future. While Ethereum remains the second largest cryptocurrency, it is recently forming crucial formations that should not be underestimated. In the past weeks, trading actions already showed major selling pressure occurred from whales dropping their ETH on the market. Now, there is an important formation forming, which could be the setup of a determined continuation. Especially when the levels confirm this will likely lead to an exaggerated price move.
When looking at the chart, we can see Ethereum is now trading within this major downtrend channel in which it already formed major bearish pressure. Furthermore, it formed a bearish EMA crossover to the downside, confirming the bearish trend. The several lower lows of the bearish trend mark the significance of this condition. Now, within the past few days, Ethereum set up to form a bear flag formation within the downtrend.
Within this bear flag formation, Ethereum already completed the initial waves A and B of the inner bear flag formation. Now with wave C, Ethereum is likely to move into the upper resistance zones. There is a major resistance zone within the upper boundaries of the channels. Several resistances come together, such as the upper boundary of the descending channel, the upper boundary of the bear flag, and the horizontal resistance line.
With a bounce into this area, which should be expected within the next times, Ethereum is entering a really crucial zone from where a pullback is highly likely. Especially when more and more whales enter the market and short sell, a pullback from this area will be an origin for bearish pressure towards the downside. The whole bear flag formation will be confirmed with a breakout below the lower boundary of the flag formation.
Once this formation has been completed, the targets as seen in my chart will be activated. From there on, a bearish continuation could also be likely if Ethereum does not manage to reverse in this area. In any case, this will be a highly important area to watch out for. Currently, it is important to consider the next phases of development and how Ethereum reacts to the resistance zones. The bearish price pressure should not be underestimated in any case.
With this being said, it is great to consider the important trades upcoming.
We will watch out for the main market evolutions.
Thank you very much for watching!

05/01/26 Weekly OutlookHappy new year everyone!
As 2026 begins BTC bulls will be looking to continue last weeks momentum continuing this LTF rally from mid $80,000's towards 2025's yearly open of $93,300.
Liquidity in theory should support this continuation move as year end window dressing is over, the Fed have begun to inject cash into the markets again having ended QT. It is also important to note that BTC ETF's had a net inflow of $460m last week which does look positive for the bulls.
This week I would be looking very closely at weekly high and any price acceptance above that level. That would mean $100,000 major resistance level is the next step for this rally but it is a huge hurdle to jump, with $108,000 being an even bigger one after that.
Should the weekly high fail to hold once again a rangebound SFP play is the logical move, with midpoint ($89,300) and weekly low (86,800) the targets for the bears.

TOTAL MARKET CAP – UpdatePrice is still reacting exactly as planned.
My bias remains unchanged.
3.22T remains my primary target
This level aligns with the 50% Daily retracement
Also a key area of previous liquidity + resistance
As long as price trades below this zone, this move still looks like a retracement within a higher-timeframe range, not a confirmed continuation.
Once 3.22T is tapped, I’ll re-evaluate the thesis and start watching for possible short setups, depending on reaction and structure.
No rush. Let price come to you.
What do you expect to happen at 3.22T: clean breakout or rejection?
MrC

BTC Update — 92K Zone as Bull Run Trigger (100K+ Scenario)Bitcoin is approaching a critical decision zone around 92K, which is acting as a major pivot for the next macro move. Price action shows consolidation and higher acceptance just below resistance, suggesting strength is building rather than distribution.
Why 92K Matters
📍 Key reclaim zone: 92K has historically acted as a strong resistance/support flip.
📈 Structure shift: Sustained trading above this level would confirm a higher high on the intraday structure.
🔊 Volume context: Current compression indicates that once volume expands, the move could be fast and directional.
Bullish Scenario
A confirmed breakout and hold above 92K can be the start of a broader bull phase.
From this zone, BTC has a high probability to accelerate toward 100K+, with momentum-driven extensions possible once psychological resistance is cleared.
Pullbacks above 92K would likely be seen as retests, not reversals.
Invalidation / Risk
Failure to hold 92K after a breakout would delay the move and keep BTC range-bound.
As long as price holds above the current base, downside risk remains controlled.
Summary
This 92K zone is the ignition level.
If BTC accepts above it with volume, the market structure opens the door for a strong bullish continuation toward 100K and beyond.
📌 Patience here is key — confirmation turns this zone into the launchpad.

OKB - Quiet Accumulation Before the Next Move?OKB has been through a long corrective phase, grinding lower inside a descending channel.
What stands out now is context.
Price is sitting on a major demand zone, a level that previously sparked strong upside momentum.
Since tapping this area, sellers have clearly slowed down, and price has started to compress rather than continue lower. That’s usually the first sign that selling pressure is getting absorbed.
At the same time, OKB is now pushing back toward the key structure above. This is the line in the sand.
As long as we’re holding above demand, I’m not interested in chasing shorts down here.
🏹For bulls to truly take over , we’ll need a clean break and acceptance above the orange structure zone. That’s when momentum shifts from defensive to offensive.
Until then, we wait :)
⚠️ Disclaimer: This is not financial advice. Always do your own research and manage risk properly.
📚 Stick to your trading plan regarding entries, risk, and management.
Good luck! 🍀
All Strategies Are Good; If Managed Properly!
~Richard Nasr

EURUSD Short: Supply Holds Strong - Market Eyes 1.1680 DemandHello traders! Here’s a clear technical breakdown of EURUSD (3H) based on the current chart structure. EURUSD is trading within a broader bullish structure, supported by a well-defined ascending trend line that has guided price higher from the previous pivot low. Earlier, the market spent time consolidating inside a range, indicating accumulation before the upside expansion. A strong impulsive breakout from this range confirmed buyer control and triggered a bullish continuation move. As price advanced, EURUSD reached a key Supply Zone around 1.1750–1.1760, where selling pressure became visible. Multiple attempts to push above this area resulted in fake breakouts, clearly signaling buyer exhaustion and the presence of strong sellers at higher levels. The chart highlights several failed breakouts and rejections from the supply line, reinforcing this zone as a critical resistance.
Currently, after the rejection from the upper highs near the pivot point, price broke below the short-term structure and is now trading below the supply line, suggesting a loss of bullish momentum. The recent bounce appears corrective rather than impulsive, indicating that the market may be preparing for a deeper pullback rather than immediate continuation higher. Below current price, the Demand Zone around 1.1680 stands out as the next major downside target. This level previously acted as support and aligns with a key horizontal demand area where buyers may attempt to step back in. A move toward this zone would represent a healthy correction within the broader structure.
My scenario: as long as EURUSD remains below the 1.1750 Supply Zone and continues to respect the descending supply line, the short-term bias favors sellers. I expect downside continuation toward the 1.1680 Demand Zone. A strong bullish reaction from demand could lead to consolidation or a corrective bounce, but a clean breakdown below 1.1680 would signal a deeper bearish correction. For now, price is at a key decision area, with sellers in control below supply and demand acting as the main downside objective. Manage your risk!
