ETH / EUR – 1H, and the structure is pretty clean.ETH / EUR – 1H, and the structure is pretty clean.
What I’m seeing
Strong bullish ascending channel
Price is reacting from the lower channel + demand box
Ichimoku cloud support holding
Momentum push already started from the demand zone
So bullish continuation is the higher-probability play 📈
🎯 Targets (Bullish)
Target 1 (TP1 – conservative):
➡ 2,000 – 2,020 EUR
(mid / psychological level + first resistance)
Target 2 (TP2 – main):
➡ 2,120 – 2,150 EUR
(previous high + channel resistance — your first marked target)
Target 3 (TP3 – extended):
➡ 2,250 – 2,280 EUR
(upper channel projection — your second marked target)
🛑 Invalidation / Safety
Hourly close below: 1,760 EUR
Below that, bullish structure weakens and targets delay.
Quick Trade Logic
Buy from demand + channel low
Ride trend until upper channel
Scale partial profits at each target 💰
Crypto

Xauusd 1H chart Pattern.descending triangle / falling wedge squeeze, and price is already breaking upward from the apex with demand support around 4855–4860.
🎯 Targets (Bullish Breakout)
Immediate Target (T1):
➡ 5,100 – 5,120
(previous structure + mid resistance)
Main Target (T2):
➡ 5,200 – 5,230
(matches my marked zone on the chart)
Extended Target (T3 – momentum continuation):
➡ 5,480 – 5,520
(full pattern height projection + higher TF resistance)
🛑 Invalidation / Risk Level
Break & hold below: 4,850
That would weaken the bullish structure and delay targets.
📌 Trade Logic Summary
Structure: Compression → breakout
Cloud support holding
Higher lows forming
Targets you drew are technically valid ✅

Hedera: bounce or trap? key levels and targets for the days aheaHedera Hashgraph. Who else just watched that crazy liquidation wick and thought: "ok, someone big just hit the panic button"? After the broad alt selloff, HBAR flushed into the 0.07s and instantly got bought back, and according to industry sources the project is still on the radar for enterprise and tokenization plays, so the market clearly defended those lows.
On the 4H chart we’ve got a sharp V-reversal from the 0.075 area, huge volume, and RSI has ripped out of oversold to around 60. Price is reclaiming the main volume node near 0.09, aiming straight at the first thick supply zone around 0.098-0.105. With that combo I’m leaning toward a short term long bounce instead of fresh lows.
My base case: while HBAR holds above 0.088-0.089, I’m looking for a move to 0.10 first, with extension toward 0.104-0.107 where I’d start unloading longs. I’m stalking entries on dips into 0.09 with a tight invalidation under 0.088. If that support cracks and we close back under the volume cluster, this turns into a failed bounce and opens the door back to 0.08 - I might be wrong, but the current bounce setup looks too juicy to ignore. ✅

HOT Near Lower Channel Support, Liquidity Zone in FocusHOT continues to trade inside a clear descending channel on the higher time frame and is currently positioned near the lower boundary of the structure.
Price action suggests the market may revisit the previous wick around 0.000314, which sits inside a known liquidity zone. A move into this area could act as a liquidity sweep toward the lower boundary of the larger channel, before any meaningful reaction develops.
As long as HOT remains below channel resistance, the structure stays bearish. A deeper sweep into lower support would still be technically valid within the trend. Only a strong reclaim back above the channel mid-range would start to shift short-term momentum.
This is a high-sensitivity zone where volatility is expected.

Bitcoin - Pullback LevelsOn the larger timeframe, Wave 3 of the decline has been completed.
Locally, within this third wave, the fifth subwave has been completed.
We are currently in an upward corrective move. Let’s define the main targets.
Key targets:
75,000 - local correction
82,000
85,000
The potential move from the current level is 15-30% .
There is also an unfinished sub-division around 55,000 , but it appears unlikely.
---
Subscribe and leave a comment.
You’ll get new ideas faster than anyone else.
---

Stellar: bounce ahead or more pain? key levels to watchStellar. Knife catching or discount hunting? Recently the whole alt sector got hit as traders rotated out of risk after fresh macro comments, and according to market news Stellar just rode that same liquidation wave. Price flushed into fresh lows, sentiment is in the gutter... exactly where interesting bounces usually start.
On the 4H chart we have a waterfall drop into the 0.15 area with a volume spike and RSI buried in oversold, starting to curl up. Local HVN sits around 0.17, so any short squeeze has a natural magnet there, with heavier supply stacked higher near 0.185-0.19. Technically I lean to a relief long scenario, not a fresh trend reversal yet. ✅
My base plan: watch 0.15-0.152 as a bounce zone, with intraday targets at 0.17 first, then 0.185 if buyers stay brave. If 0.145 gives way and price can't reclaim 0.16 quickly, I drop the long idea and expect continuation toward 0.14-0.135 instead. I might be wrong, but this looks more like late capitulation than a comfortable place to open new shorts, so I’m only interested in tactical longs here with tight risk.

Chainlink: bounce or break? key levels to watch aheadChainlink. Who’s trying to catch this falling knife and actually grab the handle? After the latest risk‑off wave in crypto, LINK got hammered as traders rotated out of DeFi names, and according to market chatter funding flipped heavily negative and sentiment went full doom mode.
On the 4H chart we’re in a clean downtrend, but the last leg looks like a selling climax: long lower wick, big volume, RSI stuck in oversold around 25. Price is sitting below a fat volume node around 8.8–9.0 that used to be support and now looks like the first serious supply zone. So my base case is a relief bounce into that 8.8–9.5 pocket before bears decide what’s next.
✅ Plan: I’m only interested in a counter‑trend long if price holds above 8.0 and starts building a small base, with targets 8.8 then 9.5. ⚠️ If 8.0 gives way on strong volume, I expect a slide toward 7.2–7.0 where the next demand cluster sits. I might be wrong, but shorting straight into an exhausted dump has rarely been a profitable hobby for me.

[BTCUSDT] Bearish Bias · Techincals → ICT ConceptsFundamental Point of View:
We just had neutral data for FOMC.
We might get a strong nfp for usd.
Technical Point of view
We have a strong Resistance of 8100 If it stays strong we can see a little bearish pressure till 71k.
Better Sells are after a retest of POI.
setup fails if we break POI and break a new higher high in a small Time Frame like 1H or 15m.
**Key notes to keep in mind:**
1. BTC is already in a bearish trend.
2. we have broken a 4H Low which is the POI now and might get retested times before playing the sell move again.
3. we can look for 57K in this week or next week
**Current Market Overview:**
Technically we have broken our last Low and its now a point of interest for sellers.
Fundamentally we are bearish as we dont
lets take a look at different Time frames
**1Week TF:**
We have a strong POI for sellers at 72k If price touches it and stays strong we can see a little bearish pressure till 57k.
Better Sells are after a retest of POI.
setup fails if we break POI and break a new higher high in a small Time Frame like 1H or 15m.
**1D TF:**
We have POI close which will be triggered today for sellls. and sell side liquidity might taken out.
**4H TF:**
keeping eye on the candle breaks we have clean range on the left side.
**1H TF:**
we are currently at no trading zone but will see reaction when it starts moving
**Overall Scenario:**
we are looking for Sells only if we are respecting the 4H POI and breaking Sell side liquidity is another opportunity to trade.
**How will setup fail?**
simple if 4H Poi is broken and a small higher high breaks in 15 min or 1H.

TOTAL Market Cap — Weekly UpdateThe market delivered a strong downside displacement and fully mitigated the weekly orderblock that originated after the US election rally.
That means the entire prior expansion move has now been neutralized and liquidity below the range has been taken.
Price is currently reacting from the next higher timeframe demand zone.
Current situation
Upper weekly OB: taken & mitigated
Price swept sellside liquidity
Reaction from lower weekly demand
Large imbalance left above price
What this means
After a vertical move down, markets usually don’t instantly reverse.
They first stabilize.
So this area is a reaction zone — not yet confirmation of a new uptrend.
As long as price stays below the broken range, market structure remains weak.
Only reclaiming higher levels would indicate strength returning.
Simple plan
Hold current demand → stabilization phase
Reclaim prior range → recovery structure
Fail demand → continuation lower
Right now the market is transitioning, not trending.
Do you expect consolidation here or another expansion leg first?
MrC

SOL / USDT — Daily Update (Follow-up)After rejecting the prior resistance zone, price accelerated down and tapped the next higher timeframe support area.
The previous range support failed and turned into resistance — confirming continuation pressure.
Current situation
Major support: ~70 – 80
Resistance: ~125
Major S/R flip: ~140 – 145
Structure: bearish continuation after breakdown
What this means
The market moved from distribution into a displacement phase.
Now price is testing a historical demand zone where reactions normally happen.
This is where either:
A relief rally starts
Or the downtrend expands
Simple plan
Hold 70–80 → bounce toward 125 possible
Reclaim 125 → short-term strength returns
Reclaim 140+ → structure improvement
Lose 70 → continuation lower
Currently price is reacting, not reversing.
Do you expect SOL to form a base here or continue trending down?
MrC

LINK / USDT — Daily Update (Follow-up)Price continued the downside after the previous update and tapped the lower liquidity zone.
The large wick has now been **fully filled**, meaning the market removed the imbalance and reached a reaction area.
Current situation
Local support: ~7.5 – 8.2
Reclaim level: ~12.2
Major S/R flip: ~18
Structure still bearish (lower highs & lower lows)
What this means
Right now this is a classic decision point:
After liquidity is taken, the market either bases → relief rally, or continues the macro downtrend.
Holding the current level could start a short-term recovery.
But without reclaiming 12.2, it remains only a bounce inside a bearish structure.
Simple plan
Hold 7.5–8.2 → relief move possible
Reclaim 12.2 → market strength returning
Fail to hold → continuation lower likely
So far this looks like a reaction, not a confirmed reversal.
Do you expect a bounce back into resistance or another sweep below support first?
MrC

RENDER / USDT — Daily UpdateAfter the strong impulse move up, price has now retraced and filled all imbalance (FVG) zones created during the rally.
This usually means the market finished correcting inefficient price action and is moving back into equilibrium.
Current situation
Major support: ~1.20 – 1.30
All bullish FVGs below price → filled
Momentum cooled down after distribution at highs
What this means
With imbalances cleared, the chart is no longer in a forced correction phase.
Now the level itself matters:
If support holds → accumulation range likely
If support breaks → continuation of the macro downtrend
Simple plan
Hold above 1.20 → base formation possible → recovery when market strength returns
Lose 1.20 → next liquidity sits lower → bearish continuation
First bullish confirmation → reclaim prior breakdown area (~1.60 zone)
Right now this is a reaction zone, not yet a reversal.
Do you expect buyers to defend this level or will liquidity below get taken first?
MrC

ENA / USDT — Daily Update (Follow-up)Price kept respecting the bearish structure after the previous update.
The rejection at the trendline confirmed sellers are still in control and the market moved back into the lower range.
Current situation
Local support: 0.095 – 0.115
Mid level to reclaim: 0.131
Key S/R flip: ~0.20
Still trading below descending trendline → bearish pressure remains
What this means
Holding below 0.131 keeps the chart weak → continuation range / grind down likely.
A reclaim of 0.131 opens room for a relief move into 0.20 S/R flip area.
Only above 0.20 the structure actually starts improving.
Simple plan
Below 0.131 → bearish / ranging
Reclaim 0.131 → bounce potential
Reclaim 0.20 → trend shift signal
Market now deciding between accumulation at lows or continuation.
MrC

ETH - V Reversal - Livermore Accumulation Cylinder to ATHLivermore accumulation cylinders are my bread and butter. ETH just posted it's final low into a 5+ year liquidation zone within a livermore accumulation cylinder
All of the on-chain liquidations are decimated, there are no more forced sellers.
Up only from 1739.

QNT Quant Cryptocurrency Buy AreaQNT Quant is not a bad project, but still not a buy for me!
In my opinion, QNT (Quant) crypto appears to address a significant challenge in the blockchain space by focusing on bridging disparate blockchains. The ability to create multi-chain applications or mApps using Quant seems promising, as it enables enhanced usability and communication between different blockchain networks. This is particularly crucial in the cryptocurrency landscape, where interoperability and seamless connectivity among various projects and platforms can greatly benefit the industry as a whole. By facilitating cross-blockchain communication, Quant has the potential to unlock new possibilities for developers and users, fostering innovation and efficiency within the decentralized ecosystem.
I have a large buy area in which I'm willing to average down if it`s the case: $41 - $71.
looking forward to read your opinion about it.

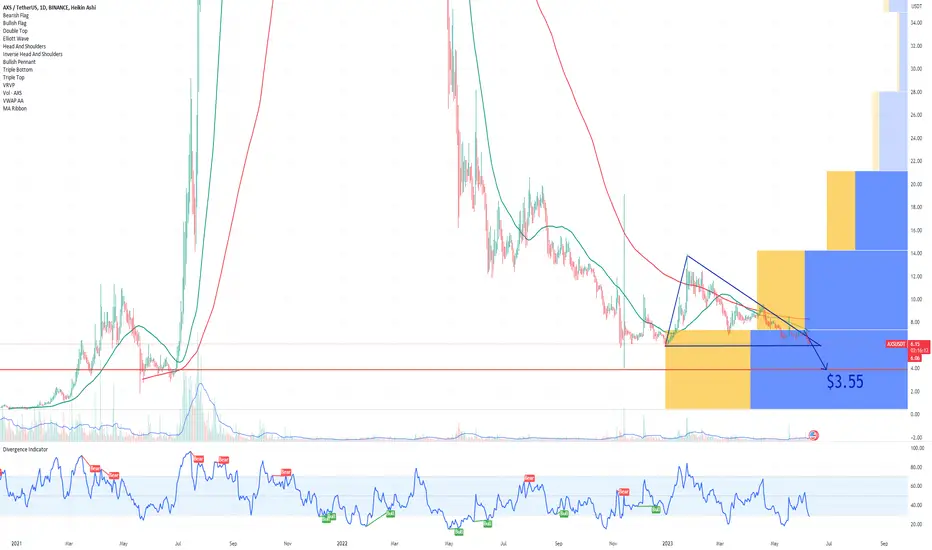
AXS Axie Infinity Triangle Formation BreakdownI don`t know if you have seen my preview AXS chart that had more than 500 Likes:
In its recent case against Binance, the SEC introduced 10 cryptocurrencies into the securities classification: BNB (BNB), Binance USD (BUSD), Solana (SOL), Cardano (ADA), Polygon (MATIC), Cosmos (ATOM), The Sandbox (SAND), Decentraland (MANA), Axie Infinity (AXS) and COTI (COTI).
The AXS (Axie Infinity) cryptocurrency recently experienced a breakdown of a triangle formation, signaling a potential bearish pattern. A triangle formation is a common technical chart pattern characterized by converging trendlines, indicating a period of consolidation before an anticipated breakout.
In the case of AXS, the breakdown of the triangle formation suggests a shift in market sentiment towards a bearish bias. This breakdown occurs when the price falls below the lower trendline of the triangle, indicating a potential continuation of the downtrend or a decline in price.
Traders and investors who closely monitor technical patterns may view the breakdown of the AXS triangle formation as a bearish signal, potentially prompting them to consider short positions or adjust their existing trading strategies accordingly.
Considering the above, my prite target for AXS Axie Infinity is $3.55, its strongest support.
Looking forward to read your opinion about it.
FLOKI Potential Correction Soon ! RSI at 99If you haven't read my article about meme coins:
Then the heightened RSI level of 99 for FLOKI signals a potential correction on the horizon.
Such an extremely high RSI often indicates overbought conditions, suggesting that the asset may be due for a pullback.
The price target, as per the Fibonacci retracement tool, is: $0.00000697

BTC - View from 02/05/2026Good evening! Today was published: 🔖 Job Openings and Labor Turnover Survey (#JOLTS) USA 📉 Actual: 6.542M | Forecast: 7.200M | Previous: 6.928M
A lower-than-expected reading, such as 6.542M for December 2025 (versus the expected 7.2M and down from the revised 6.9M in November), signals declining labor demand and potential economic weakening. This could influence #Fed interest rate decisions in several key ways:
▪️Reduced inflationary pressure: Fewer job openings often mean less competition for workers, which can slow wage growth and reduce the risk of wage-driven inflation. If the Fed sees this as evidence that inflation is under control or approaching the 2% target, it may feel more comfortable cutting rates to support growth without triggering new price spikes.
▪️Supporting employment and growth: The Fed's dual mandate includes maximum employment. A cooling labor market may raise concerns about rising unemployment or slowing hiring in the future, prompting the Fed to cut rates to stimulate borrowing, investment, and consumer spending, thereby promoting job creation.
▪️Market expectations and forward guidance: Such data often shift investor bets on the rate trajectory. For example, if this JOLTS miss aligns with other weak indicators, it could increase the probability of a rate cut at the next FOMC meeting. On the other hand, if inflation remains sticky, the Fed may hold rates or delay cuts to avoid overstimulation.
Overall, such data tilts the balance toward "dovish" policy (rate cuts) rather than "hawkish" (hikes or holds), but the Fed weighs them in the context of a broader data set, including CPI, PCE inflation, and global factors.
👀 What to watch:
➡️ Nonfarm Payrolls (#NFP) – Feb 11 and Unemployment Rate – Feb 6 for January 2026: Employment growth of 60–70K jobs is expected, with unemployment at 4.4%. If the data comes in weaker than expected (fewer new jobs or rising unemployment), it will confirm the cooling trend and strengthen expectations of Fed rate cuts.
✔️ ADP National Employment Report: Already released on February 4 (yesterday). This is a private employment indicator, often preceding NFP. If it showed weak growth, that's an additional signal. 📉 Actual: 22K | Forecast: 46K | Previous: 37K
✔️ ISM Non-Manufacturing PMI: Shows activity in the services sector. A slowdown here would confirm the overall cooling trend. ↗️ Actual: 53.8 | Forecast: 53.5 | Previous: 53.8
✔️ Weekly Jobless Claims: Weekly unemployment benefit claims. Rising claims would indicate a deteriorating labor market. 📉 Actual: 231K | Forecast: 212K | Previous: 209K
➡️ Employment Cost Index (#ECI) for Q4 2025: February 10. Shows wage growth. If growth slows, it will ease inflationary pressure and support the case for rate cuts.
➡️ #CPI and #PCE Inflation: January CPI – February 13, PCE – later. If inflation declines or stabilizes below 3%, it will give the Fed room to cut rates.

BTC/USDT | Going below 70,000?! (READ THE CAPTION)Well, BTCUSDT has been on a downtrend for a while and is still going lower, and it hit 70,140! The last time BTC has been in this range was in November of 2024! It is currently being traded at 71,600. BTC might hit the bullish OB and then make an upwards move. But if it fails to go back up, the targets are: 70,900, 70,100, 69,300 and 68,500.
Bullish targets: 72,000, 72,800, 73,600 and 74,400.

XRP Macro triangle was complete!CRYPTOCAP:XRP
Triangles are patterns found before a terminal move in Elliot Wave theory. We can see 5 waves up on weekly bearish divergence completing that terminal move.
Price is expected to retrace to the triangle EQ after that move. Thats the $0.51 High Volume Node, 60% lower form here.
Don't shoot the messenger.
Safe trading

BTCUSD: bounce setup from 70K🛠 Technical Analysis: On the H4 chart, BTCUSD remains in a broader bearish phase after the marked “global bearish signal”. Moving averages confirm the downtrend: price is below the SMA 50/100/200 cluster. At the same time, BTC is now pressing into the long-term support band near 70,000 , where a short-term stabilization and bounce becomes more likely. The current structure suggests a potential relief move if buyers reclaim the nearby pivot and hold above it. A confirmation above 72,736 would strengthen the bounce scenario toward the next upside objective around 77,122. Failure to defend the 70,000 base increases the risk of continuation lower and invalidates the corrective-long idea.
———————————————
❗️ Trade Parameters (BUY)
———————————————
➡️ Entry Point: Buy on confirmation above 72,736.05
🎯 Take Profit: 77,121.79
🔴 Stop Loss: 68,422.21
⚠️ Disclaimer: This is a potential trade idea based on current analysis; market conditions and price direction are subject to change based on news factors and volatility.

BTC Outlook / Breakdown and Retest SetupBitcoin saw an impulsive breakdown after failing to hold the prior consolidation range. Once acceptance was established below the mid-range, downside momentum expanded quickly, leaving price stretched relative to recent structure.
The yellow and green levels above represent prior support and value areas where price previously spent time consolidating. These zones are now likely candidates for a retest from below, should relief or short-covering occur.
From a structural perspective, a move back into those levels would not invalidate the current bearish leg. Instead, it would be consistent with a breakdown and retest scenario, where former support acts as resistance.
As long as price remains below those zones, the broader bias stays to the downside. Any upside reaction into that area should be evaluated on acceptance and follow-through, not assumed strength.
For now, momentum favors continuation, while the yellow and green zones define the most important areas to watch for a potential reaction or rejection.

EURUSD Is At Strong SupportEURUSD is showing a strong structural bullish setup after reclaiming the key horizontal zone that previously acted as resistance and has now flipped into support, with current price action forming a tight holding pattern above that level rather than rolling over. The way price respected that demand area and stalled around it reflects accumulation and structural higher lows, signaling buyers are still in control, and this enhances the probability of continuation toward higher targets once global risk sentiment stabilizes. From a fundamental view, the euro has been supported by resilient eurozone macro data and relative stabilization in monetary expectations, while the US dollar has faced persistent pressure from softer inflation components, shifting rate cut expectations, and a dovish tilt creeping back into Fed pricing — all of which are key drivers behind the bullish narrative in the pair. Technically this aligns with breakout retest dynamics and trend continuation forces, so as long as EURUSD holds above the support level and maintains bullish structure, the higher probability scenario remains upside continuation rather than reversal, offering a clean trend-aligned opportunity for disciplined traders.
