LINEAUSDT plan 12-02-26LineaUSD plan 12-02-26
The price has pumped and there's a rejection in the supply area.
There, we can try setting a pending sell limit in the supply area.
Because it's not at the high end, we can adjust the order size to avoid excessive risk.
Cryptocurrency

ICP: waiting for a flush? key levels and targets for the days ahICP. Waiting for one more flush before the real move? Recent headlines about regulators eyeing alt projects plus a boring Bitcoin range keep sucking liquidity out of mid caps, and ICP has been quietly bleeding back to the 2.3 zone. According to market chatter, funds keep rotating into majors, leaving charts like this one oversupplied on every bounce.
On the 4H chart price sits under a fat resistance cluster around 2.4–2.6, right below the main volume node, while RSI hangs near 40 and can’t get above 50. Trend is still a clean staircase down, so I’m leaning to the downside over the next sessions, expecting a retest of the green support near 2.1 and maybe the 2.0 psychological level. I might be wrong, but for now every pump looks more like exit liquidity than accumulation. ⚠️
My base plan: watch for a rejection in the 2.4–2.5 area to hunt shorts toward 2.15 then 2.0, with invalidation if we get a strong 4H close above 2.6. If bulls suddenly reclaim 2.6 on volume and RSI pushes back over 50, that flips the script and opens the way to 2.8–3.0 where the next big supply zone waits. I’m staying flat until price tags one of these levels instead of chasing in the middle.

BITCOIN Is $50000 inevitable??Bitcoin (BTCUSD) is again on the downturn after almost reaching its 1W MA200 (orange trend-line) just last week. One would thought that long-term buyers would make their presence clear on this historically supportive level but so far their absence is more than emphatic. If this continues, the market eyes the next critical Support level, the 1W MA350 (red trend-line), which is where the previous 2022 Bear Cycle bottomed.
In fact, we identify a quite similar pattern on BTC's last three major correction events (2022 Bear Cycle and late 2019 - early 2020 on COVID flash crash). As you can see a Double Top rejection followed by a Higher Lows trend-line bearish break-out has been the common pattern on all (including the current correction). The previous two both broke below the 1W MA200 and their respective 1.618 Fibonacci extension levels, with the 2022 fractal bottoming just above the 1.786 Fib ext while the 2020 below it. In both cases, the 1W MA350 held.
As a result, if buyers continue to be absent and BTC is getting heavily sold after every short-term rally, we can expect the market to target $50000, which isn't just the next psychological level but also just above the current 1.786 Fib and will still be above the 1W MA350 (based on its current trajectory).
So do you think a $50k test is inevitable at this point? Feel free to let us know in the comments section below!
---
** Please LIKE 👍, FOLLOW ✅, SHARE 🙌 and COMMENT ✍ if you enjoy this idea! Also share your ideas and charts in the comments section below! This is best way to keep it relevant, support us, keep the content here free and allow the idea to reach as many people as possible. **
---
💸💸💸💸💸💸
👇 👇 👇 👇 👇 👇

Bitcoin Cash: Signs Of A Potential Bottom FormingBitcoin Cash (BCH) appears to be in the final stages of a higher-degree A-B-C irregular flat correction, labeled as wave (2) on the daily chart. Price recently tested a strong support zone and responded with a sharp rebound, suggesting that corrective pressure may be fading and that wave (2) could already be complete.
On the 4-hour chart, BCH seems to have completed a five-wave bearish impulse within wave C of the correction. This type of structure often signals downside exhaustion, increasing the probability that a meaningful support level is now in place. A recovery and hold above the 563 level would further strengthen this bullish case.
For now, however, the recovery is best viewed as a minimum three-wave move, as bullish momentum has not yet been fully confirmed. From a technical perspective, a clear break and acceptance above the 670 area would be required to confirm a broader trend reversal rather than a temporary corrective bounce.
Key Levels to Watch
Support: Recent wave C lows
Initial confirmation: Above 563
Bullish confirmation: Above 670
Until price reclaims the upper resistance zone, BCH may continue to consolidate or recover in a corrective manner. Still, the completed wave structure and sharp rebound from support suggest that downside risk is increasingly limited, making this area technically important for upcoming price action.

EURUSD Scalping/Day TradingEURUSD is consolidating. Can do some profits scalping and Day Trading and also at the break of SUPPORT looking to go SHORT.

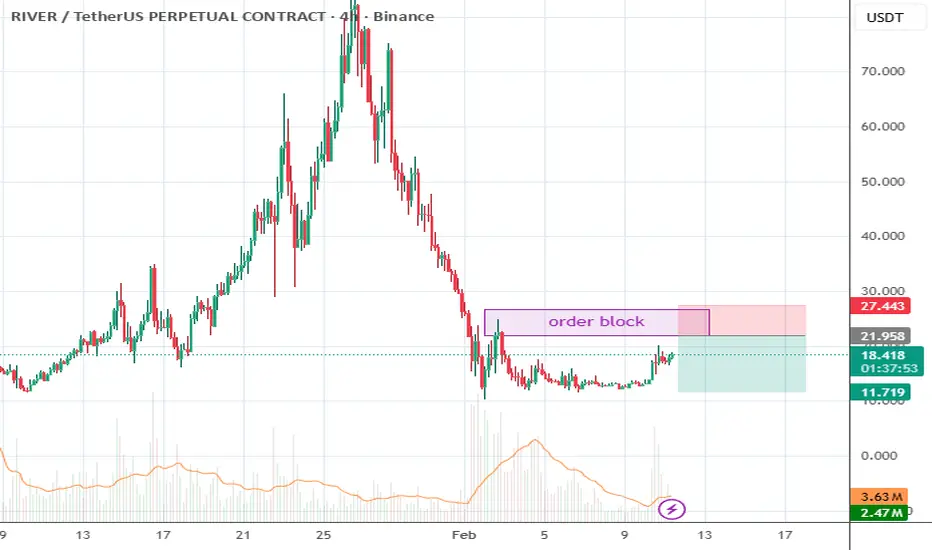
Riverusdt 11-02-26Riverusdt, the price is still within the range on the chart, and there's still potential for it to reach the order block area. Let's try setting a limit in that area.
YALAUSDT 10-02-26It looks like the price is bearish, but the price just touched the order block in the flip area, creating a candle reversal pattern. Let's try setting a sell limit, just in case it triggers.
YShort

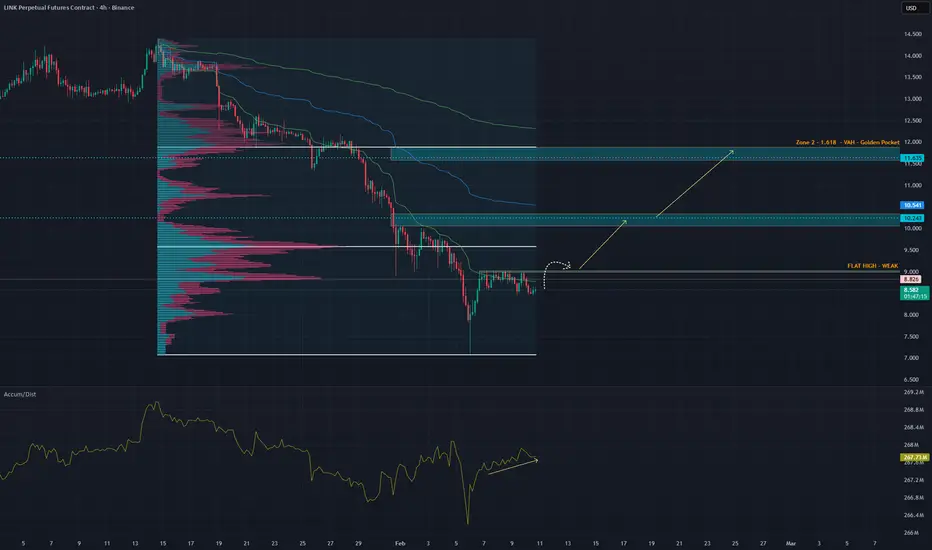
LINK - LONG - The Market Is Setting a Trap$CHAINLINK
Sometimes the market does not whisper.
It speaks clearly.
Both stablecoin-margined and coin-margined futures CVD are bleeding. Sellers are active across derivatives, yet price is barely moving. That tells you everything you need to know. Supply is being absorbed.
Today we saw a sharp increase in fresh leverage, and it is overwhelmingly shorts. Net shorts are up almost 4x since yesterday, but price refuses to break down. If this market wanted lower, it would already be there.
On the 4H Binance Perps, momentum is rolling over while price holds structure. A clean hidden bearish divergence, but with no downside follow-through. That is positioning fighting price, not price confirming positioning.
Now add the Accumulation / Distribution read.
After the downside sweep, A/D turns up and keeps rising while price consolidates. That means supply is being absorbed quietly. This is not distribution into strength. This is accumulation into fear. Smart money is active while volatility compresses.
Look at open interest.
OI is rising while price goes sideways. New positions are entering, not exits. Combine that with negative CVD and you get one thing. Aggressive short positioning into a market that is not accepting lower prices.
Now zoom out and look at the liquidation heatmap.
There are clear liquidation clusters stacked above current price. That is where short liquidations live. Liquidity does not block price. It pulls it.
Markets do not move because of opinions.
They move to resolve imbalance.
When shorts pile in, CVD bleeds, OI builds, and price refuses to break down, the path of least resistance often flips hard and fast. Those clusters are not resistance.
They are objectives.
This is not prediction.
This is structure, positioning, and liquidity aligning.
For me, this is an A++ asymmetric setup. Risk is clearly defined. Upside is driven by forced participation.
Targets:
10.20
11.50
Price does not care who is right.
It cares who is trapped.
BITCOIN - LONG - Value Holds While Leverage PanicsBitcoin 4H Analysis
Price is currently trading inside the Point of Control of the Jan 14 impulse up. This is a high participation area where both buyers and sellers have done the most business, making it a key decision zone.
As long as we hold this PoC, the market is accepting value. A clean acceptance and breakout from this range opens continuation toward Target 1 at ~80k (Zone 1), followed by Target 2 at ~92.5k (Zone 2), both aligned with higher timeframe liquidity and fib-based resistance clusters.
Order flow perspective
Spot CVD is showing a clear bullish divergence. While price went sideways to slightly lower, spot buyers continued to step in. This signals real demand absorbing sell pressure rather than chasing price.
Stablecoin-margined futures CVD remains firmly negative. Perp traders are still selling and pressing shorts without downside expansion. Coin-margined futures CVD confirms the same behavior, showing leverage positioned defensively.
Open interest across both stablecoin and coin-margined contracts continues to bleed. This suggests leverage is being flushed rather than new risk being added, which supports a basing structure.
Accumulation / Distribution
The A/D indicator is turning up after a sharp downside sweep. Despite the volatility, accumulation is increasing, which confirms that smart money is absorbing supply during consolidation rather than distributing into strength.
Coinbase spot flow
Coinbase Spot CVD is trending hard up. Large spot participants are aggressively accumulating while derivatives remain skewed short. This divergence historically favors upside resolution once price exits value.
Summary
We are trading at value. Spot is leading, accumulation is increasing, leverage is leaning the wrong way, and acceptance above the PoC sets the stage for continuation into ~80k first, then ~92.5k. Until value is lost, downside looks corrective rather than impulsive.

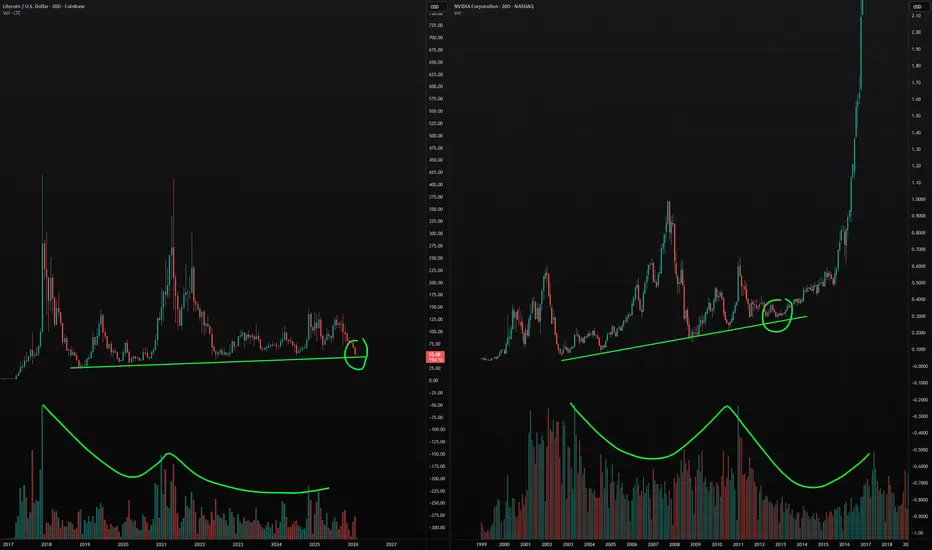
Litecoin Is Primed For A Full Recovery!Litecoin is setting up like Nvidia in the bigger picture. I see mass adoption coming for crypto while most people are planning for a big, multi-year bear market. Last time we had bear markets in crypto, everything was very overvalued, but this time we are seeing that everything is super undervalued. Because of this, I see this as a really good chance to buy Litecoin and most altcoins.
As always, stay profitable.
- Dalin Anderson
BITCOIN Could that be the shortest Bear Cycle ever???Bitcoin (BTCUSD) reached (almost) its 1W MA200 (orange trend-line) last week fastest than any other Bear Cycle before. At the same time, its 1W LMACD hit the same symmetrical level (blue) it did every time BTC completed the 1st Stage of the Cycle. Especially in the case of the (previous) 2022 Bear Cycle, it was around the same time the price came close to the 1W MA200 as well.
As this chart shows, the 4-year Cycle bottom occurs around when the 1W LMACD makes a Bullish Cross after its hits -0.21. We are still far from that. But what past Bear Cycles show is that when the 1W LMACD has hit the current level, Bitcoin takes at best the same amount of time to bottom as it did from the start of the Bear Cycle to the moment the LMACD hit the current level (blue Support). That was particularly the case during the previous (2022) Bear Cycle (was 27 weeks from High to LMACD contact, and another 27 weeks until the Cycle bottomed). The two Bear Cycles before it, bottomed in less time.
As a result, given that last week completed 17 weeks from the Cycle Top up until the LMACD contact, the Cycle could bottom in the next 17 weeks (based on that model). This suggests the first week of June 2026, while the 4-year Cycle suggests mid-September. So what do you think is more likely to happen? Could that be BTC's shortest Bear Cycle ever?
Feel free to let us know in the comments section below!
---
** Please LIKE 👍, FOLLOW ✅, SHARE 🙌 and COMMENT ✍ if you enjoy this idea! Also share your ideas and charts in the comments section below! This is best way to keep it relevant, support us, keep the content here free and allow the idea to reach as many people as possible. **
---
💸💸💸💸💸💸
👇 👇 👇 👇 👇 👇

BTC Elliott Wave IdeaSome nice fib interactions on BTC that make me think this move down is WXY
$80534 was the 1.618 extension for wave C in wave W
$97884 was the 0.382 retracement of wave W
The 1:1 extension for wave Y is at $52874 and there is a CME trading gap around $54000 from September 2024

SOL Elliott Wave IdeaSeems like SOL nearing the bottom, possibly wave 4 of C with the 1:1 extension for wave C at $54

BITCOIN: WHY!? Long-Term Structure Still IntactIt's time to be real..
Everyone is calling for an immediate bull run, or bull run soon, but markets don't move on excitement - they move in cycles.
Bitcoin has always required time, consolidation and patience before its next expansion phase. Price rarely moves in straight lines, especially on higher timeframes.
This weekly chart highlights the broader structure and long-term trend rather than short-term noise. If history continues to rhyme, the coming phase is more likely to be a a boring continued consolidation and accumulation phase, not instant acceleration. For those that know, the "boring" phase is often the most exciting. When everyone's portfolio has been hit hard followed by some up and down consolidation for long period of time, that's when they get the "i better sell, this is BS" attitude. That's when i buy with excitement.
The goal here isn't to predict a top or bottom, but to respect structure and allow the cycle to play out. Patience is often the hardest part - and usually the most rewarding.
So everyone wants prices and dates right? Well looking at the chart, I suspect that we have already hit the bottom lows of 60k, and the boring accumulation is about to begin. This will go for a year, most will not be able to cope. We will be bouncing around the bottom of the parallel channel a few times around 64k again.
When's the next bull run you ask? well i suspect it won't officially start until early to mid 2027.
SAVE this chart, track as time goes on.
Cheers,
Activeaus

STABLEUSDT 10-02-26The price just dropped from the supply, using a double top. Now, it's retracing again in the flip area. There's already a rejection, so we'll set another sell limit in case it triggers, okay? Just set it first.

ACUUSDT 10-02-26The price is compressing to rise above supply, and the supply happens to be fresh. That will be a profitable area. We'll place a sell limit in the order block area. Just wait. The main thing is to place an order first.

collectusdt 10-02-26That's right, the price has reached the supply from the retrace, so you've made a reversal candle. We can open sales like that, if you're lucky, be grateful, if not, go to the salon to shave

Bitcoin - Starting the final -30% drop!🛟Bitcoin ( CRYPTO:BTCUSD ) is dropping another -30%:
🔎Analysis summary:
The underlying trend on Bitcoin remains clearly bullish. But following the unusual curve channel, Bitcoin perfectly rejected the upper resistance curve. Quite likely therefore that Bitcoin will now create another bullish break and retest and first drop -30%.
📝Levels to watch:
$55,000
SwingTraderPhil
SwingTrading.Simplified. | Investing.Simplified. | #LONGTERMVISION

BTCUSD — Structure FirstAfter the recent liquidation-driven sell-off, BITSTAMP:BTCUSD has entered a very different phase.
Momentum is gone, volatility has compressed, and price is no longer behaving like it did during the impulsive advance that preceded the correction.
From a structural point of view, this move looks less like the start of a new bearish trend and more like a reset within a broader cycle. Higher-timeframe supports are still holding, and instead of continuation to the downside, price has stabilized and begun to balance.
This type of behavior usually appears between phases, not at the beginning of a strong directional move.
From a fundamental perspective, the picture is equally mixed.
Liquidity conditions remain tight, rate expectations are still uncertain, and risk assets are highly sensitive to macro data and policy communication. At the same time, Bitcoin is no longer trading in isolation — ETF flows, institutional positioning, and broader market correlation are now part of the equation.
In this environment, extremes tend to be punished.
Price needs time to absorb information, reposition participants, and rebuild structure.
That is why, at this stage, structure matters more than narrative.
Key Levels
Major structural support: 65,000 – 68,000
This is the area that separates consolidation from continuation. As long as it holds, the broader structure remains constructive.
Current acceptance zone: ~70,000
Price is stabilizing here. Acceptance or rejection around this level will define the next leg.
First meaningful resistance: 78,000 – 80,000
A clear supply zone where reactions are likely.
Higher-timeframe supply: 90,000+
A reference level if the market successfully rebuilds bullish structure.
Trade Framework
Base case (balance / recovery):
Acceptance between 70k–72k favors a rotation toward 78k → 80k → 85k.
This scenario assumes continuation of consolidation and gradual structure rebuild.
Recovery continuation:
Sustained acceptance above 74k–75k opens the path toward 85k → 90k, suggesting renewed confidence and participation.
Bearish continuation:
A daily close below 68k would invalidate the balance and shift the focus toward 62k and 58k as next downside areas.
Bitcoin is not in a momentum phase right now.
It is in a decision-making phase, shaped by both technical structure and a complex macro backdrop.
The reaction around 68k, 70k, and 78k will be far more important than short-term headlines.
Until structure resolves, patience and level-based execution remain the edge.
Illyrian Finance — Trading structure, not predictions.

BTCUSDT PLAN B ROCKED
As we discussed earlier Plan-B worked hope it helped you guys, now lets wait for retracement then will update the move as Price Action

SOL 1W Update: Zoomed out thoughts and viewSolana’s weekly dump is showing signs of exhaustion, with downside momentum clearly decelerating as price presses into a major long-term demand zone around 80–85. The sell-off has been steep and highly directional within a falling channel, which often precedes mean-reversion relief moves rather than immediate continuation. Notably, SOL has already retraced a large portion of its prior impulse leg and is now trading well below former range support at 125.5, suggesting late sellers are entering after most of the damage has been done. While the broader structure remains corrective until higher levels are reclaimed, the risk–reward is beginning to shift in favor of short-term upside relief. A bounce toward 100–110 would be a reasonable first reaction if buyers step in, with a more meaningful trend improvement requiring acceptance back above 125.5. As long as 44 holds as macro support, this move still fits a deep bull-market correction, and current price action favors stabilization and a counter-trend bounce rather than continued freefall.

BTC NOT CLEARBitcoin looks stuck in a range, trading heavily without clear momentum. It’s consolidating, and the next decisive move will show whether it breaks higher or lower.

BITCOIN always leads stocks when Bear Cycles happen. This time??Bitcoin (BTCUSD) completed a more than -50% drop last week from its October 2025 All Time High (ATH) while stocks stayed close to their ATH. This chart shows that while BTC is obviously on a Bear Cycle, the S&P500 (SPX) illustrated by the blue trend-line, is still on Bull Cycle territory.
So why this huge divergence between BTC and stocks. Well looking at it historically, this is not uncommon. During the 2022 Bear Cycle, Bitcoin had to crash by more than -40% before the stock market started its own correction, while in 2018 Bitcoin again crashed by more than -50% before the SPX started a Bear Cycle.
This is very logical from a long-term investing standpoint as investors seek first to liquidate the massive profits on riskier assets like Bitcoin, add some remaining capital on stocks and then when the stock market shows signs of a long-term correction, withdraw their funds from there as well. This is usually when the USD takes off as they convert stocks to dollars and choose to weather out the storm primarily in cash (others might choose precious metals).
In any event, this analysis shows that since Bitcoin is already down by more than -50% from its historic High, we might be seeing a Bear Cycle starting on the S&P500 as well.
Do you agree with that? Feel free to let us know in the comments section below!
---
** Please LIKE 👍, FOLLOW ✅, SHARE 🙌 and COMMENT ✍ if you enjoy this idea! Also share your ideas and charts in the comments section below! This is best way to keep it relevant, support us, keep the content here free and allow the idea to reach as many people as possible. **
---
💸💸💸💸💸💸
👇 👇 👇 👇 👇 👇
