BTCUSDT:Elliot Waves Analysis DailyHello friends, after the Bitcoin price rose to 124,000 and fell to 117,000 as the fourth wave, matching the 38.2% Fibonacci retracement level and pulling back to the broken area, I expect growth to 129,500 to 130,000.
Cryptocurrency

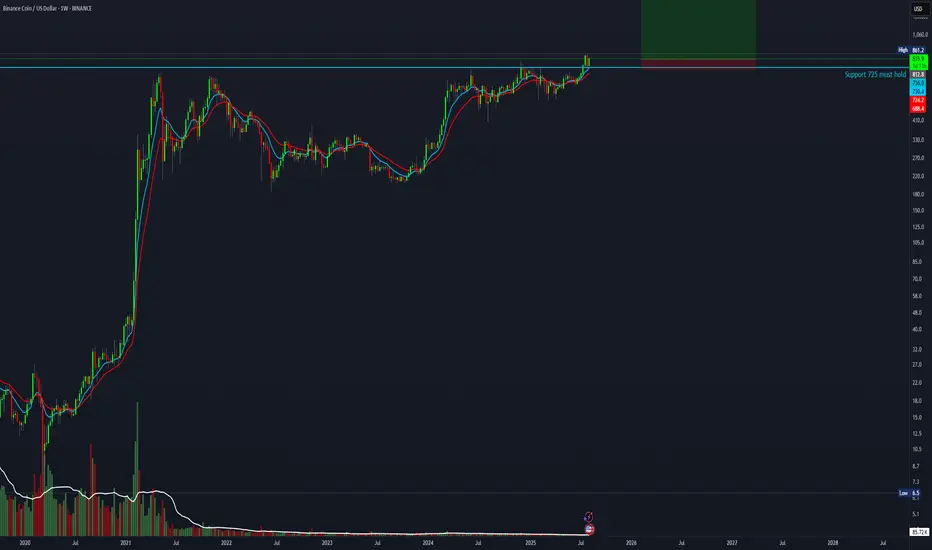
25R setup for BNBEveryone is talking about ETH right now, but don’t forget about this monster — BNB. BNB is about to break out after a successful retest of macro support. Where’s the end after the $850 breakout? Do you really want to bet against CZ? Stop-loss below support at $725.
Good luck — not financial advice.
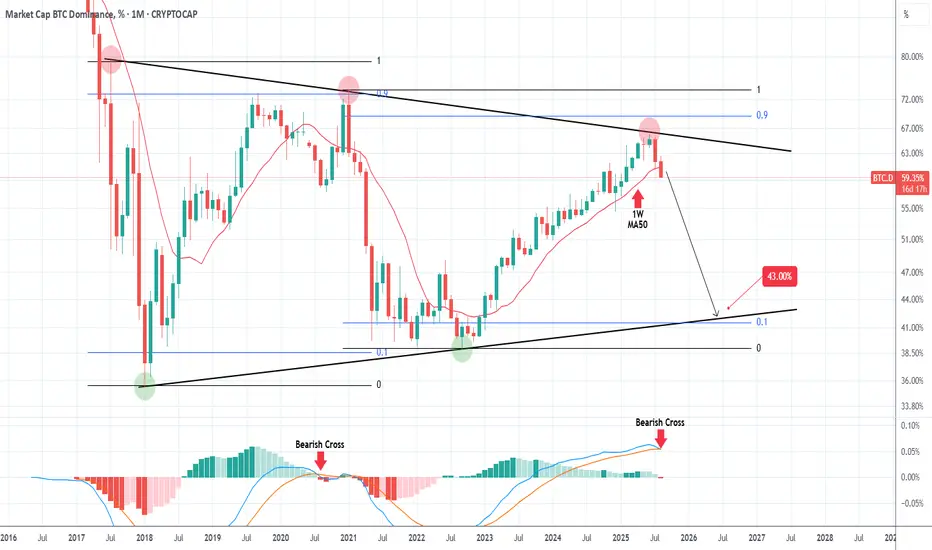
ALTSEASON has already started!The BTC Market Cap Dominance (BTC.D) has made an emphatic rejection at the top (Lower Highs trend-line) of the 8-year Triangle and if it closes the 1M candle of August below the 1W MA50 (red trend-line), it will largely confirm the new Bearish Leg.
With the 1M LMACD about to complete its first Bearish Cross in more than 4 years, it is more probable to see this strong and lengthy downtrend target the bottom (Higher Lows trend-line) of the Triangle near the 0.1 Fibonacci level, similar to the previous one.
The Target is 43.00%.
-------------------------------------------------------------------------------
** Please LIKE 👍, FOLLOW ✅, SHARE 🙌 and COMMENT ✍ if you enjoy this idea! Also share your ideas and charts in the comments section below! This is best way to keep it relevant, support us, keep the content here free and allow the idea to reach as many people as possible. **
-------------------------------------------------------------------------------
💸💸💸💸💸💸
👇 👇 👇 👇 👇 👇
Heikin Ashi Trade Idea📈 Hey Traders!
Here’s a fresh outlook from my trading desk. If you’ve been following me for a while, you already know my approach:
🧩 I trade Supply & Demand zones using Heikin Ashi chart on the 4H timeframe.
🧠 I keep it mechanical and clean — no messy charts, no guessing games.
❌ No trendlines, no fixed sessions, no patterns, no indicator overload.
❌ No overanalyzing market structure or imbalances.
❌ No scalping, and no need to be glued to the screen.
✅ I trade exclusively with limit orders, so it’s more of a set-and-forget style.
✅ This means more freedom, less screen time, and a focus on quality setups.
✅ Just a simplified, structured plan and a calm mindset.
💬 Let’s Talk:
💡Do you trade supply & demand too ?
💡What’s your go-to timeframe ?
💡Ever tried Heikin Ashi ?
📩 Got questions about my strategy or setup? Drop them below — ask me anything, I’m here to share.
Let’s grow together and keep it simple. 👊

XRPUSDTHello Traders! 👋
What are your thoughts on RIPPLE ?
On the XRP chart, we can see that after breaking the descending trendline and reaching a resistance level, the price has entered a corrective phase.
We expect this correction to continue down toward the support zone, which coincides with the ascending trendline. This area also represents a pullback to the previously broken bearish trendline.
Once the pullback is complete, we anticipate a bullish continuation toward higher targets.
Don’t forget to like and share your thoughts in the comments! ❤️

BITCOIN The vast importance of the Pivots. Is $180k possible?Bitcoin (BTCUSD) is most likely starting the new Bullish Leg of this Cycle, as stated on our recent analysis following the 1D MA50 (red trend-line) rebound.
Today we point out the critical role of Pivot trend-lines, which throughout the entirety of the current Bull Cycle, have provided a Support level and initiated massive rebounds.
Those Bullish Legs not only tend to be similar in strength (+60% to +92%) but the time between their starts is roughly the same (39 to 46 weeks).
Given also the fact that the 1W RSI has printed the same kind of consolidation it always forms when such a Bullish Leg started, we do expect a strong rally next, which if the +60% minimum rise holds, may very well be as close as $180000.
So do you think BTC can reach $180k before this Cycle is over or it's too high? Feel free to let us know in the comments section below!
-------------------------------------------------------------------------------
** Please LIKE 👍, FOLLOW ✅, SHARE 🙌 and COMMENT ✍ if you enjoy this idea! Also share your ideas and charts in the comments section below! This is best way to keep it relevant, support us, keep the content here free and allow the idea to reach as many people as possible. **
-------------------------------------------------------------------------------
💸💸💸💸💸💸
👇 👇 👇 👇 👇 👇

119.15-119.70K to watch for Long tradeMorning folks,
So, Thu setup is done perfect. Jump precisely from K-support area of 118.30 that we discussed. But, BTC has reached just minor 1H target and now is moving down. Since overall upside impulse is not bad, we consider ~119.5K support area for bullish momentum trade for now...

Crypto Market Slows Down For A Pullback Within A Bullish TrendGood morning Crypto traders! Cryptocurrencies are coming slightly lower on the intraday basis due to stock market decline yesterday, but we still see them approaching support, so still be aware of a bounce and recovery at the end of the week or maybe next week because of an upcoming weekend. Crypto TOTAL market cap chart can be trading in wave »y« of a complex w-x-y correction in wave 4, unless it's a flat correction, but support is the same at 3.6T – 3.5T area, from where we may see a bullish continuation within wave 5.

DOGE Whales Are Back! $500M Buy Triggers Bullish BreakoutDogecoin CRYPTOCAP:DOGE is now again on the rise, thanks to a large increase in accumulation by whales. In the last week, addresses with 100 million to 1 billion DOGE boosted their holdings by 2 billion DOGE (roughly USD 500 million), indicating high confidence among major holders in the meme coin's long-term prospects.
Technical analysis on the monthly period shows that Dogecoin has the potential to maintain its bullish trend as long as the price stays above the lower trendline level around $0.15678. The movement's initial goal is classic resistance at $0.4688, with the possibility of further increases to the all-time high around $1.03 if strong momentum continues.

PLUME/USDT NEW ATH ON WAY --> $0,40+Depending on the last trend view, there is a high chance that PLUME will show a new volume effect and with time to new ATH.
#try to update always with the last best possibility for market increase.
The goal = to scan the best coins daily.

JYAI/USDT NEW VOLUME THAT COULD MAKE IT 2XJYAI showing on the low time frame the first signal of new increase processing, this meme coin is able to do 2x when it stays in this range. on this reason tthere will be a follow.

DOGE Can its 1st 1D Golden Cross in 9 months make it skyrocket?Dogecoin (DOGEUSD) just completed yesterday its first 1D Golden Cross formation in 9 months! The last one (November 05 2024), was right before the previous Bullish Leg of the 2-year Bullish Megaphone exploded.
As you can see on the chart, both previous Bullish Legs peaked on the 3.618 Fibonacci extension from their respective bottoms. Those were the pattern's Higher Highs.
If this is repeated, we can expect Doge to touch $1.1500 (as close to Fib 3.618 as possible), even by the end of this year.
-------------------------------------------------------------------------------
** Please LIKE 👍, FOLLOW ✅, SHARE 🙌 and COMMENT ✍ if you enjoy this idea! Also share your ideas and charts in the comments section below! This is best way to keep it relevant, support us, keep the content here free and allow the idea to reach as many people as possible. **
-------------------------------------------------------------------------------
💸💸💸💸💸💸
👇 👇 👇 👇 👇 👇

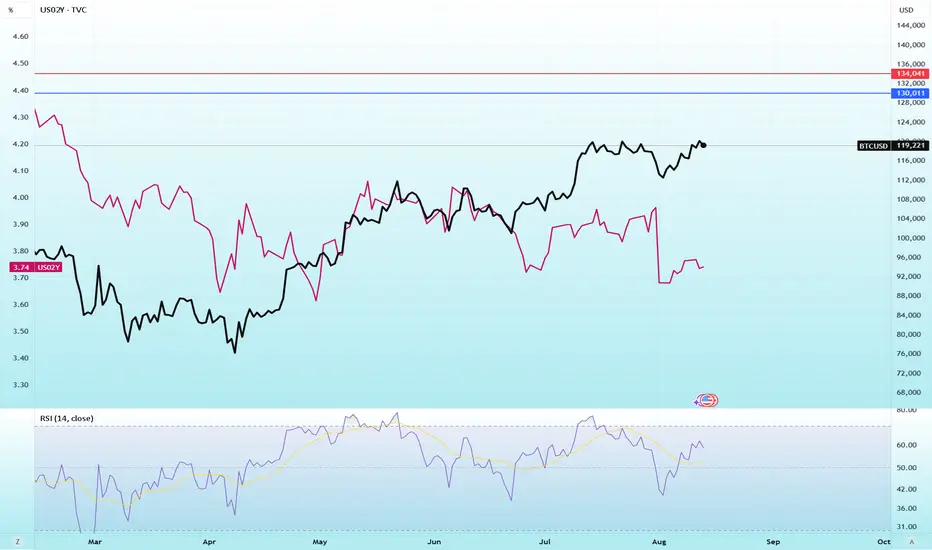
Declining 2-Year US Treasury Yields Could Fuel Bitcoin’s BullishThe follow chart is a comparison between Bitcoin CRYPTOCAP:BTC Daily Chart and the US 2 years Treasury Bonds TVC:US02Y .
The graphic shows the 2-year US Treasury yield declining from 3.7684% to 3.7308% on August 12, 2025, following a steep drop after CPI inflation in July stabilized at 2.7%. This underscores market expectations that the Federal Reserve will lower interest rates, driving up demand for bonds as a safe haven asset.
The potential on Short-Term Impact on the Bitcoin Market:
Positive: Falling rates and expectations for rate cuts weaken the US dollar, boosting capital flows into riskier assets such as Bitcoin. BTC may gain in the immediate term, testing the $130,000 resistance level, aided by new liquidity from stablecoins.
Risk: While falling yields can support Bitcoin’s bullish momentum, they may also signal recession fears. If investors interpret the decline as a warning of economic slowdown, BTC could face selling pressure—potentially dropping to $111,939. Volatility remains elevated, especially after the recent liquidation of leveraged long positions. Keep an eye on upcoming economic data for confirmation of market direction.
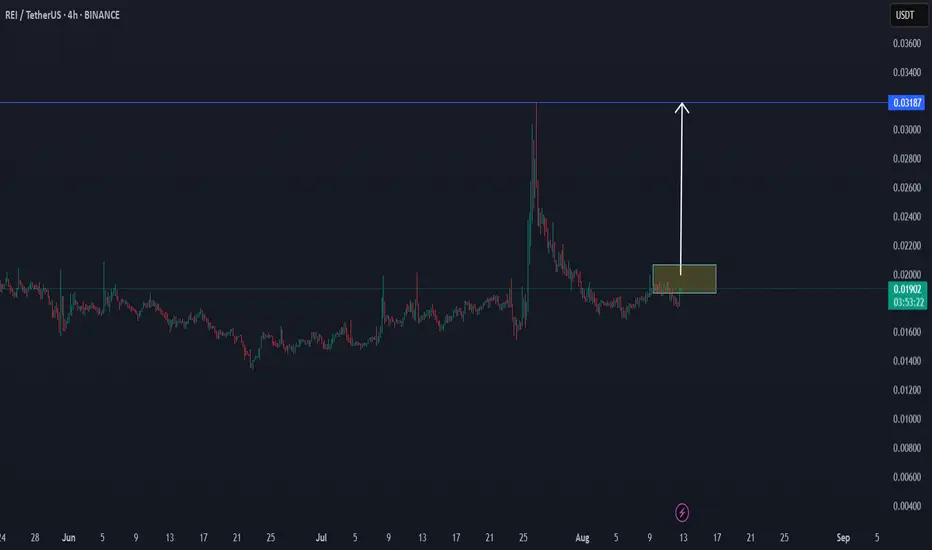
THE RETURN BREAK OF REI TO $0,032There is a good chance we are going to see a new break on REI as we saw before.
We will follow the coin for new volume.
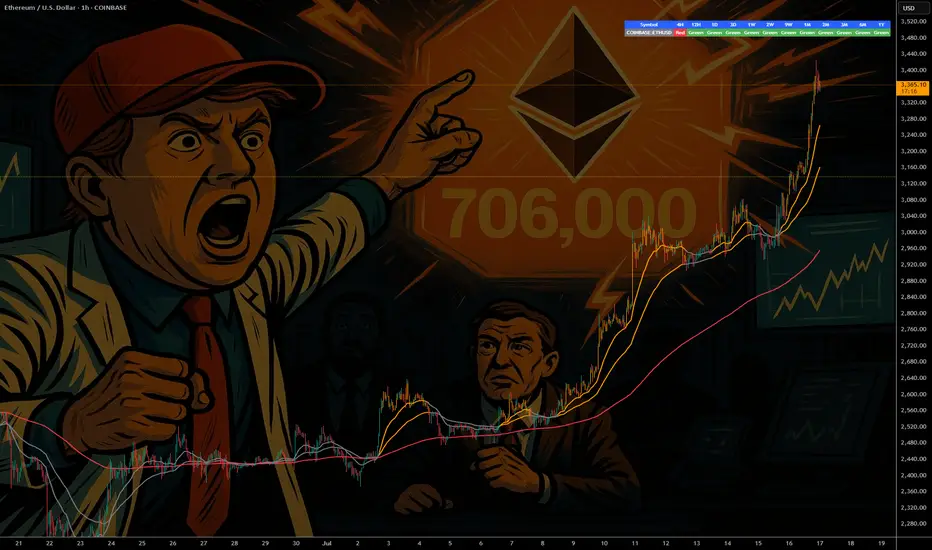
ETH - If You Know ...... You Know whats Coming
NYSE:BLK $BUIDL tokenized U.S.-Treasury fund launched on COINBASE:ETHUSD in Mar 2024—Wall Street is already settling real dollars on-chain.
NYSE:JPM JPMD stablecoin just went live on Base (an COINBASE:ETHUSD L2), piping wholesale payments from a $4 T balance-sheet straight through COINBASE:ETHUSD rails.
COINBASE:ETHUSD isn’t just riding the next crypto cycle—it’s becoming Wall Street’s settlement layer. From BlackRock’s on-chain Treasury fund to JPMorgan’s and soon Bank of America’s dollar tokens, a tidal wave of institutional stable-coin flows is lining up behind ETH. Fewer coins, more real-world volume—if you know, you know what’s coming.
NYSE:BAC CEO says they’ll issue a dollar-backed token the moment regulators nod—another tier-1 bank boarding the Ethereum train.
Stablecoin cap has blasted past $230 B , with 80 %+ of all on-chain transfers riding Ethereum (plus BSC) blocks.
Corporate settlements via stablecoins grew 25 % YoY in 2024 as multinationals replaced SWIFT with instant on-chain clearing.
Daily stablecoin throughput averages $7 B—each hop burning ETH and tightening supply.
BCG projects tokenized real-world assets to exceed $16 T by 2030 , with EVM chains as the default plumbing.
Over 500 M wallets already interact with stablecoins , a 30 % YoY surge led by emerging-market demand.
L2s like BINANCE:ARBUSDT & BINANCE:OPUSDT cut transaction fees 35 % yet still settle back to mainnet—meaning ETH captures the fee stream and the burn.
Bottom line: a tidal wave of bank-grade stablecoins + tokenized assets is lining up behind ETH; supply shrinks, demand soars—if you know, you know what’s coming.
quote] Marty Boots | 17-Year Trader — smash that , hit LIKE & SUBSCRIBE, and share your views in the comments below so we can make better trades & grow together!
CRAI/USDT is able to breakout as never before x10Our study shows that this small-cap coin can show interesting targets in the coming time, as data shows this, so we will follow it to see new confirmations.
All updates will be here on this page
The price is running now at around: $0,03947 as the chart shows.
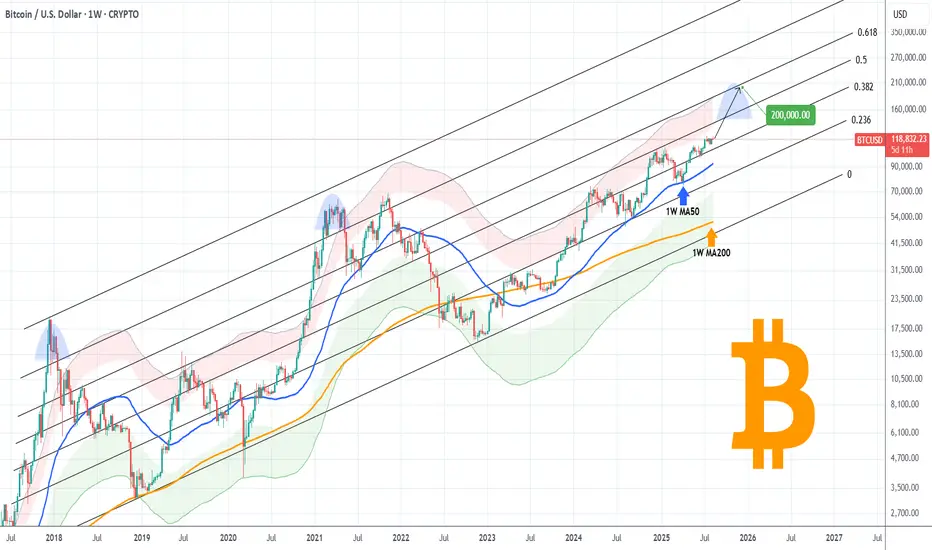
BITCOIN Can it break above this 3-year Resistance and hit $200k?Bitcoin (BTCUSD) is extending its main 1W MA50 (blue trend-line) fueled rebound, which only recently confirmed the continuation with a short-term bounce on the 1D MA50. The short-term setting is transferred now back to the long-term and the next Resistance, which is the middle (0.5 Fibonacci level) of the macro Channel Up, that has been dominating BTC's price action since late 2017.
The 0.5 Fib has made its last rejection/ failed attempt to break on December 16 2024. It's been holding as a Resistance since May 02 2022. The last two Cycle Tops however haven't only been priced above the 0.5 Fib but above the 0.786 level too (obviously as close to the Channel Top as possible).
As a result, if BTC does break above the 0.5 level, a 'mere' test of the immediate upper Fib (the 0.618) could be translated by the end of the year (timing of Cycle Top) to a $200k test. That would also be a test of the Top of the 1st SD above (red Zone) of the Mayer Multiple Bands (MMBs), which is technically still within high tolerance levels.
So do you think we can get near $200k by the end of the year if the 0.5 Fib breaks? Feel free to let us know in the comments section below!
-------------------------------------------------------------------------------
** Please LIKE 👍, FOLLOW ✅, SHARE 🙌 and COMMENT ✍ if you enjoy this idea! Also share your ideas and charts in the comments section below! This is best way to keep it relevant, support us, keep the content here free and allow the idea to reach as many people as possible. **
-------------------------------------------------------------------------------
💸💸💸💸💸💸
👇 👇 👇 👇 👇 👇
Dash Can Be BottomingDash Can Be Bottoming, as we see it recovering out of a downward channel, which indicates for a bullish reversal by Elliott wave theory.
Cryptocurrency Dash with ticker DSHUSD is recovering from June lows out of the downtrend channel, which suggests that the impulsive decline from the 2024 highs is bottoming, as shown on the daily chart. Currently we can see it forming a bullish setup formation with waves A/1 and B/2 that can send the price higher within wave C or wave 3 of a five-wave bullish impulse. Wave C has room up to 26-30 area, but if if breaks above 31 bullish confirmation level, then we can start tracking wave 3 of a five-wave bullish impulse.
Dash is a cryptocurrency launched in 2014 that focuses on fast, low-cost payments and privacy. It uses a two-tier network with miners and “masternodes” to enable features like InstantSend (near-instant transactions) and PrivateSend (optional privacy). It started as a fork of Bitcoin.

BITCOIN Can $160k be the Top???Bitcoin (BTCUSD) closed last week on strong bullish fashion as it completed a formidable green 1W candle following a technical bounce on its 1D MA50 (red trend-line). This is a strong bullish signal as every time the (orange) Fibonacci Channel rebounded on its 1D MA50 after a 1W MA50 (blue trend-line) bounce, BTC extended the uptrend towards a new technical Higher High.
Based on the 1W LMACD, we could be roughly half-way (blue circle) through such a Bullish Leg. As you can see, those Bullish Legs have typically made rounded Tops (red Arcs), with the last two both breaking above the Fib Channel's 0.236 level. At the same time, on the horizontal Fib level, the sequence has applied significant importance to every .618 and .0 interval, with peaks on the 0.618, 1.0, 1.618, 2.0, 2.618. Now what's left realistically before the end of the Cycle at the end of the year are 3.0 and 3.618.
As a result, a rather modest potential Top projection is $160000, which is even conveniently placed just below the 0.236 Channel Fib from late October onwards.
Do you think that could be a potential Cycle Top candidate? Feel free to let us know in the comments section below!
-------------------------------------------------------------------------------
** Please LIKE 👍, FOLLOW ✅, SHARE 🙌 and COMMENT ✍ if you enjoy this idea! Also share your ideas and charts in the comments section below! This is best way to keep it relevant, support us, keep the content here free and allow the idea to reach as many people as possible. **
-------------------------------------------------------------------------------
💸💸💸💸💸💸
👇 👇 👇 👇 👇 👇

ADA/USDT | ADA Gains 18% – Bullish Momentum Ahead!By analyzing the Cardano chart on the 3-day timeframe, we can see that after correcting down to $0.69, the price saw renewed demand and has so far rallied over 18% to reach $0.80. Given the strength of this new bullish trend, I expect ADA to continue its upward move, with the next targets at $0.85, $0.93, and $1.00. Keep a close eye on this pair — this analysis will be updated!
Please support me with your likes and comments to motivate me to share more analysis with you and share your opinion about the possible trend of this chart with me !
Best Regards , Arman Shaban

118.5K and 120K For Long EntryMorning folks,
Not too much to say now. Most important thing - BTC was able to stay above vital 110-112K support. So the upside reversal that we traded last two weeks with minimal target around 116K was correct. Now BTC stands much higher, but in a moment when we started the trade - it was impossible to say.
Now we're watching two support areas of 120K and 118.5K for potential long entry. Nearest upside target is 127K
Take care.

#CRV LONG CRV seems pretty good here, and it makes sense to go long with proper stop loss.
Targets mentioned in the chart.
Major timeframe trend is uptrend. Flush out is also over now. Let's goo

BTC Breaks 116k!We did break the 116k level. But it is not clear yet whether the breakout is bullish or not.
Plotted range extremes let's see
