ZEC Head & Shoulders Breakdown – Dead Cat Bounce Setup?ZEC has broken down after completing a fairly large head-and-shoulders pattern, which typically signals bearish momentum. The neckline break triggered a sharp sell-off, putting pressure on support zones. Price action suggests that a rebound may be in play soon as the market searches for a local bottom.
👀 Key Zone to Watch: The $215–$210 range is the ideal bounce zone, where buyers may step in for a classic dead cat bounce. This area has confluence with prior structure and should attract tactical entries. A strong reaction here could open the door for a smart pump.
🎯 Trade Plan:
Entry Zone: $215–$210
Take Profits: $235 / $250 / $270
Stop Loss: Close below $207
Cryptocurrency

TradeCityPro BNBUSDT Heading Toward a New ATH?👋 Welcome to TradeCityPro Channel!
Let’s dive into the BNB (Binance Coin) analysis — one of the strongest and most bullish charts in the market. Currently, after correcting from its All-Time High (ATH), the price is consolidating within a sideways range, showing that buyers and sellers are in a tug-of-war.
🌐 Overview of Bitcoin
Before we begin, note that we’ve moved the Bitcoin analysis to a dedicated daily report for deeper insights into its market behavior, dominance, and trend structure:
👉 TradeCityPro Bitcoin Daily Analysis
📊 Technical Overview (4H Timeframe)
After facing a heavy rejection from its ATH, BNB once again attempted to retest that level. However, a fake breakout (false move above resistance) led to another sharp correction, pushing the price back down into the range.
Interestingly, this correction bounced exactly from the $1054 support zone, the same level that previously acted as a strong reversal point. This repeated reaction confirms how critical this support is — not only because it aligns with the 50% Fibonacci retracement level, but also due to its importance in the Dow Theory structure as a mid-wave equilibrium.
📈 Long Setup (Bullish Scenario)
If price breaks above $1129, it could trigger an early long position setup — signaling that buyers are regaining control before another major leg up. This move would likely be the early breakout signal ahead of a potential new ATH attempt.
📉 Short Setup (Bearish Scenario)
For short positions, the $1054 level remains the key trigger. A clean breakdown below this zone would indicate the loss of a major support and could open the way for a deeper retracement.
However, keep in mind — this is a high-impact support zone, so avoid placing tight stop-losses or over-leveraged entries. Price volatility is expected to increase around this level.
🎯 Conclusion
BNB remains one of the strongest altcoins structurally, and as long as it holds above the $1050 region, the bullish structure remains valid. The next few sessions will be crucial — watch the $1129 breakout for confirmation of renewed bullish momentum, or the $1054 breakdown for signs of weakness.
📝 Final Thoughts
Stay calm, trade wisely, and let's capture the market's best opportunities!
This analysis reflects our opinions and is not financial advice.

ATOMUSDT.P: short setup from daily support at 3.110BINANCE:ATOMUSDT.P confirmed a local level today — a clear hit occurred a few hours ago, followed by a gradual approach. This behavior indicates weakening buyer pressure. As always, the key factors are low volatility and an entry point that aligns with the trading system.
Key factors for this scenario:
Global & local trend alignment
Correlation with the market
Volatility contraction on approach
Immediate retest
Was this analysis helpful? Leave your thoughts in the comments and follow to see more.

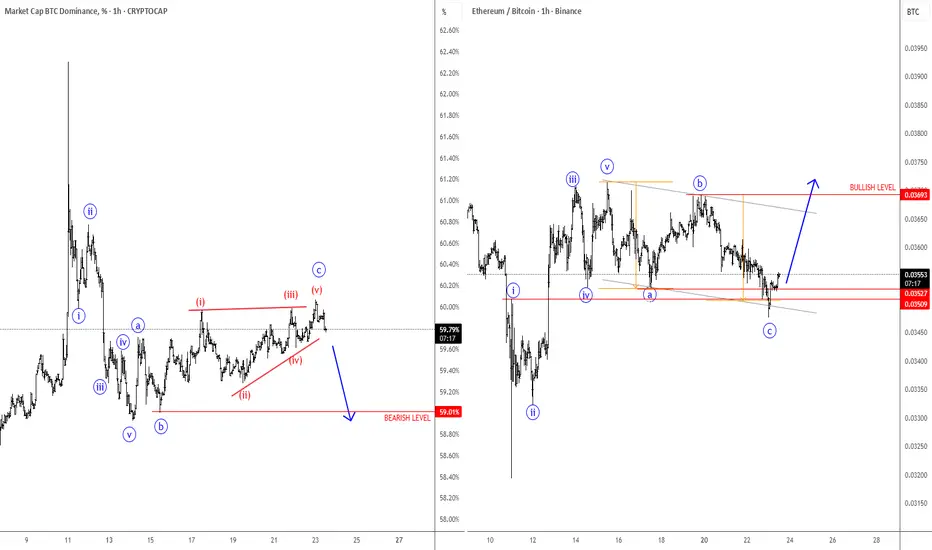
BTC Dominance Is Pointing Lower, While ETHBTC HigherBTC.Dominance chart made an impulsive five-wave decline, which confirms a bearish reversal. Currently, it still appears to be completing wave “c” of an abc correction, which could be forming a potential wedge pattern before further weakness.
As a result, after a five-wave rally on ETHBTC, which confirms a bullish reversal, it might also be finishing wave “c” of an abc flat correction, potentially finding support around the 0.034 area before another rally.
Overall, it seems that Ethereum and ALTcoins will continue to outperform Bitcoin, but a true ALTseason may only emerge if Bitcoin and the whole Crypto market experience a stronger recovery.
DOGE Can it give one more rally?Dogecoin (DOGEUSD) has been trading within a Channel Up pattern since March 02 that only broke momentarily to the downside during the October 10 2025 flash crash. Immediately the price recovered and has since been consolidating on the 1W MA100 (red trend-line).
The 1W MA100 has price both previous Higher Lows bottoms of the pattern, with both Bearish Legs incredibly declining by the same extent -45.90%. This amazing degree of symmetry is also seen on the pattern's Bullish Legs, with both also registering identical rises of +101.96%, pricing their Higher Highs on their respective 1.136 Fibonacci extensions.
As a result, as long as DOGE keeps closing its 1W candles above the 1W MA100, we have strong reasons to expect another +101.96% Bullish Leg targeting 0.33000 (also the 1.136 Fibonacci extension).
It is also worth noting that the 1D RSI has been on a Higher Lows Bullish Divergence (against the price's Lower Lows), similar to the first bottom of the Channel Up in early April.
-------------------------------------------------------------------------------
** Please LIKE 👍, FOLLOW ✅, SHARE 🙌 and COMMENT ✍ if you enjoy this idea! Also share your ideas and charts in the comments section below! This is best way to keep it relevant, support us, keep the content here free and allow the idea to reach as many people as possible. **
-------------------------------------------------------------------------------
💸💸💸💸💸💸
👇 👇 👇 👇 👇 👇

3-DRIVE INSTEAD OF H&S WITH 101-102K TARGETMorning folks,
Last time we acknowledged some BTC efforts to reverse up, but decided to wait for more confirmation and more confidence. So, this bet seems is failing. Because fast jump was immediately reversed, and this is not the type of action that you expect from bullish market that supposedly is forming the H&S pattern...
It leads us to suggestion of 3-Drive "Buy" instead, with potential target around 101-102K area. At least now we prefer to stay aside from any bullish positions here.

TradeCityPro Academy | Support & Resistance Part 2👋 Welcome to TradeCityPro Channel
🎓 Educational Section Technical Analysis Training Series
Welcome to the Educational Content Section of our channel!
Here, we aim to teach you technical analysis from A to Z through structured playlists.
We’ll cover everything from risk and capital management, Dow Theory, support and resistance, trends, and market cycles, to more advanced concepts.
Our lessons are based on both real market experience and The Handbook of Technical Analysis.
🎨 What is Technical Analysis?
Technical Analysis (TA) is a method used to forecast price movements in financial markets by analyzing historical data, especially price and volume.
It’s based on the idea that history tends to repeat itself, and that recurring patterns can reveal profitable trading opportunities.
📚 Complete Guide to Support and Resistance in Technical Analysis
🧩 Introduction
In technical analysis, two key concepts form the foundation of nearly every trading strategy: Support and Resistance.
These levels represent areas on the chart where the price is likely to change direction, as buyers or sellers regain control.
But to truly understand them, you must go beyond the chart — because their origin lies in human psychology and collective behavior.
🟢 What Is Support?
A support level is an area where buying pressure increases and prevents the price from falling further.
It acts like a floor where buyers believe the asset has become cheap enough to buy.
As a result, the market tends to bounce upward from that area.
For example, if Bitcoin has repeatedly reversed near $55,000, that zone is considered a support level.
🔴 What Is Resistance?
A resistance level is an area where selling pressure increases and stops the price from rising higher.
When the price approaches this level, traders often feel the asset is “too expensive” and start selling.
For example, if Ethereum has failed multiple times to break above $3,800, that area is considered resistance.
💭 Why Do Support and Resistance Form?
Markets are not just numbers — they’re the reflection of human emotion and crowd behavior.
When large groups of traders make similar decisions (to buy or sell) around the same price zone, it creates a psychological memory in the market.
If price has reacted there before, traders remember it — and react the same way next time.
This repetition forms the backbone of how support and resistance levels develop and strengthen over time.
🧠 The Role of Emotion and Crowd Psychology
Emotions drive markets.
When prices rise quickly, people experience FOMO (Fear of Missing Out) and rush to buy — until demand runs out and price reverses (resistance).
When prices fall, fear of losing money triggers panic selling — until sellers dry up and price rebounds (support).
This constant emotional cycle repeats endlessly, creating recurring support and resistance zones on every chart.
⚙️ The Structure Behind the Levels
From a technical perspective, these levels form because large clusters of orders are placed around them.
Traders typically set buy orders below the current price (near support) and sell orders above it (near resistance).
So when the market reaches those areas, there’s a strong battle between buyers and sellers.
That’s why these zones are not just psychological — they’re also built into the order flow and liquidity structure of the market.
📈 Reactions and Breakouts
When price approaches a key level, two outcomes are possible: Reaction or Breakout.
In a reaction, price touches the level and reverses — meaning buyers or sellers defend it successfully.
In a breakout, price pushes through with strong momentum and high volume, breaking the market’s previous belief.
After a breakout, the level often changes its role:
A broken resistance becomes new support.
A broken support becomes new resistance.
This behavior is known as Role Reversal, one of the most powerful principles in chart analysis.
⚖️ The Professional Mindset
Support and resistance are zones, not exact numbers.
The market may slightly move above or below them before reacting — this is known as a fake breakout.
Professional traders look for confirmation such as reversal candles, volume spikes, or RSI divergences before acting.
The key is not to memorize lines but to read crowd behavior.
Once you understand why people buy or sell at certain points, you gain a true edge over the average trader.
🧩 Conclusion
Support and resistance are not just lines on a chart; they are the visible footprints of fear, greed, and collective memory in the market.
By understanding their psychological and structural roots, you can identify better entry and exit zones,
predict reactions more accurately, and avoid emotional mistakes.
Learn to read the emotions behind the candles — because at its core, the market is simply a crowd of human minds trying to win.

Bitcoin Daily Analysis – October 22, 2025🟠Bitcoin remains in a phase of uncertainty, with market sentiment heavily influenced by global macro events. Developments around interest rate decisions, U.S.–China tariff policies, and ongoing geopolitical tensions in the Middle East could all play a decisive role in shaping Bitcoin’s next move.
🕰️ In this phase, patience is the key to success — avoid rushing into large positions until we see clearer confirmation of trend direction and market risk appetite.
🎯 Until the broader trend becomes more defined, traders can take advantage of short-term long and short triggers on lower timeframes, while maintaining strict risk management and discipline.
Disclaimer:
This content is for informational purposes only and does not constitute financial or investment advice. © DIBAPRISM
Larry D.Kohn

TRON on its absolute Bull Cycle Support. Can it hold?Tron (TRXUSD) is on its 3rd straight week trading on the 1W MA20 (red trend-line). In fact that level has held and closed both previous 1W candles above it, despite getting breached marginally.
The current Bull Cycle since the November 2022 bottom, has been dominated entirely by a Channel Up, that only broke once on the December 2024 massive spike. Besides that, it has been using the 1W MA20 as its pull-back and buy signal. The zone it has created along with the 1W MA50 (blue trend-line) has been the ultimate Buy Zone of this pattern.
As a result, this is technically a strong Buy Signal for TRX, most likely targeting 0.47000, representing a +60.48% rise, which has been the minimum Bullish Leg rise within this Channel Up.
If however it breaks below its 1W MA50, we will have the strongest confirmation that the new Bear Cycle has technically begun, and the first Target would be 0.16000, potentially going for a contact with its 1W MA200 (orange trend-line).
-------------------------------------------------------------------------------
** Please LIKE 👍, FOLLOW ✅, SHARE 🙌 and COMMENT ✍ if you enjoy this idea! Also share your ideas and charts in the comments section below! This is best way to keep it relevant, support us, keep the content here free and allow the idea to reach as many people as possible. **
-------------------------------------------------------------------------------
💸💸💸💸💸💸
👇 👇 👇 👇 👇 👇

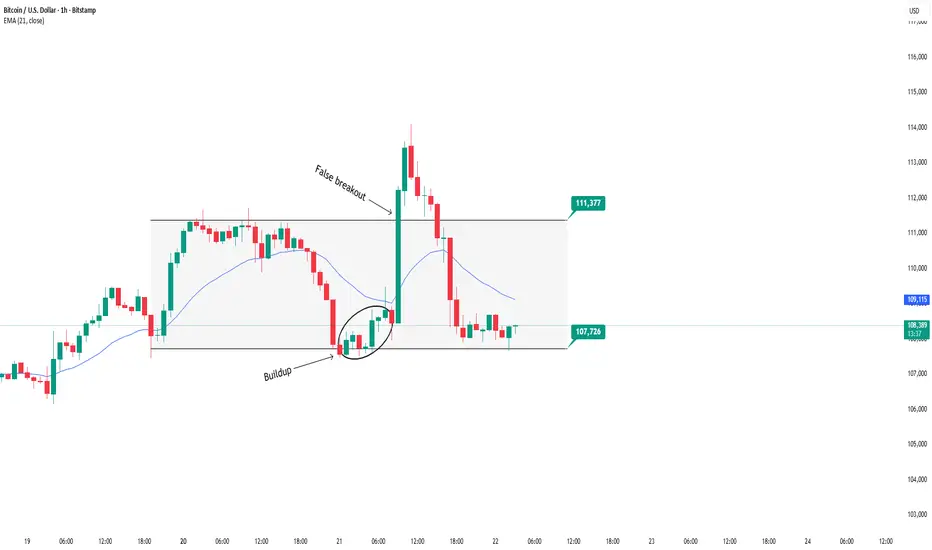
BTCUSD: Sideways - Watch for setup near range boundariesBITSTAMP:BTCUSD Analysis – October 22, 2025
BITSTAMP:BTCUSD is currently trading within a sideways range between 107,726 and 111,377 USD. After a breakout attempt, the price formed a buildup zone near the lower boundary of the range and surged upwards. However, it then created a false breakout at the upper boundary before pulling back to retest the previous buildup area.
This false breakout was caused by weakening buying momentum after breaking above the range, partly because the buildup zone was too far from the upper boundary, limiting the follow-through. According to yesterday’s plan, we are waiting for a buildup close to the upper boundary and EMA compression to confirm a valid breakout.
Trading plan for today:
Look to sell when price forms a buildup near the lower boundary of the range with EMA compressing close. Enter the trade upon the appearance of rejection signals such as RB or ARB.
The buy setup has not yet formed clearly but may be considered if an IRB appears within the larger BTC range.
In summary, BTC is still in an accumulation phase. Prioritize waiting for confirmed signals before entering trades to minimize risk.
Daniel Miller @ ZuperView
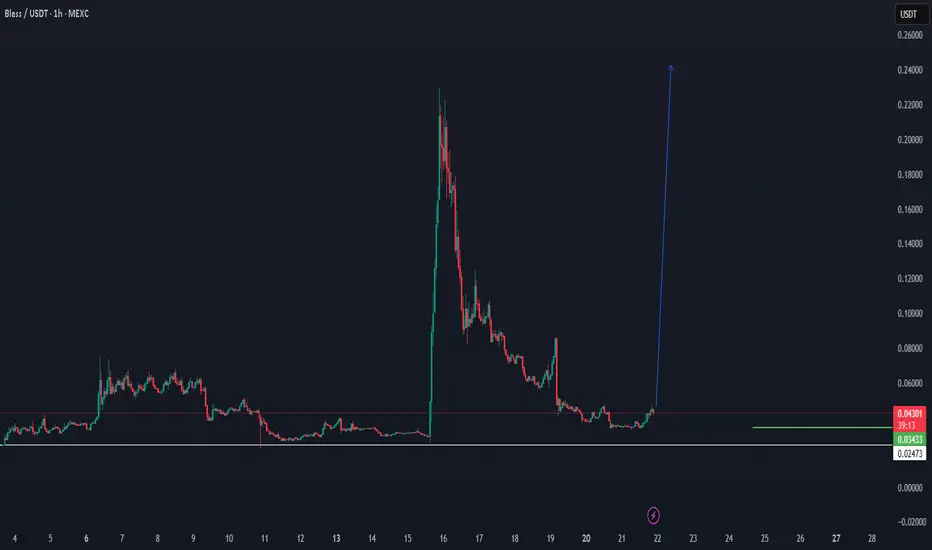
BLESS CAN DO IT AGAIN.. BACK TO $0,20+We following Bless from this bottom trend, with the expecting that it can return again with new wave, it can take some time, but the high chance is there depending on data.
BTC/USDT 4H AnalysisAfter taking out the sell-side liquidity, Bitcoin has shown signs of reversal and filled previous imbalance zones.
Currently, price is reacting from a Fair Value Gap (FVG) around the 110K area after a market structure shift (MSS).
🟢 The bullish scenario suggests that if this FVG holds, BTC could aim for the next buy-side liquidity around 126K as the main target.
🎯 First target: 115K – liquidity area above the short-term high.
🚀 Final target: 126K – buy-side liquidity sweep.
📌 Key zones:
Sell-side liquidity taken ✅
FVG (Potential bullish continuation area)
Buy-side liquidity at 126K
📅 Analysis based on Smart Money Concepts (SMC) and liquidity flow.
📖 For educational purposes only — not financial advice.

ZBTUSDT.P: short setup from daily support at 0.3052BINANCE:ZBTUSDT.P has been steadily declining since its initial listing. The 0.3052 level marks the price at which the decline stopped two days ago, and today the asset has already tested this level precisely. If volatility remains low and the asset continues to move closer to it, this would represent a technically favorable setup for trading.
Key factors for this scenario:
Global & local trend alignment
Price void / low liquidity zone beyond level
Volatility contraction on approach
Immediate retest
No reaction after a false break
Closing near the level
Was this analysis helpful? Leave your thoughts in the comments and follow to see more.

MEMECORE/USDT — Range Recovery Forming, Watching Higher levelsMEMECORE has shown a steady rebound from the lower range near $2.00, regaining short-term momentum as it attempts to reclaim the $2.34 zone, which has acted as a strong resistance multiple times.
A confirmed breakout above $2.34 would signal a shift in momentum and open the path toward the range high at $2.53, where the next major liquidity zone sits.
📊 Technical Overview:
Range Support: $2.00
Range Resistance: $2.34
Breakout Target: $2.53
Bias: Neutral → Bullish above $2.34
If MEMECORE continues to hold above the $2.00 base with rising volume, the structure suggests potential for a range breakout and short-term trend reversal.
📈 Outlook: Building strength inside range
🎯 Targets: $2.34 → $2.53

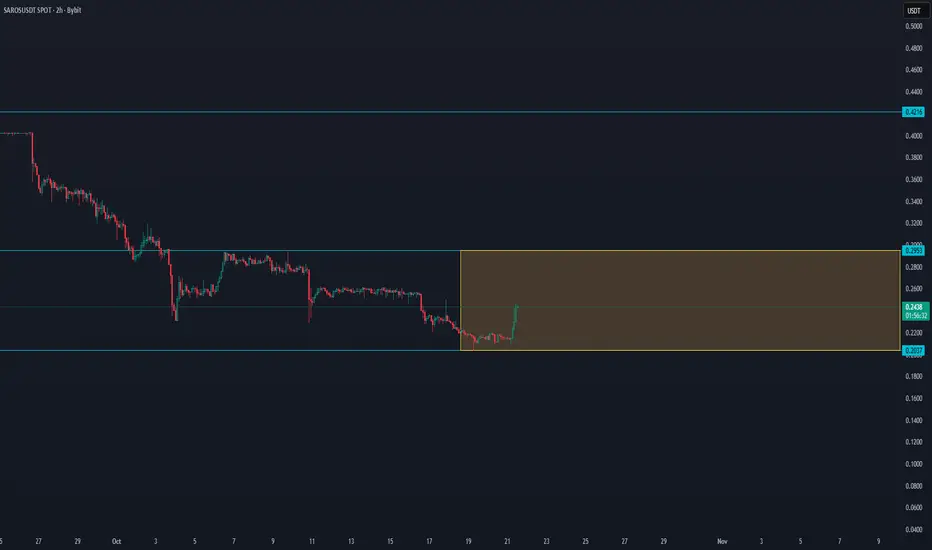
SAROS/USDT — Range Reversal Forming, Eyeing Breakout Toward $0.3SAROS/USDT — Range Reversal Forming, Eyeing Breakout Toward $0.30 🚀
SAROS is showing a strong early rebound after testing its range low at $0.203. The price has now reclaimed the mid-range zone near $0.24, indicating buying pressure returning and a potential shift in short-term momentum.
The key resistance and confirmation area is found near $0.295 — a breakout above this level could signal the start of a trend reversal, with further upside potential toward $0.42 if volume confirms.
📊 Technical Overview:
Range Low Support: $0.203
Range High / Breakout Zone: $0.295
Extended Target: $0.421
Bias: Accumulation → Bullish shift once $0.295 breaks
If SAROS maintains this momentum and reclaims the upper range, the structure suggests a strong continuation setup forming for the next leg higher.
📈 Outlook: Building strength inside the range
🎯 Targets: $0.295 → $0.42
Ripple Is Still Bullish Despite Recent Spike LowerRipple is still bullish despite the recent spike lower, which can act as a strong support from a technical and Elliott wave perspective.
Ripple is a blockchain-based digital payment protocol designed for fast, low-cost international money transfers. Its native cryptocurrency, XRP, helps facilitate transactions between different currencies, making cross-border payments quicker and cheaper compared to traditional systems like SWIFT.
Ripple sold-off recently and it made a huge spike lower due to the market manipulation, but these spikes usually act as a strong support. It still looks like a complex W-X-Y correction in wave IV on a daily chart, which can now resume the bullish trend within final wave V of (V).
In the 4-hour chart, we can see a massive spike down, but out of wave (B) triangle pattern, so it’s a penultimate move into wave (C) of Y. With the current strong rebound and recovery, seems like bulls are back in the game, and it looks to be forming a bullish setup with waves 1 and 2. So watch out for further rally within wave 3 of a five-wave bullish cycle, especially if jumps back into 2.7 area and later above 3.10 bullish confirmation level.

BITCOIN The NIGHTMARE chart you don't want to see right nowBitcoin (BTCUSD) is on the verge of establishing an LMACD Bearish Cross on the 1M time-frame, which for better reliability needs to close the current 1M candle (October) to confirm it.
** The nightmare LMACD Bearish Cross **
As the title says, this is a 'nightmare' development for the market, certainly not something that the majority of investors want to see right now, as this Bearish Cross has had disastrous effects every time it took place at the end of the 4-year Cycle.
First of all, let's not allow being overlooked the fact that the 1M LMACD is also reversing right before a test of its multi-year Lower Highs trend-line. That line priced all previous Cycle Tops.
** Is this a Cycle Top? Best-worst case scenarios**
Back to he Bearish Cross, it has always been formed around Cycle Tops as well. More specifically, the one that was formed after January 2014, was already on the 3rd month after the Cycle Top. The one that was formed after February 2018, was on the 4th month of the Bear Cycle. More recently, the one that was formed on August 2021 was 3 months before the Cycle Top. Interestingly enough, that was a peculiar Cycle with an (almost) Double Top, which was no surprise that the LMACD got rejected on its Lower Highs trend-line much earlier on the April 2021 Top.
As a result, the best case scenario based on this model for BTC is to have another 3 months of Bull, especially if it gets aided by favorable news (Trade deal, rate cuts, adoption). The more likely however historically, especially if October closes in red in 10 days, is that Bitcoin has entered a new Bear Cycle and this MACD Bearish Cross comes to confirm it.
** How low can it go?? **
What's even worse is that, if we've already seen the Top, the market tends to decline on average by more than -80% historically, with the last Bear Cycle suffering losses of almost -78% (the softest Cycle of all). It was also the only one that closed a month (numerous 1M candles actually) below the 1M MA50 (blue trend-line) unlike the first two, which used that as a Support/ Cycle Bottom. As a result, the best case scenario if a new Bear Cycle has already started is to place a bottom on its 1M MA50 around $60000 - 65000 and the worst to decline by -78% around $30000 (or a little worse).
Again, not the kind of technical analysis most want to be seeing right now..
** The positive look **
For conclusion, we should always keep in mind that the fundamental scenery/ environment changes with every Cycle in a more favorable way, e.g this Cycle we had much stronger institutional adoption, even national treasuries and more importantly we saw the introduction of the Bitcoin ETF by Blackrock which was a game changer in capital inflows. You don't see often such investment bank giants 'allowing' one of their products to tank by -80%.
But what do you think? Are we already in a Bear Cycle or there are some more months left in the Bull's tank? Feel free to let us know in the comments section below!
-------------------------------------------------------------------------------
** Please LIKE 👍, FOLLOW ✅, SHARE 🙌 and COMMENT ✍ if you enjoy this idea! Also share your ideas and charts in the comments section below! This is best way to keep it relevant, support us, keep the content here free and allow the idea to reach as many people as possible. **
-------------------------------------------------------------------------------
💸💸💸💸💸💸
👇 👇 👇 👇 👇 👇

BTCUSD: Waiting for EMA pullback and bullish setupBITSTAMP:BTCUSD Analysis – October 20, 2025
Overview:
After a strong drop to the 103,600 area, BITSTAMP:BTCUSD is showing a solid recovery momentum. Price has broken out of the previous accumulation range and made a pullback, but the early buying opportunity has already passed.
Trading Plan for Today:
Currently, price is approaching a previous key resistance level—a critical zone to watch for reaction.
The main strategy is to wait for a pullback toward the EMA zone and look for a confirmed buy setup based on one of the following patterns:
DD (Double Doji) – indicating a potential pause and reversal.
SB (Second Break) – confirming continuation of the bullish trend.
Alternative Scenario:
If BTC continues to rally strongly without a pullback and breaks above the key level.
It’s better to stay on the sidelines rather than chase the move.
Avoid FOMO when the market doesn’t offer a clear setup — patience usually brings higher-probability entries.
Daniel Miller @ ZuperView

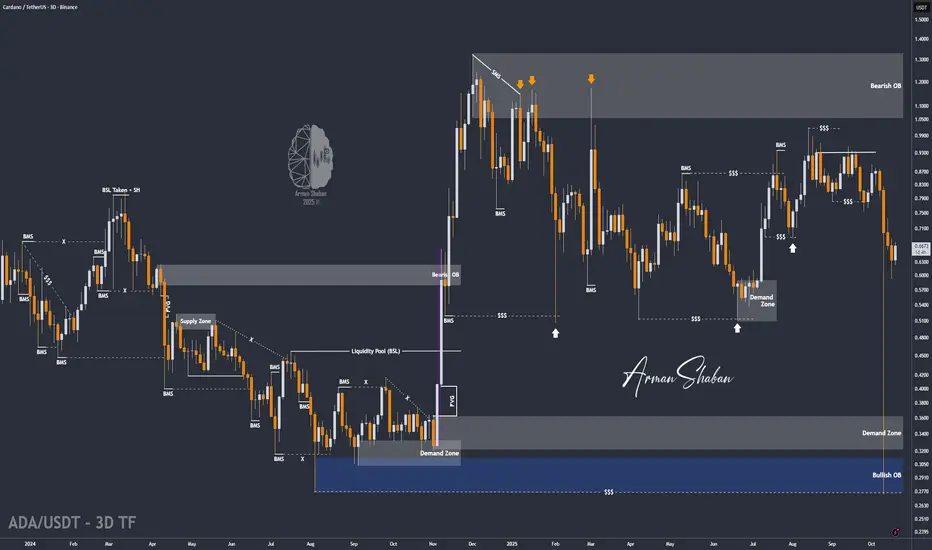
ADA/USDT | Demand Zone Holds, Bulls Gaining MomentumBy analyzing the #Cardano chart on the 3-day timeframe, we can see that after dropping to around $0.59 , ADA once again reacted strongly to demand, rebounding to the $0.66 area. This confirms that buyers are still defending lower levels and that the $0.58–$0.63 zone remains a key support range.
The overall structure is still bullish within accumulation, and this latest bounce could mark the beginning of a gradual recovery phase. As long as ADA holds above $0.63 , the next upside targets remain $0.75, $0.85, and $1.00 — with momentum likely to build if Bitcoin maintains stability above $112K .
This recovery reinforces the idea that ADA is quietly preparing for its next major move upward after weeks of consolidation.
Please support me with your likes and comments to motivate me to share more analysis with you and share your opinion about the possible trend of this chart with me !
Best Regards , Arman Shaban
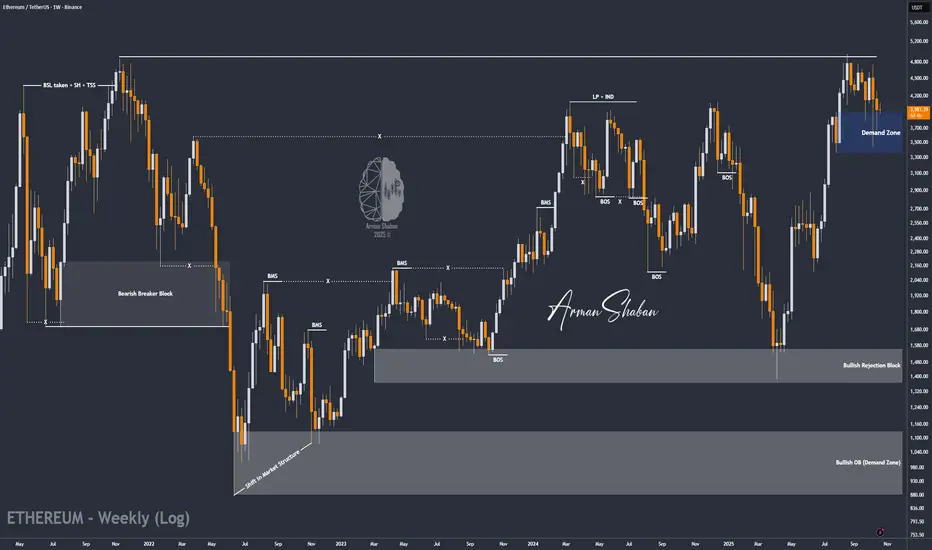
ETH/USDT | ETH Update – Waiting for Confirmation Above $4K!By analyzing the #Ethereum chart on the weekly timeframe, we can see that price has been consolidating around the $4,000 level after a sharp recovery from the $3,400 demand zone. This sideways movement shows ongoing accumulation, but a clear breakout and close above $4,000 is still needed to confirm renewed bullish momentum.
As long as ETH holds above the $3,900–$4,000 support range, the broader bullish outlook remains valid. The next upside targets are $4,950, $5,500, and $6,000 , but continuation strongly depends on Bitcoin’s ability to stay above $112K .
In short — ETH is gearing up for its next move, but the key lies in a confirmed breakout above $4K with BTC providing stability.
Please support me with your likes and comments to motivate me to share more analysis with you and share your opinion about the possible trend of this chart with me !
Best Regards , Arman Shaban
LTC/USDT | LTC Update – Bulls Back in Control!By analyzing the #Litecoin (LTC) chart on the weekly timeframe, we can see that after testing the $76–$88 demand zone, LTC has continued its recovery and recently climbed to around $94.5 , showing that buyers are still defending key levels strongly.
The overall structure remains bullish — as long as the price holds above $88, the outlook stays positive. The next upside targets remain $100, $114, and $120, where short-term resistance could appear before the next breakout attempt.
This steady recovery once again confirms Litecoin’s technical strength and the reliability of its long-term demand zone. If momentum holds, we could soon see another strong push toward the $100 mark and beyond.
Please support me with your likes and comments to motivate me to share more analysis with you and share your opinion about the possible trend of this chart with me !
Best Regards , Arman Shaban

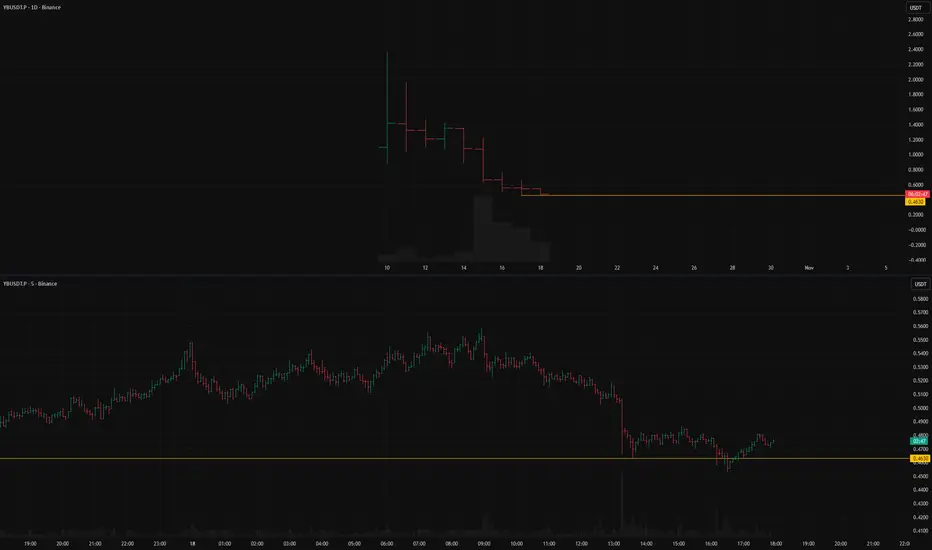
YBUSDT.P: short setup from daily support at 0.463BINANCE:YBUSDT.P is trading near its historical low and continues to confirm the established level. A strong signal came from today’s false breakout, to which the asset showed no meaningful reaction. On the next approach to the level, monitoring volatility and entry formation will be key.
Key factors for this scenario:
Global & local trend alignment
Price void / low liquidity zone beyond level
Correlation with the market
Volatility contraction on approach
Immediate retest
No reaction after a false break
Closing near the level
Closing near the bar's extreme
Was this analysis helpful? Leave your thoughts in the comments and follow to see more.
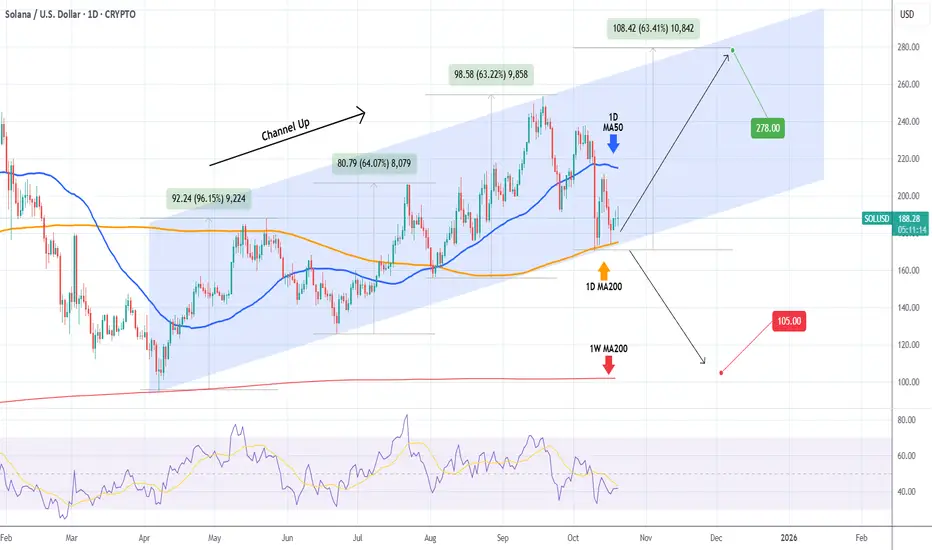
SOLANA 1D MA200 is the only level holding it from falling apart.Solana (SOLUSD) has been trading within a very structured Channel Up pattern since the April 07 bottom, which was priced exactly on its 1W MA200 (red trend-line). The recent pull-back though (Bearish Leg) has got the market testing another key Support level, the 1D MA200 (orange trend-line).
So far this has held on 4 successive tests, technically pricing a new Higher Low on the bottom of the Channel Up. This is what separates the start of the new Bullish Leg towards at least $278.00 (representing a +63.00% rise, the minimum rally so far inside this pattern) from a complete collapse to $105.00 and the 1W MA200. SOL needs to keep closing its 1D candles above the 1D MA200 to maintain the bullish trend.
-------------------------------------------------------------------------------
** Please LIKE 👍, FOLLOW ✅, SHARE 🙌 and COMMENT ✍ if you enjoy this idea! Also share your ideas and charts in the comments section below! This is best way to keep it relevant, support us, keep the content here free and allow the idea to reach as many people as possible. **
-------------------------------------------------------------------------------
💸💸💸💸💸💸
👇 👇 👇 👇 👇 👇