AGT/USDT — Breakout Formation from Accumulation Zone ImminentAGT/USDT — Breakout Formation from Accumulation Zone Imminent 🚀
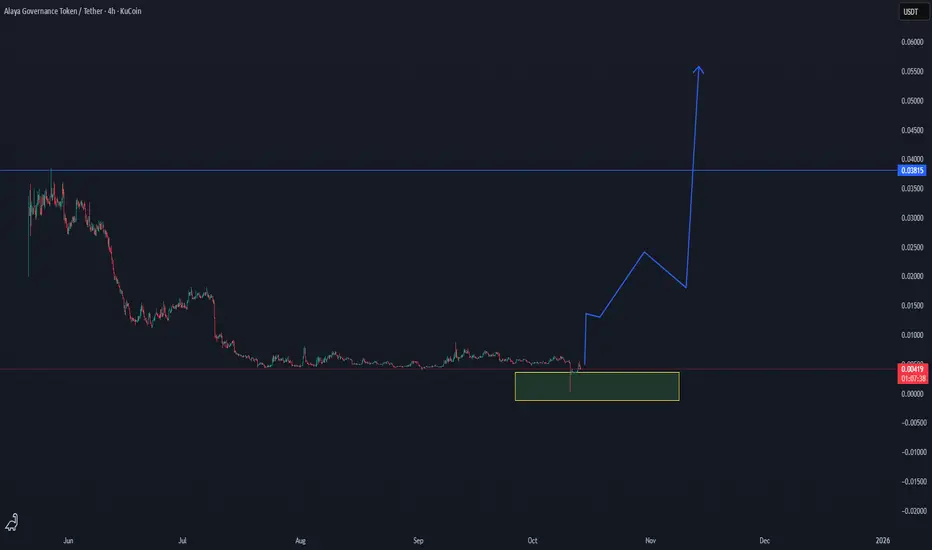
AGT has entered a strong accumulation zone after a prolonged downtrend, showing the first technical signs of a potential trend reversal. The current consolidation within the highlighted support block suggests that buyers are stepping in, preparing for a possible breakout phase.
Low time frame confirmation is here
📊 Current Price: $0.0042
🟢 Accumulation Zone: $0.0038 – $0.0045
🔹 Breakout Target: $0.038
The chart shows a typical bottoming structure, with a long accumulation base forming under historical resistance. Once AGT confirms a breakout above $0.006, momentum could accelerate rapidly — targeting the $0.02 → $0.038 zones.
This setup mirrors classic early-cycle patterns seen before major upward expansions in similar low-cap assets. A strong breakout candle with volume will serve as confirmation of the next phase.
📈 Technical Outlook:
Accumulation structure in place
Breakout trigger above $0.006–$0.007
Main breakout target around $0.038
Summary:
AGT/USDT is building strength at the bottom of its range. If volume confirms, a major reversal cycle could be underway, opening the path toward a breakout to $0.038 and beyond.
🎯 Targets: $0.02 → $0.038
📊 Bias: Bullish — Breakout Setup Forming
Cryptocurrency
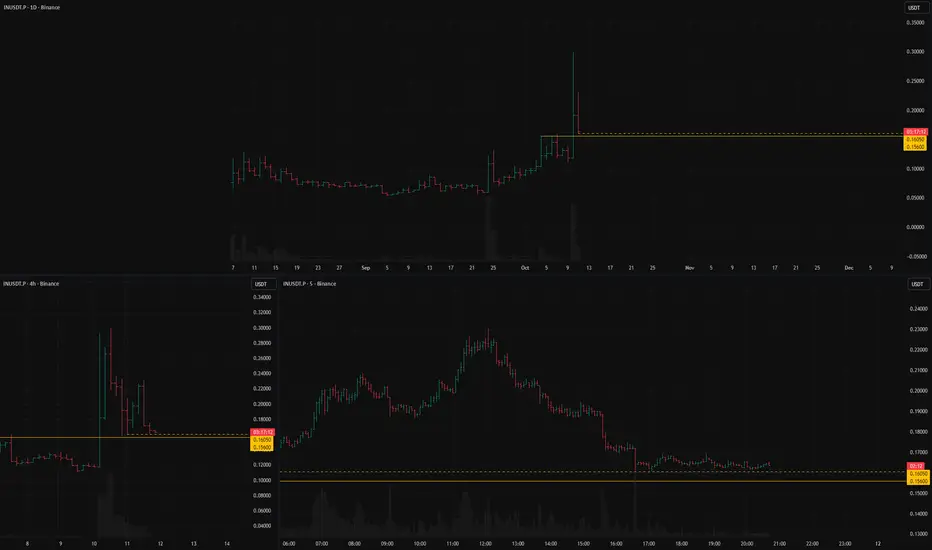
INUSDT: short setup from daily support at 0.16050Note that the current setup BINANCE:INUSDT.P is rather localized.
However, the overall trend in the asset remains clear — a consistent dump pattern of “drop — pause — further decline.”
A solid pre-breakdown base is forming, providing an opportunity for a tight and well-defined stop placement.
Key factors for this scenario:
Global & local trend alignment
Price void / low liquidity zone beyond level
Correlation with the market
Volatility contraction on approach
Immediate retest
Closing near the level
Was this analysis helpful? Leave your thoughts in the comments and follow to see more.
BITCOIN Short squeeze in action with 1W MA50 saving the day?Bitcoin (BTCUSD) is rebounding rather as aggressively as it flash crashed on Friday following President Trump's threats on new China tariffs. We've seen the outcome of such Trade War threats back in February - April. In fact that was the last time (April 09 2025) that BTC hit its 1W MA50 (red trend-line). Following that, an enormous long-term rally followed that made new All Time Highs (ATH).
Friday was the first time since then that the price almost touched the 1W MA50, while breaking through the 1D MA200 (orange trend-line) for the first time since April 22. Friday's Low is so far technically a Higher Low on the 1-year Rising Wedge pattern.
The more U.S. and China seem to agree on a new truce and not move forward to escalate threats into actions, the stronger the current short squeeze will be in the market and the current rally will most likely target the top (Higher Highs trend-line) of the Rising Wedge on the key psychological level of $130000.
If however it appears that agreements fall through and the bottom (Higher Lows trend-line) of the Rising Wedge breaks, we expect a deeper and potentially more aggressive fall to he 1W MA100 (green trend-line) around $85000. It also has to be mentioned that Friday's Low hit the 1D RSI 4-month Support Zone and rebounded.
Which scenario do you think is more likely to happen? Feel free to let us know in the comments section below!
-------------------------------------------------------------------------------
** Please LIKE 👍, FOLLOW ✅, SHARE 🙌 and COMMENT ✍ if you enjoy this idea! Also share your ideas and charts in the comments section below! This is best way to keep it relevant, support us, keep the content here free and allow the idea to reach as many people as possible. **
-------------------------------------------------------------------------------
💸💸💸💸💸💸
👇 👇 👇 👇 👇 👇

BTC 117.70K determines the next stepMorning folks,
So, old Donny has put dirt to everybody... of course we were watching for the drop, as we discussed it on Thu, but it should had to be just a pullback. Obviously we got no entry signal on Friday collapse.
Now there are a few interesting patterns are forming monthly/weekly charts, but it is a different story. Here we suggest to give market some time to calm down. In fact, daily price shape is very similar to huge Bearish engulfing pattern. So, we do not exclude some downside continuation if BTC holds below 170.70K resistance area. In fact, this is the key to the next step.
Upside breakout of this area will erased the whole Friday's collapse, and mostly will be bullish...
But right now we do not consider any trades.

Bitcoin Faces Sudden Shakeout After Weeks of CalmBitcoin Volatility Returns as Market Momentum Resets
Hello Traders,
The Bitcoin market experienced a sudden burst of volatility in the recent session, ending a period of relative calm. On the 4H timeframe (Binance), intense selling pressure drove prices from near $117,000 down to roughly $109,000 before stabilizing around the $112K region. The swift decline marked a clear shift in short-term momentum, showing that buyers are beginning to lose dominance as broader market sentiment cools.
This pullback unfolded against a backdrop of renewed global uncertainty. A series of trade-related policy headlines reignited risk aversion, while continued strength in the U.S. dollar added additional stress to crypto markets. Institutional flows briefly reversed, signaling reduced confidence in near-term upside potential. The result was a wave of forced liquidations, magnified by leverage, as traders rushed to adjust exposure during the drop.
Despite the intensity of the move, market conditions remain structurally healthy. On-chain data shows that long-term holders are largely unmoved, suggesting this phase is more of a short-term repricing than a major cycle reversal. Derivative markets, however, have cooled significantly — open interest has thinned, and funding rates have normalized, indicating a temporary reset in speculative participation.
In the coming days, Bitcoin’s behavior will likely depend on liquidity dynamics rather than new macro data. With upcoming U.S. economic reports delayed and the dollar holding firm, volatility may persist as traders respond to headlines and reposition ahead of the next policy developments.
For now, the market appears to be in a state of balance after rapid liquidation. Whether this forms a new accumulation base or precedes deeper correction will depend on how quickly momentum returns. The broader sentiment remains cautious but stable — a waiting phase, as the market tests its conviction once more.

BTC Game Plan - DTB ModelBTC Game Plan – DTB Model
📊 Market Sentiment
After the sharp 10/10 crash triggered by Trump’s announcement of up to 100% tariffs on Chinese imports, risk assets — especially altcoins — faced massive liquidation, with some dropping over 80%.
As of 12/10, headlines indicate that Trump may reach out to President Xi, with Vice President Vance clarifying the statement. The market reacted bullishly, showing a strong rebound.
However, sentiment remains neutral, as volatility persists and geopolitical uncertainty continues to influence short-term direction.
📈 Technical Analysis
BTC retraced into the HTF Demand Zone, running the daily swing liquidity inside it.
Additionally, price retested the bearish trendline, confirming it as a key technical pivot.
Currently, BTC is attempting to recover toward the equilibrium (0.5 Fibonacci) of the recent decline.
📘 Model to be used – Demand to Trendline Break (DTB Model)
1-Identify HTF trend and valid demand zones.
2-Wait for liquidity sweep inside demand for energy confirmation.
3-Watch for price recovery toward equilibrium (0.5 fib).
4-Confirm with a strong close above bearish trendline and equilibrium for entry signal.
📌 Game Plan
I’ll be waiting for BTC to break and close above the 0.5 Fibonacci (equilibrium) and the orange bearish trendline. That will be the first confirmation that the bearish phase may end, and momentum may shift to the upside.
🎯 Setup Trigger
Daily strong close above the orange bearish trendline and 0.5 Fibonacci equilibrium level.
📋 Trade Management
Stoploss: Below $107,500 (protecting capital is more important than chasing profits)
Target: $126,300 (near previous all-time highs)
💬 Like, follow, and comment if this breakdown supports your trading! More setups and market insights coming soon — stay connected!
⚠️ Disclaimer: This content is for informational and educational purposes only and does not constitute financial, investment, or trading advice. Always DYOR before making any financial decisions.

TradeCityPro | AVAXUSDT Further Decline or Time to Rise?👋 Welcome to TradeCityPro Channel!
✨ Let’s move on to Avalanche (AVAX) one of the older coins in the market, mostly active in the DeFi ecosystem with its own network and solid utility. It’s often considered a bull-run project due to its long-term relevance and use cases.
🌐 Overview of Bitcoin
Before we begin, let me remind you that we’ve moved the Bitcoin analysis section to a separate daily report at your request,
so we can go into more detail about Bitcoin’s condition, price action, and dominance:
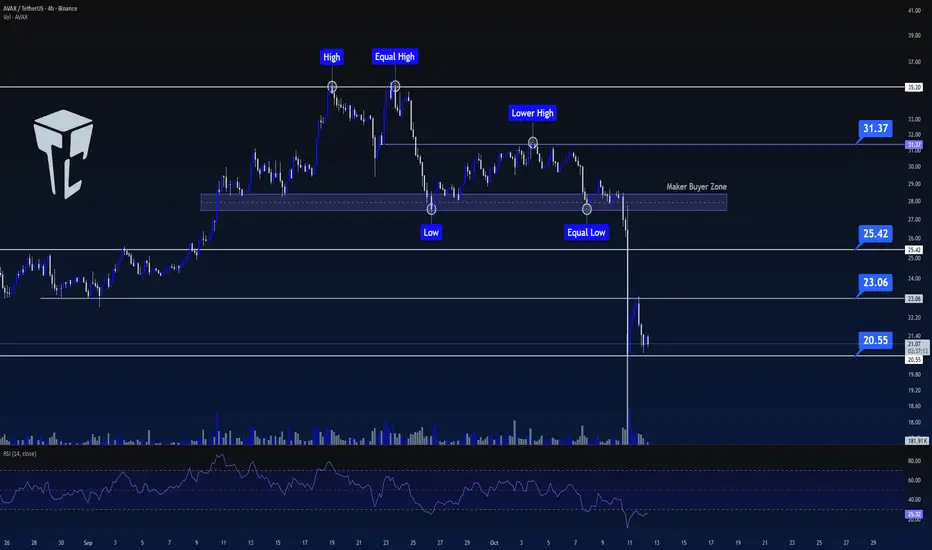
🕧 In the 4-hour timeframe, after the recent market crash, AVAX is trying to build a new structure and stabilize its price action.
🟢 Long Setup:
It’s still too early to go long, but AVAX has shown a partial recovery compared to other coins, and its drop hasn’t been as deep.
For a long position, we should either range here for a while and enter after a confirmed breakout above 23.04,
Or wait for a higher high and higher low formation to confirm a bullish structure before entering.
🔴 Short Setup:
The short scenario is clear if 20.57 breaks with volume, it would signal bearish continuation, and opening a short position would be reasonable.
📝 Final Thoughts
Stay calm, trade wisely, and let's capture the market's best opportunities!
This analysis reflects our opinions and is not financial advice.
Share your thoughts in the comments, and don’t forget to share this analysis with your friends! ❤️
BITCOIN – THE REAL REASON BEHIND THE FALLWhen I started trading someone told me something I’ll never forget: “If you can predict tomorrow’s newspaper headline, you understand the market.”
He didn’t mean I should chase news. He meant I should read structure so well that I know what kind of headline the market is already writing, before the mass even see it.
And now, looking around online, I see the complete opposite. Everywhere you look, there’s another “confluencer” talking about crypto with big words and zero understanding.
People selling dreams, memberships, and indicators, while they don’t even know what open interest or CVD means.
I’m not here to sell anything. I’m here to help people actually learn how to read data and see through the noise. Because what most of these so-called experts call “analysis” is just emotional guessing wrapped in confidence.
What I called and what happened
Last week I posted my “Big Dump” thesis.
I said Bitcoin would swing fail above the highs, then drop into the 104K region. That is exactly what happened.
Price ran the sweep into 126K, trapped the late buyers, and dumped straight into 104K.
People blamed tariffs. The tariff headline was the spark. The fuel was crypto’s own positioning.
Why the structure was ready to snap
Before the crash, the data told the story clearly.
Stablecoin OI went from 257K to 285K contracts (+10.9%). That is new leveraged exposure.
Coin-margined OI dropped during the breakout, then rose again near the highs. Shorts were fading strength.
Spot CVD stayed flat to slightly negative. Real buyers were missing.
The long/short ratio fell from 2.05 to 1.02 even while price kept climbing.
That’s what distribution looks like. Buyers on leverage pushing price up while stronger hands sell into them. No real spot demand, just futures exposure.
You don’t need a macro event to fall. You only need a reason for those leveraged buyers to stop bidding. Think of it like a crowded elevator. Everyone keeps piling in as it moves up, feeling safe because it hasn’t stopped yet. But the moment one person hesitates, the weight shifts. When the next person panics, the whole thing drops.
That’s what happens when a market is driven by leverage instead of conviction. You don’t need bad news, you just need hesitation.
Look back at similar events.
In May 2021, funding rates were insane, perps overloaded, and spot volume thin. Elon Musk tweeted about Bitcoin’s energy use. That tweet didn’t cause the dump. It just made leveraged longs pause. The bids disappeared and the cascade started.
In August 2023, Evergrande headlines hit. Bitcoin was sitting at resistance with flat spot CVD and rising OI. Equities wobbled, crypto longs hesitated, and the structure collapsed within hours.
In March 2020, when COVID panic hit, Bitcoin had already been stretched thin. Funding was high, leverage was heavy, and liquidity was weak. The virus didn’t break the market, leverage did.
Leverage creates confidence until it doesn’t. Price doesn’t fall because people start selling. It falls because nobody steps in to buy. Headlines decide when the drop starts. Structure decides how far it goes.
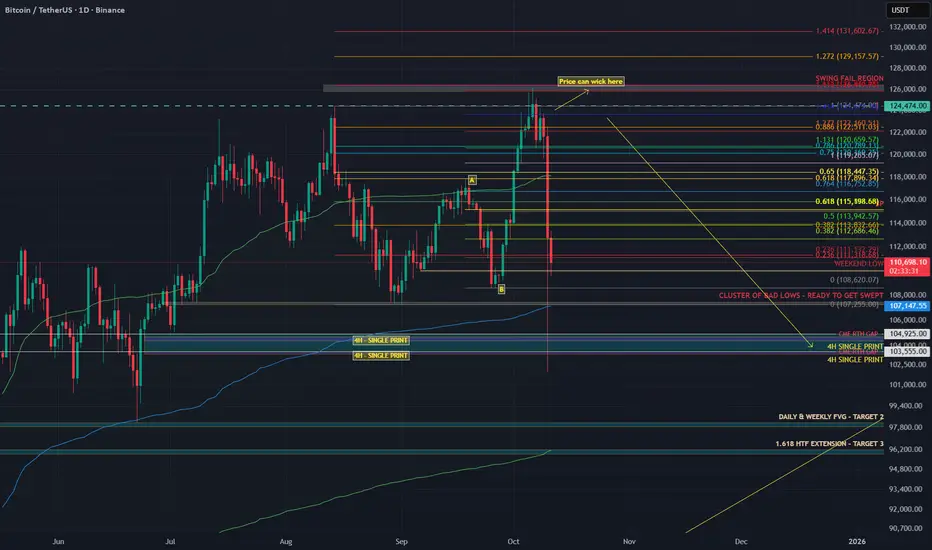
Why 104K was my first target
I didn’t pick 104K out of thin air. That level was built on confluence.
1) AVWAP from the April 7 auction
That swing low kicked off with massive volume. When a move starts with that kind of participation, the anchored VWAP becomes a key reference for institutional flow. It represents the average cost of that whole auction, and when extended forward, it acts as a dynamic area where liquidity and algorithms interact.
That blue AVWAP line from April has been running right through the 104K region.
It’s not that price revisited that auction, it’s that the anchored VWAP from that event still marks the fair value area for that entire move.When price traded back down into that region, it met that same volume-weighted anchor, creating a major confluence zone that algos and larger players watch closely.
2) The June 22 breakout left an LVN
A new auction started on June 22 and pushed higher, leaving a Low Volume Node behind.
An LVN is a thin zone on the volume profile where the market moved quickly with little trade.
Markets often revisit these thin areas later to find balance or test unfinished business.
3) HTF Fibonacci cluster
Multiple higher timeframe Fibonacci retracements and extensions overlapped near the same 104K area. When several fib levels align with structure, that’s a strong confluence zone watched by both human traders and algorithms.
The 104K region was where the AVWAP line, LVN, and fib cluster all met. That’s not a random target. It’s a structurally defined area where liquidity concentrates and where markets tend to react sharply. And that’s exactly what happened.
The spark versus the structure
The tariff headline didn’t cause the drop. It triggered it.
The structure was already unstable. Leverage was maxed. Spot demand was flat. Funding was positive and rising. When the tariff news hit, traditional markets pulled back and crypto followed instantly. It wasn’t correlation, it was liquidity contagion.
Traders managing multiple books de-risk across assets when volatility spikes. That creates a gap in liquidity. When the bids vanish, the market falls into the first real pool of resting orders — in this case, the 104K zone.
You saw the same mechanics during the March 2020 crash and the 2021 deleverage. External shocks trigger internal liquidation cascades. That’s why saying “this had nothing to do with crypto is completely wrong.
This had everything to do with crypto. It’s like blaming the thunder for breaking a window when the glass was already cracked. Or saying the iceberg sank the Titanic when the captain was already steering through a sea of warnings.
Crypto was structurally weak. Leverage was stretched, spot demand was gone, and funding was positive. When the headline hit, it didn’t cause the collapse. It just gave the market permission to do what it was already set up to do — unwind.
Crypto is built on leverage.
Perpetual futures dominate volume.
Stablecoin collateral drives exposure.
When external risk events change funding conditions or risk appetite, the crypto market reacts instantly because its structure is fragile by design.
Example:
When yields spike, the dollar strengthens and funding costs rise. Leveraged longs become more expensive to hold, so traders unwind positions.
When equities dump, cross-asset desks reduce risk globally, which pulls liquidity out of crypto perps too.
Intermarket correlation always matters. Macro sets the mood. But the speed and violence of crypto moves always come from leverage inside the system.
How you can spot it next time
Compare Spot CVD vs Stablecoin CVD. If stablecoin CVD rises while spot stays flat or negative, the rally is leverage-driven.
Track Open Interest vs Price. Both rising together usually means exposure is building. Confirm with spot flow.
Watch the Long/Short ratio. If it drops while price rises, shorts are entering and the move may be getting absorbed.
Anchor VWAPs to real pivots like swing lows, breakouts, or liquidation spikes. Those levels attract institutional flow.
Study Volume Profiles. LVNs are thin and often retested. HVNs are balance zones that attract price.
Map HTF fib clusters for confluence. Reactions are stronger when multiple timeframes agree.
Note single prints and thin brackets on TPO or volume profiles. These often act as magnets.
When these factors line up, you don’t need to predict headlines.
You’ll already most likely know which headline will break the market.
TLDR
The rally was leverage-driven: Stablecoin OI up 10.9%, Spot CVD flat, Long/Short ratio down from 2.05 to 1.02
The swing fail at 126K was the final liquidity grab
104K was the target due to AVWAP + LVN + HTF fib cluster
The tariff headline was the spark, not the cause
The crash was caused by leverage and missing spot demand
Crypto didn’t fall because of politics. It fell because the market was already begging for an excuse to reset.
The data showed it clearly weeks before the drop.
If this helped you see the market a little clearer or made you think differently about how price really moves, please leave a like and drop a reaction. It keeps me motivated to keep posting real analysis, not the copy-paste bullshit hype that floods your feed every day.
Check the Order Flow Data from 6 October here: ibb.co
YTHUSDT Analysis – The Biggest Market Crash Yet!👋 Welcome to TradeCityPro Channel!
🌐 Overview of Bitcoin
Before we begin, let me remind you that we’ve moved the Bitcoin analysis section to a separate daily report at your request, so we can go into more detail about Bitcoin’s condition, price action, and dominance:
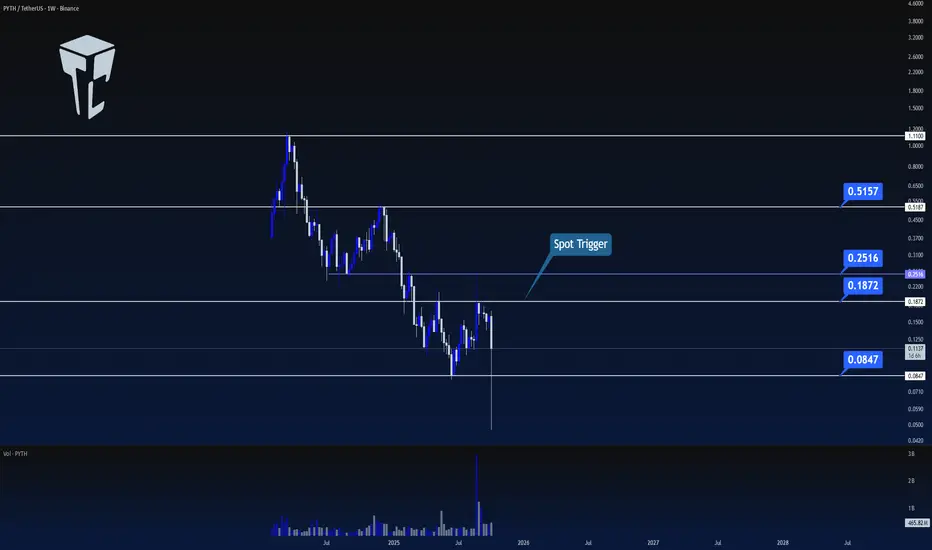
🌙 Last night, the crypto market witnessed a massive liquidation of nearly $19 billion, marking one of the biggest crashes in the history of digital assets.
📈 At this point, trading or buying in these zones isn’t logical it’s better to stay out of the market for a few days, watch the price action, and let volatility settle before making any moves.
🔥 Weekly Time Frame
After a 92% drop from its all-time high, PYTH is currently consolidating below the resistance level at $0.1851.
This area is crucial it’s acting as both a psychological and technical barrier where the next trend direction will be defined.
🟢 Spot & Long Entry Setup
⛏ If this weekly candle turns green and we see confirmation, that could become one of the best bullish triggers for accumulation.
However, the main confirmation will be the breakout above $0.1851, which would give us a solid long entry setup.
✍️ Personally, I’m planning to open a long futures position once $0.1851 breaks, and if we later break above $0.2532, I’ll use my futures profits to buy PYTH in spot and hold for a potential longer-term recovery.
📝 Final Thoughts
Stay calm, trade wisely, and let's capture the market's best opportunities!
This analysis reflects our opinions and is not financial advice.
Share your thoughts in the comments, and don’t forget to share this analysis with your friends! ❤️
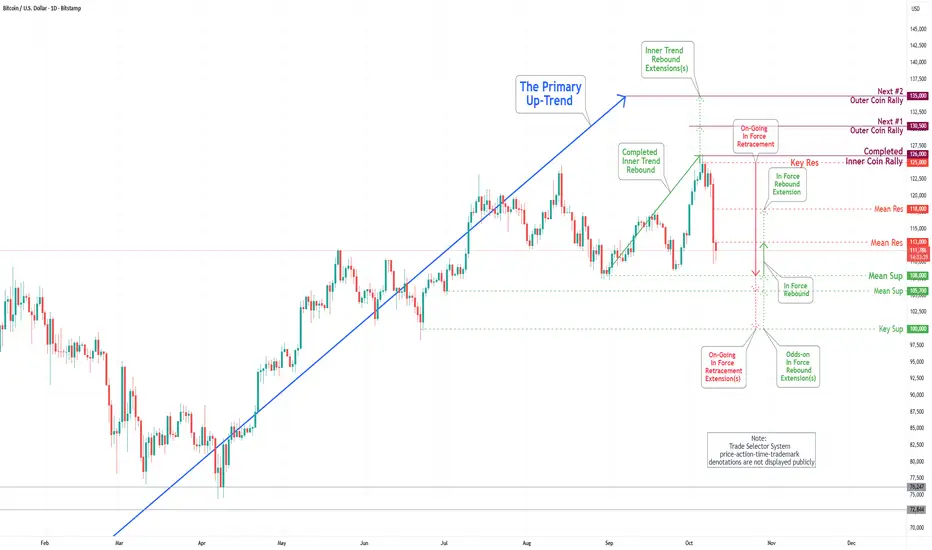
Bitcoin(BTC/USD) Daily Chart Analysis For Week of Oct 10, 2025Technical Analysis and Outlook:
During the most recent trading session, the Bitcoin market experienced a notable decline, falling below significant support levels of 120000, 117500, and 114000, respectively. Current market analysis indicates an initial potential retracement toward the Mean Support level of 108000, with further extension possibilities to the Mean Support level of 105700 and the Key Support level of 100000. It is crucial to acknowledge that intermediary rebounds may occur at these defined levels, particularly at the Mean Resistance level of 113000.
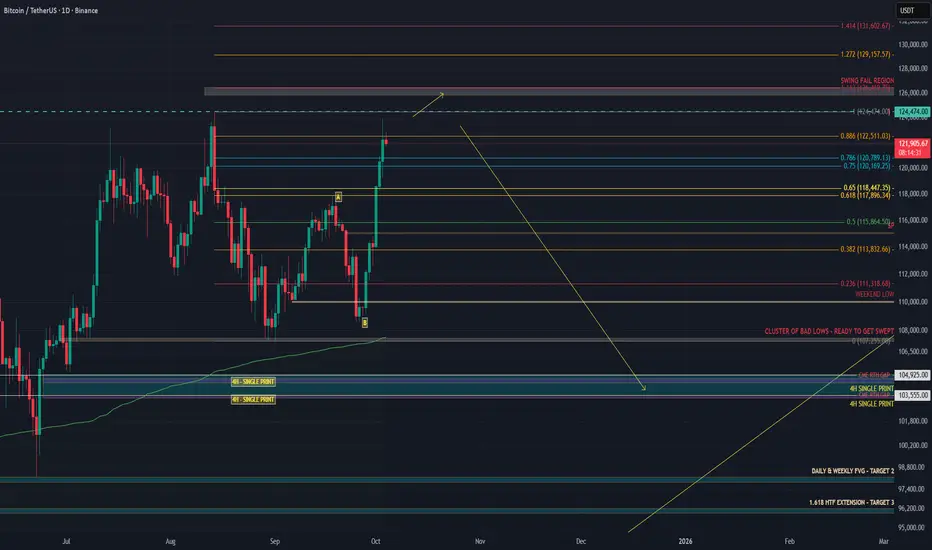
BITCOIN’S FINAL TRAP – THE SENTIMENT SWITCH IS COMING FASTIn my last BTC post I said a dump was likely based on data, and that thesis still stands. If anything, it’s even stronger now. .
On 13 August, CME made a high at 123,590.
That high was weak, no excess, flat TPO top, unfinished auction.
Binance topped at 124,474, Coinbase at 124,522.
CME opened with a gap down, leaving that poor high unrepaired with unfinished business and clean liquidity sitting above.
From 26 September, BTC started grinding up.
I expected a run of the 18 September high and a reversal around 118–119K, but price extended the move to the 1.618 extension. See my last analysis.
Structure was weak, spot CVD flat, futures CVD ripping, open interest climbing.
That shows perps were driving it, not real spot demand.
This week CME finally cleaned it up.
CME ripped through 125,025, taking out the August high at 123,590.
That level matched the old highs on Binance and Coinbase almost perfectly.
CME swept the old poor high left behind by spot and perps, completing the auction.
This is typical CME behavior, it hunts untested reference points during RTH and often reverses right after.
Flow data confirms the setup:
Spot CVD down means real buyers not following.
Stablecoin CVD pushing up means overleveraged longs chasing.
Coin-margined CVD rolling means profit taking or hedge flow.
Open interest flat at the top means trapped longs with no squeeze left.
The move looks like a leveraged markup driven by perps, cleaned up by CME liquidity, and now hanging on air.
CME repaired the August inefficiency, swept the prior spot high, and left another weak high with no excess, a textbook sign of distribution.
There’s still a chance we see one more SFP around 126K before momentum flips, but unless spot demand picks up aggressively, that should be the final liquidity grab.
My targets are 104K and 99K if 104K fails to hold, with potential for an even deeper drop beyond that level.
BTCToday, BINANCE:BTCUSDT.P dropped by around 17%. It may fall further, or it may not — but one thing I know for sure: market panic has always been my most profitable time. When fear dominates and the entire market is crashing, that’s when the best opportunities appear.
If you panic — you’re far from professionalism. If you enter, take your profit, and calmly move on — that’s a sign of skill. In trading, professionalism isn’t optional; without it, you won’t survive — and sometimes that’s quite literal.
So, in times like these — when some made quick profits, others took heavy losses, and only a few truly gained — I’ll share a thought that changed my mindset years ago. After losing a significant amount, I realized that was the true cost of the trading education I once wanted to buy.
Trade with minimal risk and invest the rest in your learning — it’s always the right investment.
And just to be clear — I don’t sell courses, and this message isn’t for profit.
It’s genuine advice. Have a great day.

TradeCityPro | NEARUSDT Ready for a Spot Buy!👋 Welcome to TradeCityPro Channel!
Let’s take a look at NEAR, which is currently moving nicely within a strong daily box, and it seems like a breakout could happen any moment!
🌐 Overview of Bitcoin
Before we begin, let me remind you that we’ve moved the Bitcoin analysis section to a separate daily report at your request, so we can go into more detail about Bitcoin’s condition, price action, and dominance:
📆 Daily Time Frame
Keep in mind that weekly and daily boxes in crypto charts are very important, because the breakout from these zones usually defines the start of a major trend.
Typically, the target range after a breakout is about the same size as the box itself for example, if the box is 10%, we might expect a similar 10% move after the breakout.
Currently, in the daily time frame, NEAR is moving inside a large box between $1.891 and $3.172, while forming higher lows, which is a bullish sign.
Recently, it also found support at the box midline, which is another strong signal of buyer activity, and the price is following a parabolic curve pattern, showing building momentum.
🚀 Spot & Long Position Setup
If NEAR breaks above $3.172, that’s our main trigger to enter a spot buy and even open a long futures position this breakout could mark the start of a strong bullish leg.
🔻 Short Position Setup
However, if the parabolic curve breaks and the price forms a lower high, then a break below $2.616 in lower time frames could trigger a short position opportunity, signaling a potential pullback phase.
📝 Final Thoughts
Stay calm, trade wisely, and let's capture the market's best opportunities!
This analysis reflects our opinions and is not financial advice.
Share your thoughts in the comments, and don’t forget to share this analysis with your friends! ❤️

BITCOIN Are you worried about this?Bitcoin (BTCUSD) is pulling back aggressively today following Trump's China-tariffs related news and this weekly rejection is far from ideal technically as well.
In recent years it's been unusual to look at the market on anything but a logarithmic scale, which is natural as it offers a fair representation of BTC's remarkable gains and parabolic Cycles.
On today's analysis however we present the long-term price action on the 1W time-frame without being on the log scale. And as you can see what stands out is a Higher Highs trend-line that dates back to the December 11 2017 Cycle Top, almost 8 years ago.
This trend-line is anything but comforting at the moment as it has caused numerous rejections with the strongest being the April 12 2021 High. More recently it has formed the July 14 2025 High, the August 11 2025 High, last week's (September 29 2025) High and so far the current one (October 06 2025).
This is far from ideal and it gets worse seeing that since the March 04 2024 High, the 1W RSI has been under Lower Highs, which is of course a Bearish Divergence against the markets Higher Highs, similar to the Lower Highs of the previous Cycle that formed the November 08 2021 Top.
This time is indeed a little different though as the RSI's current 3rd Lower High is still a Higher High for BTC while on the previous Cycle it was (March 21 2022) already a Lower High for the price as well inside a Bear Cycle that has already started.
Still, do you believe this 8-year Higher Highs trend-line rejection is alarming or not? Feel free to let us know in the comments section below!
-------------------------------------------------------------------------------
** Please LIKE 👍, FOLLOW ✅, SHARE 🙌 and COMMENT ✍ if you enjoy this idea! Also share your ideas and charts in the comments section below! This is best way to keep it relevant, support us, keep the content here free and allow the idea to reach as many people as possible. **
-------------------------------------------------------------------------------
💸💸💸💸💸💸
👇 👇 👇 👇 👇 👇

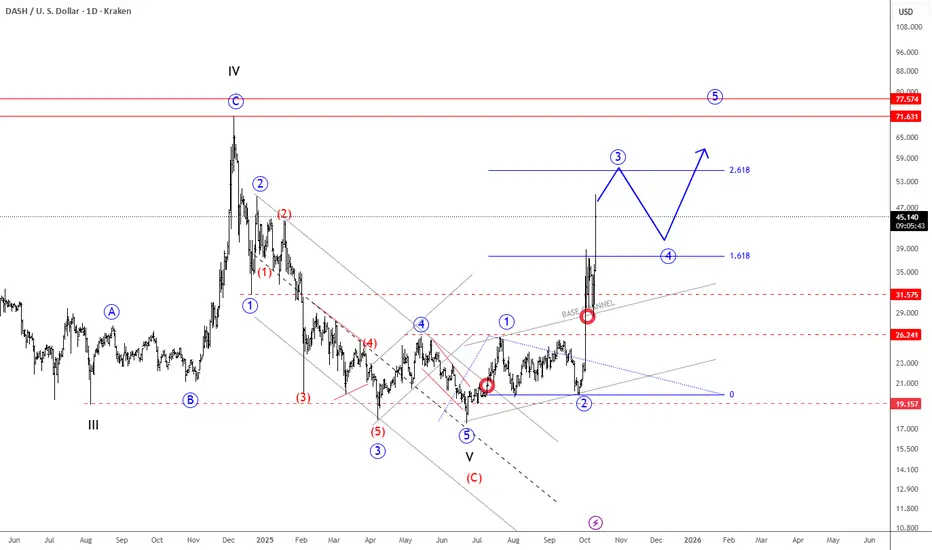
Dash Is Waking Up Strongly As AnticipatedWe talked about the bottom formation on Dash back on August 11, where we mentioned and highlighted that it's recovering from June lows out of the downtrend channel, which suggested that the impulsive decline from the 2024 highs has ended.
Dash is now in a massive rally, waking up strongly, so it's most likely in wave 3 of a five-wave bullish impulse that can extend the price even up to 70 area, we will just have to be aware of wave 4 pullback around 50-55 area. ALTseason can be here. Can other ALTcoins follow soon?
Dash is a cryptocurrency launched in 2014 that focuses on fast, low-cost payments and privacy. It uses a two-tier network with miners and “masternodes” to enable features like InstantSend (near-instant transactions) and PrivateSend (optional privacy). It started as a fork of Bitcoin.
BTCUSDTHello Traders! 👋
What are your thoughts on BITCOIN?
Bitcoin reached a new all-time high earlier this week but failed to hold above it, leading to a rejection and a short-term corrective phase.
The price is now undergoing a healthy pullback, and we expect the correction to continue until the previous breakout zone is retested.
Once this pullback completes, Bitcoin may resume its upward momentum and attempt to form a new higher high.
The broader trend remains bullish, and this correction is viewed as a buying opportunity within the ongoing uptrend.
Don’t forget to like and share your thoughts in the comments! ❤️

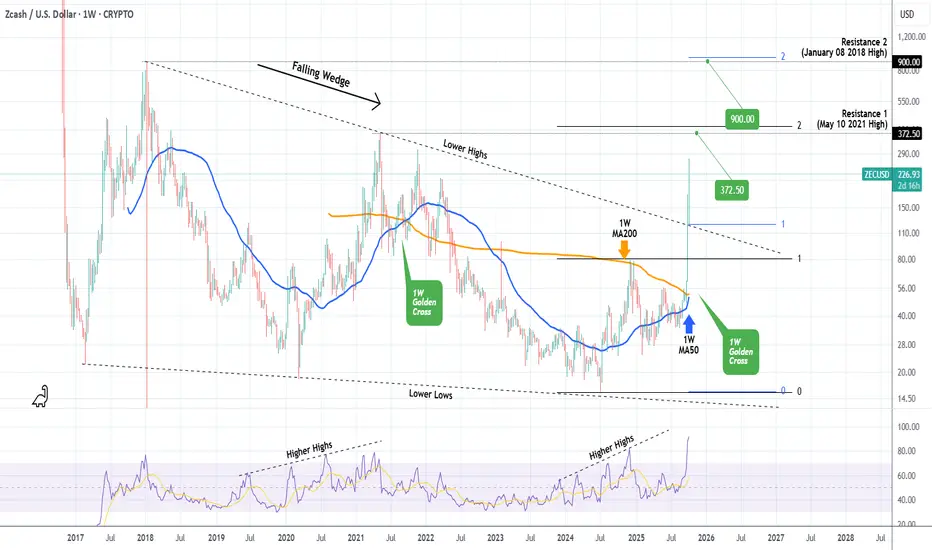
ZCASH Eyes $372.50 but might surprise us with an even higher TopZcash (ZECUSD) has been essentially trading within a multi-year Falling Wedge since the February 20 2017 Low, which effectively broke last week. This week continued equally impressively with the price currently at $239, having increased by almost +1000% since the February 2025 Low.
This Falling Wedge bullish break-out it technically targeting the 2.0 Fibonacci extension from the December 02 202 High. This falls marginally above the $372.50 Resistance (1), which is the May 10 2021 High of the previous Cycle. We expect this to get hit soon and most likely price the Top of the current Bull Cycle.
However, there is an optimistic scenario, which may push the Cycle Top to Resistance 2 (January 08 2018 High, the top of the first Cycle) at $900, which is the 2.0 Fibonacci extension (blue levels) from the Falling Wedge's break-out point. But that is assuming ZEC closes a full 1W candle above Resistance 1.
-------------------------------------------------------------------------------
** Please LIKE 👍, FOLLOW ✅, SHARE 🙌 and COMMENT ✍ if you enjoy this idea! Also share your ideas and charts in the comments section below! This is best way to keep it relevant, support us, keep the content here free and allow the idea to reach as many people as possible. **
-------------------------------------------------------------------------------
💸💸💸💸💸💸
👇 👇 👇 👇 👇 👇
TradeCityPro | ATOMUSDT Ready for a Sharp Drop!👋 Welcome to TradeCityPro Channel!
Let’s analyze ATOM (Cosmos) — one of the older and more established coins in the market. Personally, I’ve been holding and staking this one for quite a while.
🌐 Overview of Bitcoin
Before we begin, let me remind you that we’ve moved the Bitcoin analysis section to a separate daily report at your request, so we can go into more detail about Bitcoin’s condition, price action, and dominance:
📊 Higher Time Frames
On the higher time frames, ATOM has been ranging for a long period of time and interestingly, it has even formed a smaller range inside its main range.
Currently, it’s oscillating near the bottom support of that larger range, showing weakness.
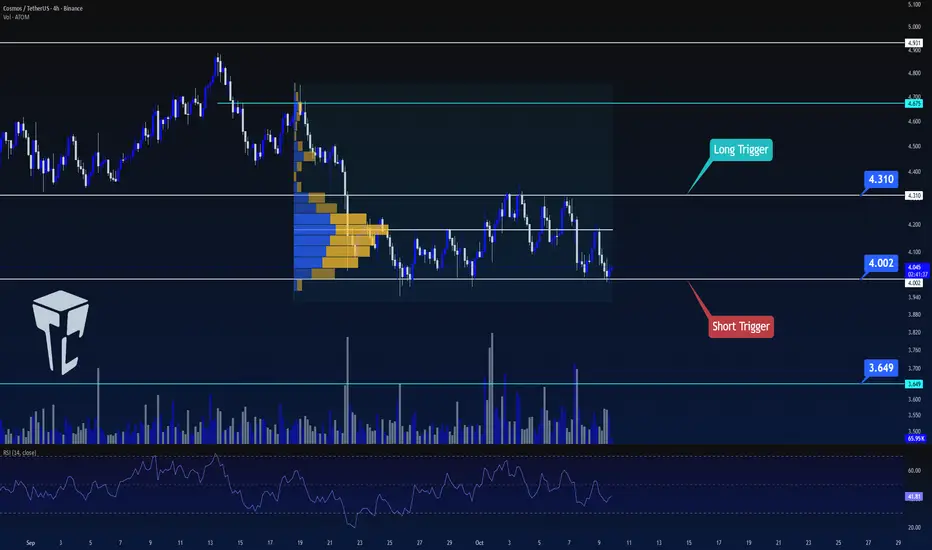
🕓 4H Time Frame
In the 4-hour chart, the price remains stuck inside a range between $4.002 and $4.310.
However, this time it has been rejected from the midline, which increases the likelihood of losing the lower support.
📉 Short Position Setup
If the price breaks below $4.002 with increasing volume and momentum, opening a short position would be completely logical and I’ll personally be taking that short setup as well.
📈 Long Position Setup
For a long position, patience is key.
Other coins like MNT, HYPE, and AVAX currently show stronger bullish potential, but if ATOM breaks above $4.310 and starts forming higher highs and higher lows, we can then begin to shift our bias to bullish.
📝 Final Thoughts
Stay calm, trade wisely, and let's capture the market's best opportunities!
This analysis reflects our opinions and is not financial advice.
Share your thoughts in the comments, and don’t forget to share this analysis with your friends! ❤️
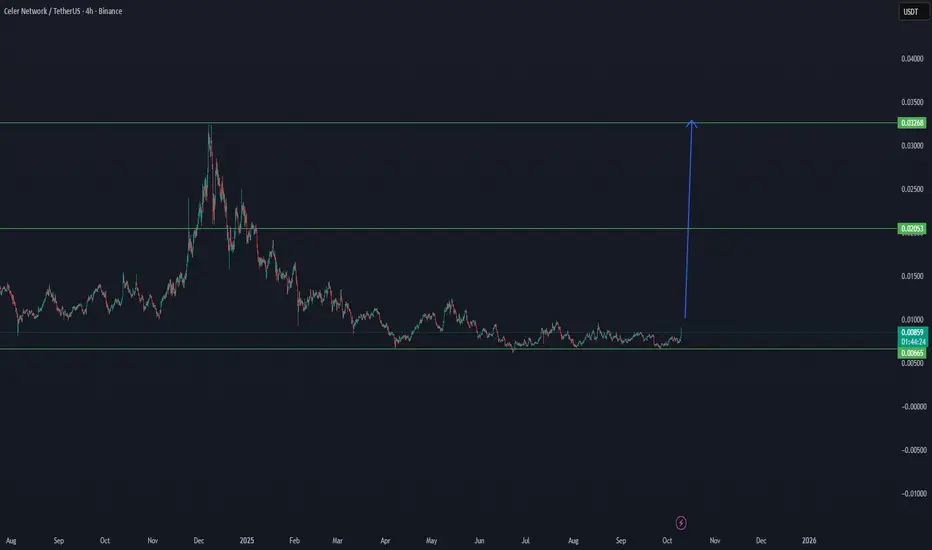
CELR NEW CYCLE ON WAYCELER NETWORK (CELR/USDT) — Cycle Bottom Formed, Reversal Phase Loading 🔄
CELR is showing clear signs of accumulation near the cycle bottom zone between $0.0066 – $0.0088, a range historically known for reversals and strong recovery moves.
📉 Accumulation Base: $0.0066 – $0.0088
🟢 Current Structure: CELR is stabilizing after prolonged downtrend pressure, building strength in a low volatility range — often a signal before a new expansion phase.
📈 Next Major Targets:
First resistance zone: $0.0205
Main cycle target: $0.0326
A breakout confirmation above $0.0100 would likely activate a new bullish cycle, potentially mirroring previous macro moves from similar levels.
Summary:
CELR/USDT is trading in its historical low region, suggesting a high-reward accumulation zone. As momentum returns to mid-cap alts, CELR could be among those leading the next cycle push.
🎯 Targets: $0.0205 → $0.0326
📊 Bias: Bullish Accumulation Phase
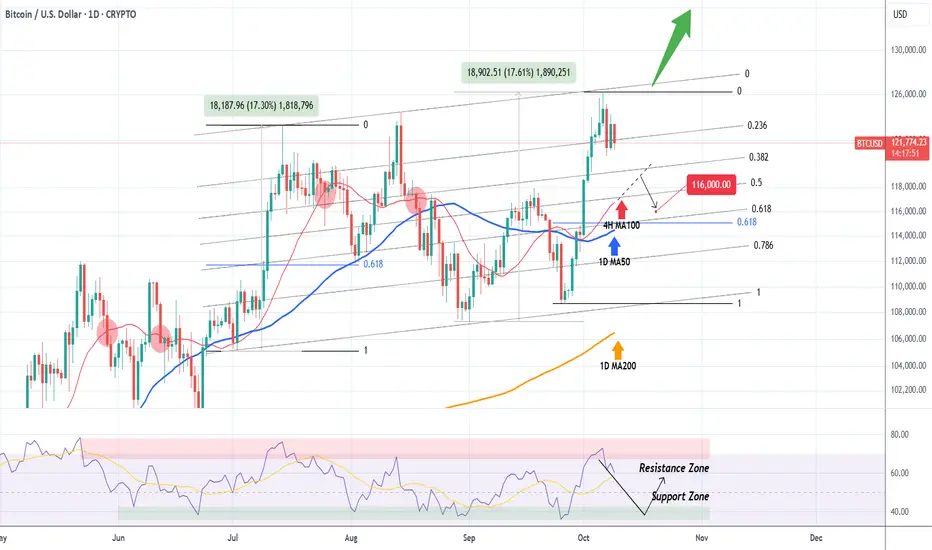
BITCOIN How low can it pull back??Bitcoin (BTCUSD) got rejected on the Higher Highs trend-line we mentioned on our last analysis and is already pulling back. The question is how far can it drop?
Today we expand on that analysis by applying the Fibonacci Channel on the Higher Highs trend-line. Instantly we can see that the Channel Up has two almost perfectly symmetrical Bullish Legs (+17.30% and +17.61% respectively).
The key on this pattern is the 4H MA100 (red trend-line). Every time BTC broke below it since May 29, the decline extended all the way to at least the 1D MA50 (blue trend-line).
Since the 1D RSI also got rejected on its Resistance Zone, we expect a pull-back towards its Support Zone and if the 4H MA100 breaks, further extension towards the 1D MA50. We estimate a potential target to be $116000, which is marginally above the 0.618 Fibonacci retracement level, where the August 02 bounce took place. Needless to say, a break (and 1D candle close) above the Channel's top (Higher Highs trend-line), invalidates any pull-back scenario and, as mentioned previously, constitutes a bullish break-out to a new pattern/ rally.
What do you think will happen next? Feel free to let us know in the comments section below!
-------------------------------------------------------------------------------
** Please LIKE 👍, FOLLOW ✅, SHARE 🙌 and COMMENT ✍ if you enjoy this idea! Also share your ideas and charts in the comments section below! This is best way to keep it relevant, support us, keep the content here free and allow the idea to reach as many people as possible. **
-------------------------------------------------------------------------------
💸💸💸💸💸💸
👇 👇 👇 👇 👇 👇
118.60-119.50K for BTC BounceMorning folks,
So, the final leg up has happened that we discussed last time, but it was not as strong as we've expected. It means that all time high target around 127K is not done yet.
Meantime, BTC is taking the breath. Since upside momentum looks nice, we consider first support area around 118.6K - 119.50K as potential for long trade. Especially if we get this butterfly pattern.

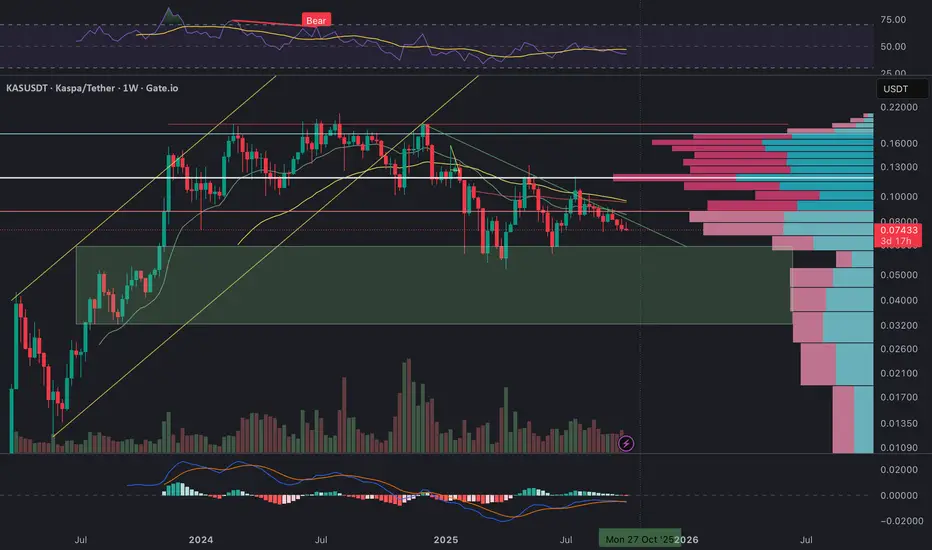
𐤊 $KAS KASPA Weekly Outlook: Testing the Final Line of DefenseKaspa has been consolidating for several months, drifting steadily lower within a well-defined descending channel after breaking down from the 2024 uptrend. Price is now hovering around a crucial support zone between 0.073 and 0.070 USDT, which also coincides with the lower boundary of the major demand region (highlighted in green).
From a structural point of view, KAS remains in a macro corrective phase. Momentum indicators are showing signs of exhaustion on the downside – the RSI is hovering near the 40 level and flattening out, while MACD has started to compress with a potential bullish crossover forming if buyers step in this week.
The Volume Profile clearly shows heavy supply between 0.10 – 0.12 USDT, marking this zone as the key resistance cluster that must be reclaimed to confirm any trend reversal. Until then, rallies into 0.081 – 0.085 are likely to face selling pressure.
Technically, this area around 0.074 USDT represents the “final line of defense” before a deeper retest toward 0.06 – 0.055 (the next historical demand pocket). However, if bulls manage to defend this support and push price back above the descending trendline and the 0.0815 zone, a medium-term reversal toward 0.095 – 0.10 could develop.
In short:
• Trend: Still bearish but approaching exhaustion
• Key Support: 0.073 – 0.070
• Immediate Resistance: 0.0815, then 0.090 – 0.095
• Macro Target (if breakout): 0.10 – 0.12
• Breakdown Target: 0.060 – 0.055
Volume and structure suggest we are near a make-or-break zone. A weekly close below 0.073 would confirm continuation of the downtrend, while a rebound above 0.081 could be the first real signal of accumulation before the next bullish leg.
TradeCityPro | LTCUSDT The Best Trade Setup of the Week!👋 Welcome to TradeCityPro Channel!
Let’s move on to the analysis of the market veteran — Litecoin (LTC) — one of the oldest coins in the crypto market, which right now looks like it could offer a great trading opportunity.
🌐 Overview of Bitcoin
Before starting the analysis, let me remind you that we’ve moved the Bitcoin analysis section to a separate daily report based on your requests, so we can go into more detail about Bitcoin’s condition, price action, and dominance:
🕓 4H Time Frame
After forming higher lows inside the $101.87–$107.14 accumulation box, Litecoin finally broke through resistance and experienced a sharp upward move.
Then, after reaching the $122.74 resistance, the price got rejected and is currently testing the $115.67 support where it might consolidate for a while.
🚀 Long Position Setup:
If the price breaks the $122.74 trigger, we can easily open a long position.
In general, as long as the price stays above $115.67, long positions remain valid.
🔻 Short Position Setup:
For a short position, we first need to see a lower high form within the current range and some signs of seller pressure.
Only then, with a confirmed breakdown below $115.67, could we consider opening a risky short position.
📝 Final Thoughts
Stay calm, trade wisely, and let's capture the market's best opportunities!
This analysis reflects our opinions and is not financial advice.
Share your thoughts in the comments, and don’t forget to share this analysis with your friends! ❤️
