Potential bearish drop off?Ethereum (ETH/USD) has rejected off the pivot, which is an overlap resistance and could drop to the 1st support.
Pivot: 4,263.96
1st Support: 3,938.73
1st Resistance: 4,455.38
Disclaimer:
The above opinions given constitute general market commentary, and do not constitute the opinion or advice of IC Markets or any form of personal or investment advice.
Any opinions, news, research, analyses, prices, other information, or links to third-party sites contained on this website are provided on an "as-is" basis, are intended only to be informative, is not an advice nor a recommendation, nor research, or a record of our trading prices, or an offer of, or solicitation for a transaction in any financial instrument and thus should not be treated as such. The information provided does not involve any specific investment objectives, financial situation and needs of any specific person who may receive it. Please be aware, that past performance is not a reliable indicator of future performance and/or results. Past Performance or Forward-looking scenarios based upon the reasonable beliefs of the third-party provider are not a guarantee of future performance. Actual results may differ materially from those anticipated in forward-looking or past performance statements. IC Markets makes no representation or warranty and assumes no liability as to the accuracy or completeness of the information provided, nor any loss arising from any investment based on a recommendation, forecast or any information supplied by any third-party.
Cryptocurrencysignals

Bearish reversal off major resistance?The Bitcoin (BTC/USD) has rejected off the pivot and could drop to the 1st support, which is a pullback support.
Pivot: 109,139.03
1st Support: 109,172.55
1st Resistance: 119,893.62
Disclaimer:
The above opinions given constitute general market commentary, and do not constitute the opinion or advice of IC Markets or any form of personal or investment advice.
Any opinions, news, research, analyses, prices, other information, or links to third-party sites contained on this website are provided on an "as-is" basis, are intended only to be informative, is not an advice nor a recommendation, nor research, or a record of our trading prices, or an offer of, or solicitation for a transaction in any financial instrument and thus should not be treated as such. The information provided does not involve any specific investment objectives, financial situation and needs of any specific person who may receive it. Please be aware, that past performance is not a reliable indicator of future performance and/or results. Past Performance or Forward-looking scenarios based upon the reasonable beliefs of the third-party provider are not a guarantee of future performance. Actual results may differ materially from those anticipated in forward-looking or past performance statements. IC Markets makes no representation or warranty and assumes no liability as to the accuracy or completeness of the information provided, nor any loss arising from any investment based on a recommendation, forecast or any information supplied by any third-party.

BITCOIN This is what separates 128k from 104k.Bitcoin (BTCUSD) just broke above its 1D MA50 (blue trend-line) for the first time in 2 weeks and only days after it got rejected there. A 1D candle closing above it will be a strong bullish signal.
As BTC has been trading within a Megaphone pattern similar to the December 2024 - April 2025 one, a closing above the 1D MA50 might put the structure in a similar situation as April 17. As you can see that Megaphone also had a 1D MA50 rejection preceding the break-out and before that also, two Lower Lows near the 1W MA0 (red trend-line).
What it hasn't had (so far?) is a clear touch of the 1W MA50 (as on April 07) and a 1D MACD Higher Lows Bullish Divergence.
As a result, both scenarios are open for now. Until it closes above the 1D MA50, a 1W MA50 test remains possible around $104000. A closing above the 1D MA50 though strengthens the probability of a 1.1 Fibonacci extension rally at $128000.
What do you think is more likely to happen? Feel free to let us know in the comments section below!
-------------------------------------------------------------------------------
** Please LIKE 👍, FOLLOW ✅, SHARE 🙌 and COMMENT ✍ if you enjoy this idea! Also share your ideas and charts in the comments section below! This is best way to keep it relevant, support us, keep the content here free and allow the idea to reach as many people as possible. **
-------------------------------------------------------------------------------
💸💸💸💸💸💸
👇 👇 👇 👇 👇 👇

DOTUSD | Bearish Rejection at Overlap ResistanceDOT/USD is rising towards the sell entry, which is an overlap resistance and could reverse from this level to the downside.
Sell entry is at 3.065, which is an overlap resistance.
Stop loss is at 3.277, which is a swing high resistance that aligns with the 161.8% Fibonacci extension.
Take profit is at 2.806, which is an overlap support.
Stratos Markets Limited (tradu.com ):
CFDs are complex instruments and come with a high risk of losing money rapidly due to leverage. 68% of retail investor accounts lose money when trading CFDs with this provider. You should consider whether you understand how CFDs work and whether you can afford to take the high risk of losing your money.
Stratos Europe Ltd (tradu.com ):
CFDs are complex instruments and come with a high risk of losing money rapidly due to leverage. 70% of retail investor accounts lose money when trading CFDs with this provider. You should consider whether you understand how CFDs work and whether you can afford to take the high risk of losing your money.

SOLUSD | Approaching Major Resistance LevelSOL/USD is rising towards the sell entry, which is an overlap resistance and could reverse from this level to the downside.
Sell entry is at 198.22, which is an overlap resistance.
Stop loss is at 206.24, which is a swing high resistance that aligns with the 138.2% Fibonacci extension.
Take profit is at 187.02, which is an overlap support.
Stratos Markets Limited (tradu.com ):
CFDs are complex instruments and come with a high risk of losing money rapidly due to leverage. 68% of retail investor accounts lose money when trading CFDs with this provider. You should consider whether you understand how CFDs work and whether you can afford to take the high risk of losing your money.
Stratos Europe Ltd (thttps://tradu.com/eu ):
CFDs are complex instruments and come with a high risk of losing money rapidly due to leverage. 70% of retail investor accounts lose money when trading CFDs with this provider. You should consider whether you understand how CFDs work and whether you can afford to take the high risk of losing your money.

DOGEUSD | Bullish Bounce Off SupportThe price has bounced off the buy entry, which is a pullback support, and oculd rise from this level to he take profit.
Buy entry is at 0.19401, which is a pullback support.
Stop loss is at 0.18966, which is a pullback support.
Take profit is at 0.20603, which is an overlap resistance.
Stratos Markets Limited (tradu.com ):
CFDs are complex instruments and come with a high risk of losing money rapidly due to leverage. 68% of retail investor accounts lose money when trading CFDs with this provider. You should consider whether you understand how CFDs work and whether you can afford to take the high risk of losing your money.
Stratos Europe Ltd (tradu.com ):
CFDs are complex instruments and come with a high risk of losing money rapidly due to leverage. 70% of retail investor accounts lose money when trading CFDs with this provider. You should consider whether you understand how CFDs work and whether you can afford to take the high risk of losing your money.

EOS/USD | Bullish Momentum Building After BounceEOS/USD has bounced off the buy entry and could rise from this level to the upside.
Buy entry is at 0.2748, which is a pullback support.
Stop loss is at 0.2703, which is a pullbakc support.
Take profit is at 0.2908, which is an overlap resistance that is slightly below thhe 61.8% Fibonacci retracement.
Stratos Markets Limited (tradu.com ):
CFDs are complex instruments and come with a high risk of losing money rapidly due to leverage. 68% of retail investor accounts lose money when trading CFDs with this provider. You should consider whether you understand how CFDs work and whether you can afford to take the high risk of losing your money.
Stratos Europe Ltd (tradu.com ):
CFDs are complex instruments and come with a high risk of losing money rapidly due to leverage. 70% of retail investor accounts lose money when trading CFDs with this provider. You should consider whether you understand how CFDs work and whether you can afford to take the high risk of losing your money.

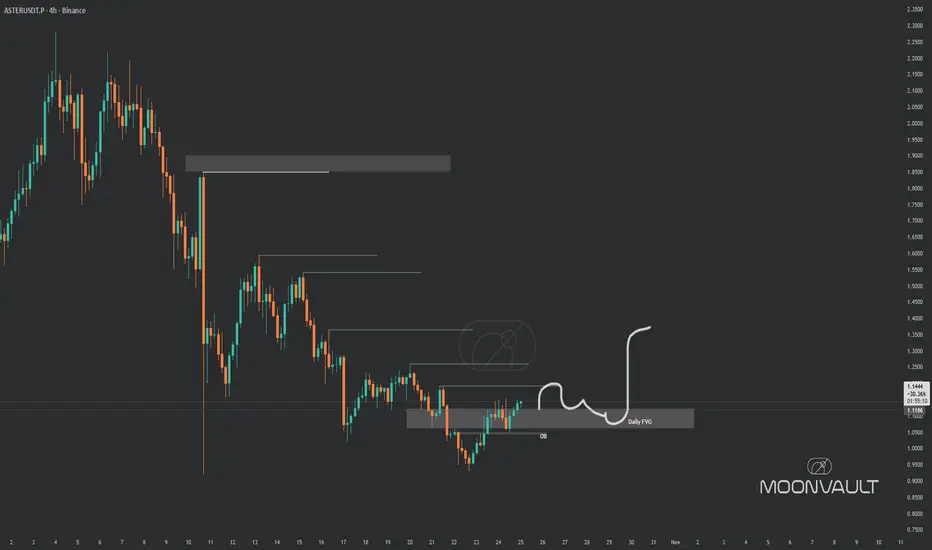
$ASTER put it on your watchlistSEED_WANDERIN_JIMZIP900:ASTER fans be aware of Aster move: break structure by reclaim daily FVG and staying above until CRYPTOCAP:BTC don't ruin party... this one looks good here, it's aster
time again.
FETUSD Will it continue on its historic bullish pattern?Artificial Superintelligence Alliance (FETUSD) has been trading within a 6.5-year Channel Up ever since its first trading day. The pattern's Bullish and Bearish Legs are very distinct and since its March 25 2024 All Time High (ATH), the market has been on the latest Bearish Leg (red Channel).
The 1W RSI just touched its 30.00 oversold barrier and last time it did so on a Bearish Leg (June 13 2022), the bottoming process (Higher Low) started towards the 0.236 Fibonacci level of the multi-year Channel Up.
As a result, FET may start its new Bullish Leg, as long as the overall market remains on a Bull Cycle. The short-term Target is the 1W MA50 (blue trend-line), with which contact can be made around $0.62000. Long-term (again if the Bull Cycle extends) we could see another +6430% Bullish Leg to $8.000.
-------------------------------------------------------------------------------
** Please LIKE 👍, FOLLOW ✅, SHARE 🙌 and COMMENT ✍ if you enjoy this idea! Also share your ideas and charts in the comments section below! This is best way to keep it relevant, support us, keep the content here free and allow the idea to reach as many people as possible. **
-------------------------------------------------------------------------------
💸💸💸💸💸💸
👇 👇 👇 👇 👇 👇

Potential bearish drop off?Ethereum (ETH/USD) has rejected off the pivot and could drop to the multi swing low support.
Pivot: 3,934.93
1st Support: 3,691.52
1st Resistance: 4,093.31
Disclaimer:
The above opinions given constitute general market commentary, and do not constitute the opinion or advice of IC Markets or any form of personal or investment advice.
Any opinions, news, research, analyses, prices, other information, or links to third-party sites contained on this website are provided on an "as-is" basis, are intended only to be informative, is not an advice nor a recommendation, nor research, or a record of our trading prices, or an offer of, or solicitation for a transaction in any financial instrument and thus should not be treated as such. The information provided does not involve any specific investment objectives, financial situation and needs of any specific person who may receive it. Please be aware, that past performance is not a reliable indicator of future performance and/or results. Past Performance or Forward-looking scenarios based upon the reasonable beliefs of the third-party provider are not a guarantee of future performance. Actual results may differ materially from those anticipated in forward-looking or past performance statements. IC Markets makes no representation or warranty and assumes no liability as to the accuracy or completeness of the information provided, nor any loss arising from any investment based on a recommendation, forecast or any information supplied by any third-party.

BITCOIN and the 'myth' behind following the Global SupplyA lot of talk is being thrown around lately regarding the M2 Global Supply (black trend-line) and how Bitcoin (BTCUSD) will follow it upwards as it explodes. Those claims have intensified especially in the past 2 weeks as an argument to support BTC's recovery following the decline from its $126k Top.
However, history shows that the two don't have to be correlated. In fact, during the past two Cycles, BTC topped at least 105 days (15 weeks) before the Global M2 did. Especially during the previous Cycle (2021), BTC has broken well below its 1W MA50 (blue trend-line) and stayed under up until the M2 peaked also. Note that the 1W MA50 is what has (so far) supported BTC's current correction.
As a result, no hopes of recovery can be rest upon a currently rising Global Liquidity. And if BTC's Cycle Top was 2 weeks ago, the Global Liquidity might peak 15 weeks from that, around January 19 2026 (possibly around the time the stock market peaks too).
But what do you think? Do you think Bitcoin will catch up to the rising M2 Global Supply or will continue its decline into a new Bear Cycle as it has historically happened? Feel free to let us know in the comments section below!
-------------------------------------------------------------------------------
** Please LIKE 👍, FOLLOW ✅, SHARE 🙌 and COMMENT ✍ if you enjoy this idea! Also share your ideas and charts in the comments section below! This is best way to keep it relevant, support us, keep the content here free and allow the idea to reach as many people as possible. **
-------------------------------------------------------------------------------
💸💸💸💸💸💸
👇 👇 👇 👇 👇 👇

DOGE Can it give one more rally?Dogecoin (DOGEUSD) has been trading within a Channel Up pattern since March 02 that only broke momentarily to the downside during the October 10 2025 flash crash. Immediately the price recovered and has since been consolidating on the 1W MA100 (red trend-line).
The 1W MA100 has price both previous Higher Lows bottoms of the pattern, with both Bearish Legs incredibly declining by the same extent -45.90%. This amazing degree of symmetry is also seen on the pattern's Bullish Legs, with both also registering identical rises of +101.96%, pricing their Higher Highs on their respective 1.136 Fibonacci extensions.
As a result, as long as DOGE keeps closing its 1W candles above the 1W MA100, we have strong reasons to expect another +101.96% Bullish Leg targeting 0.33000 (also the 1.136 Fibonacci extension).
It is also worth noting that the 1D RSI has been on a Higher Lows Bullish Divergence (against the price's Lower Lows), similar to the first bottom of the Channel Up in early April.
-------------------------------------------------------------------------------
** Please LIKE 👍, FOLLOW ✅, SHARE 🙌 and COMMENT ✍ if you enjoy this idea! Also share your ideas and charts in the comments section below! This is best way to keep it relevant, support us, keep the content here free and allow the idea to reach as many people as possible. **
-------------------------------------------------------------------------------
💸💸💸💸💸💸
👇 👇 👇 👇 👇 👇

BTCUSD H1 | Price Approaching 61.8% Fibonacci ResistanceBased on the H1 chart analysis, we could see the price rise to the sell entry which is a pullback resistance that aligns with the 61.8% Fibonacci retracement and could reverse from this level to the downside.
Sell entry is at 111,337.31, which is a pullback resistance that aligns with the 61.8% Fibonacci retracement.
Stop loss is at 113,598.16, which is a pullback resistance.
Take profit is at 104,475.94, which is a swing low support.
Stratos Markets Limited (tradu.com ):
CFDs are complex instruments and come with a high risk of losing money rapidly due to leverage. 68% of retail investor accounts lose money when trading CFDs with this provider. You should consider whether you understand how CFDs work and whether you can afford to take the high risk of losing your money.
Stratos Europe Ltd (tradu.com ):
CFDs are complex instruments and come with a high risk of losing money rapidly due to leverage. 70% of retail investor accounts lose money when trading CFDs with this provider. You should consider whether you understand how CFDs work and whether you can afford to take the high risk of losing your money.

ETHUSD H1 | Possible Bearish Turn Ahead”ETH/USD is rising towards the sell entry, which is a pullback resistance that is slightly above the 50% Fibonacci retracement and could reverse from this levle to the downside.
Sell entry is at 3,936.30, which is a pullback resistance that is slightly above the 50% Fibonacci retracement.
Stop loss is at 4,079.07, which is a pullback resistance.
Take profit is at 3,703.89, which is a multi-swing low support.
Stratos Markets Limited (tradu.com ):
CFDs are complex instruments and come with a high risk of losing money rapidly due to leverage. 68% of retail investor accounts lose money when trading CFDs with this provider. You should consider whether you understand how CFDs work and whether you can afford to take the high risk of losing your money.
Stratos Europe Ltd (tradu.com ):
CFDs are complex instruments and come with a high risk of losing money rapidly due to leverage. 70% of retail investor accounts lose money when trading CFDs with this provider. You should consider whether you understand how CFDs work and whether you can afford to take the high risk of losing your money.

SOLUSD H1 | Bearish Reversal from Pullback ResistanceSOL/USD is rising towards the sell entry which is a pullback resistance that aligns with the 61.8% Fibonacci retracement and could reverse from this level to the downside.
Sell entry is at 190.50, which is a pullback resistance that aligns with the 61.8% Fibonacci retracement.
Stop loss is at 198.02, which is an overlap resistance.
Take profit is at 175.45, which is a swing low support.
Stratos Markets Limited (tradu.com ):
CFDs are complex instruments and come with a high risk of losing money rapidly due to leverage. 68% of retail investor accounts lose money when trading CFDs with this provider. You should consider whether you understand how CFDs work and whether you can afford to take the high risk of losing your money.
Stratos Europe Ltd (tradu.com ):
CFDs are complex instruments and come with a high risk of losing money rapidly due to leverage. 70% of retail investor accounts lose money when trading CFDs with this provider. You should consider whether you understand how CFDs work and whether you can afford to take the high risk of losing your money.

DOGEUSD H1 | Bullish Momentum BuildingThe price could fall towards the buy entry, which is a pullback support and could rise from this level to the upside.
Buy entry is at 0.1903, which is a pullbakc support.
Stop loss is at 0.2064, which is an overlap resistance.
Take profit is at 0.2178, which is a swing high resistance.
Stratos Markets Limited (tradu.com ):
CFDs are complex instruments and come with a high risk of losing money rapidly due to leverage. 68% of retail investor accounts lose money when trading CFDs with this provider. You should consider whether you understand how CFDs work and whether you can afford to take the high risk of losing your money.
Stratos Europe Ltd (tradu.com ):
CFDs are complex instruments and come with a high risk of losing money rapidly due to leverage. 70% of retail investor accounts lose money when trading CFDs with this provider. You should consider whether you understand how CFDs work and whether you can afford to take the high risk of losing your money.

BNBUSD H1 | Signs of a Bullish ReversalBNB/USD could fall towards the buy entry, which is a pullbakc support and could bounce from this level to the upside.
Buy entry is at 1,082.13, which is a pullback support.
Stop loss is at 1,035.10, which is a swing low support.
Take profit is at 1,148.71, which is an overlap resistance.
Stratos Markets Limited (tradu.com ):
CFDs are complex instruments and come with a high risk of losing money rapidly due to leverage. 68% of retail investor accounts lose money when trading CFDs with this provider. You should consider whether you understand how CFDs work and whether you can afford to take the high risk of losing your money.
Stratos Europe Ltd (tradu.com ):
CFDs are complex instruments and come with a high risk of losing money rapidly due to leverage. 70% of retail investor accounts lose money when trading CFDs with this provider. You should consider whether you understand how CFDs work and whether you can afford to take the high risk of losing your money.

BCHUSD M30 | Potential Upside MoveBCHUSD has reacted off the buy entry, which is a pullback support and could rise from this levle to the upside.
Buy entry is at 475.84, whichis a pullback support.
Stop loss is at 463.77, which is a multi-swing low support.
Take profit is at 500.15, which is a pullback resistance.
Stratos Markets Limited (tradu.com/uk ):
CFDs are complex instruments and come with a high risk of losing money rapidly due to leverage. 68% of retail investor accounts lose money when trading CFDs with this provider. You should consider whether you understand how CFDs work and whether you can afford to take the high risk of losing your money.
Stratos Europe Ltd (tradu.com/eu ):
CFDs are complex instruments and come with a high risk of losing money rapidly due to leverage. 70% of retail investor accounts lose money when trading CFDs with this provider. You should consider whether you understand how CFDs work and whether you can afford to take the high risk of losing your money.

Bearish reversal for Bitcoin?The price is rising towards the pivot and could reverse to the pullback support.
Pivot: 108,846.88
1st Suport: 104,701.40
1st Resistance: 113,431.55
Disclaimer:
The above opinions given constitute general market commentary, and do not constitute the opinion or advice of IC Markets or any form of personal or investment advice.
Any opinions, news, research, analyses, prices, other information, or links to third-party sites contained on this website are provided on an "as-is" basis, are intended only to be informative, is not an advice nor a recommendation, nor research, or a record of our trading prices, or an offer of, or solicitation for a transaction in any financial instrument and thus should not be treated as such. The information provided does not involve any specific investment objectives, financial situation and needs of any specific person who may receive it. Please be aware, that past performance is not a reliable indicator of future performance and/or results. Past Performance or Forward-looking scenarios based upon the reasonable beliefs of the third-party provider are not a guarantee of future performance. Actual results may differ materially from those anticipated in forward-looking or past performance statements. IC Markets makes no representation or warranty and assumes no liability as to the accuracy or completeness of the information provided, nor any loss arising from any investment based on a recommendation, forecast or any information supplied by any third-party.

AIAUSDT RINSE OUTEyeing AIA after a 150% move to the upside. Keep an eye on a breakout of those ranges. Potential to send it up once more. Manage Risk Appropriately.

BITCOIN The NIGHTMARE chart you don't want to see right nowBitcoin (BTCUSD) is on the verge of establishing an LMACD Bearish Cross on the 1M time-frame, which for better reliability needs to close the current 1M candle (October) to confirm it.
** The nightmare LMACD Bearish Cross **
As the title says, this is a 'nightmare' development for the market, certainly not something that the majority of investors want to see right now, as this Bearish Cross has had disastrous effects every time it took place at the end of the 4-year Cycle.
First of all, let's not allow being overlooked the fact that the 1M LMACD is also reversing right before a test of its multi-year Lower Highs trend-line. That line priced all previous Cycle Tops.
** Is this a Cycle Top? Best-worst case scenarios**
Back to he Bearish Cross, it has always been formed around Cycle Tops as well. More specifically, the one that was formed after January 2014, was already on the 3rd month after the Cycle Top. The one that was formed after February 2018, was on the 4th month of the Bear Cycle. More recently, the one that was formed on August 2021 was 3 months before the Cycle Top. Interestingly enough, that was a peculiar Cycle with an (almost) Double Top, which was no surprise that the LMACD got rejected on its Lower Highs trend-line much earlier on the April 2021 Top.
As a result, the best case scenario based on this model for BTC is to have another 3 months of Bull, especially if it gets aided by favorable news (Trade deal, rate cuts, adoption). The more likely however historically, especially if October closes in red in 10 days, is that Bitcoin has entered a new Bear Cycle and this MACD Bearish Cross comes to confirm it.
** How low can it go?? **
What's even worse is that, if we've already seen the Top, the market tends to decline on average by more than -80% historically, with the last Bear Cycle suffering losses of almost -78% (the softest Cycle of all). It was also the only one that closed a month (numerous 1M candles actually) below the 1M MA50 (blue trend-line) unlike the first two, which used that as a Support/ Cycle Bottom. As a result, the best case scenario if a new Bear Cycle has already started is to place a bottom on its 1M MA50 around $60000 - 65000 and the worst to decline by -78% around $30000 (or a little worse).
Again, not the kind of technical analysis most want to be seeing right now..
** The positive look **
For conclusion, we should always keep in mind that the fundamental scenery/ environment changes with every Cycle in a more favorable way, e.g this Cycle we had much stronger institutional adoption, even national treasuries and more importantly we saw the introduction of the Bitcoin ETF by Blackrock which was a game changer in capital inflows. You don't see often such investment bank giants 'allowing' one of their products to tank by -80%.
But what do you think? Are we already in a Bear Cycle or there are some more months left in the Bull's tank? Feel free to let us know in the comments section below!
-------------------------------------------------------------------------------
** Please LIKE 👍, FOLLOW ✅, SHARE 🙌 and COMMENT ✍ if you enjoy this idea! Also share your ideas and charts in the comments section below! This is best way to keep it relevant, support us, keep the content here free and allow the idea to reach as many people as possible. **
-------------------------------------------------------------------------------
💸💸💸💸💸💸
👇 👇 👇 👇 👇 👇

SOLUSD H4 | Price Faces Bearish Drop-OffSOL/USD has rejected off the sell entry which is a pullback resistance that lines up with the 23.6% Fibonacci retracement and could drop from this level to the take profit.
Sell entry is at 191.97, which is a pullback resistance that lines up with he 23.6% Fibonacci retracement.
Stop loss is at 206.14, which is a pullback resistance that aligns with he 50% Fibonacci retracement.
Take profit is at 175.03, which is a multi swing low support.
High Risk Investment Warning
Trading Forex/CFDs on margin carries a high level of risk and may not be suitable for all investors. Leverage can work against you.
Stratos Markets Limited (tradu.com ):
CFDs are complex instruments and come with a high risk of losing money rapidly due to leverage. 65% of retail investor accounts lose money when trading CFDs with this provider. You should consider whether you understand how CFDs work and whether you can afford to take the high risk of losing your money.
Stratos Europe Ltd (tradu.com ):
CFDs are complex instruments and come with a high risk of losing money rapidly due to leverage. 66% of retail investor accounts lose money when trading CFDs with this provider. You should consider whether you understand how CFDs work and whether you can afford to take the high risk of losing your money.
Stratos Global LLC (tradu.com ):
Losses can exceed deposits.
Please be advised that the information presented on TradingView is provided to Tradu (‘Company’, ‘we’) by a third-party provider (‘TFA Global Pte Ltd’). Please be reminded that you are solely responsible for the trading decisions on your account. There is a very high degree of risk involved in trading. Any information and/or content is intended entirely for research, educational and informational purposes only and does not constitute investment or consultation advice or investment strategy. The information is not tailored to the investment needs of any specific person and therefore does not involve a consideration of any of the investment objectives, financial situation or needs of any viewer that may receive it. Kindly also note that past performance is not a reliable indicator of future results. Actual results may differ materially from those anticipated in forward-looking or past performance statements. We assume no liability as to the accuracy or completeness of any of the information and/or content provided herein and the Company cannot be held responsible for any omission, mistake nor for any loss or damage including without limitation to any loss of profit which may arise from reliance on any information supplied by TFA Global Pte Ltd.
The speaker(s) is neither an employee, agent nor representative of Tradu and is therefore acting independently. The opinions given are their own, constitute general market commentary, and do not constitute the opinion or advice of Tradu or any form of personal or investment advice. Tradu neither endorses nor guarantees offerings of third-party speakers, nor is Tradu responsible for the content, veracity or opinions of third-party speakers, presenters or participants.

DOGEUSD H4 | Bearish ReversalBased on the H4 chart analysis, we ccould se the price rise to the sel entry whichis an overlap resistance that is sligjhtly below the 38.2% FIbonacci retracement and could reverse from this level to the take profit.
Sell entry is at 0.20657, whichis an overlap resistance that is slightly below the 38.2% FIbonacci retracement.
Stop loss is at 0.21917, whichis a pullback resistance that lines up with the 50% Fibonacci retracement.
Take profit is at 0.17601, which is a swing low support.
High Risk Investment Warning
Trading Forex/CFDs on margin carries a high level of risk and may not be suitable for all investors. Leverage can work against you.
Stratos Markets Limited (tradu.com ):
CFDs are complex instruments and come with a high risk of losing money rapidly due to leverage. 65% of retail investor accounts lose money when trading CFDs with this provider. You should consider whether you understand how CFDs work and whether you can afford to take the high risk of losing your money.
Stratos Europe Ltd (tradu.com ):
CFDs are complex instruments and come with a high risk of losing money rapidly due to leverage. 66% of retail investor accounts lose money when trading CFDs with this provider. You should consider whether you understand how CFDs work and whether you can afford to take the high risk of losing your money.
Stratos Global LLC (tradu.com ):
Losses can exceed deposits.
Please be advised that the information presented on TradingView is provided to Tradu (‘Company’, ‘we’) by a third-party provider (‘TFA Global Pte Ltd’). Please be reminded that you are solely responsible for the trading decisions on your account. There is a very high degree of risk involved in trading. Any information and/or content is intended entirely for research, educational and informational purposes only and does not constitute investment or consultation advice or investment strategy. The information is not tailored to the investment needs of any specific person and therefore does not involve a consideration of any of the investment objectives, financial situation or needs of any viewer that may receive it. Kindly also note that past performance is not a reliable indicator of future results. Actual results may differ materially from those anticipated in forward-looking or past performance statements. We assume no liability as to the accuracy or completeness of any of the information and/or content provided herein and the Company cannot be held responsible for any omission, mistake nor for any loss or damage including without limitation to any loss of profit which may arise from reliance on any information supplied by TFA Global Pte Ltd.
The speaker(s) is neither an employee, agent nor representative of Tradu and is therefore acting independently. The opinions given are their own, constitute general market commentary, and do not constitute the opinion or advice of Tradu or any form of personal or investment advice. Tradu neither endorses nor guarantees offerings of third-party speakers, nor is Tradu responsible for the content, veracity or opinions of third-party speakers, presenters or participants.
