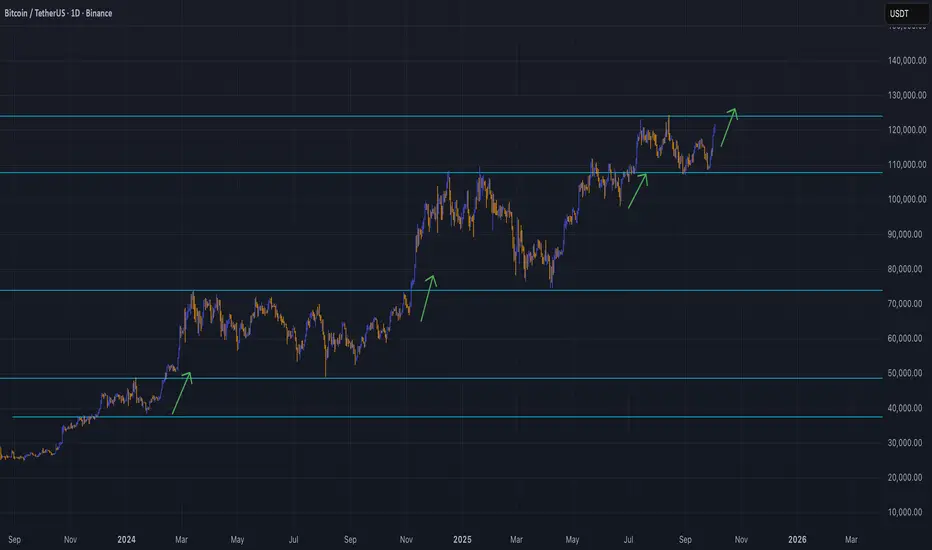
Is Bitcoin ready to go parabolic?If you see us restart posting trading ideas, you know the news must be good. Bitcoin has once again crossed $120k. Interest rates are going down, liquidity is rising. The pathway to a new Bitcoin All-Time-High seems firmly in sight. Even Altcoins, not a source of great joy so far this cycle, have seen momentum. Ethereum, Solana and other large-cap Alts are hovering near all-time-highs. The 'meta' of Perp Dexes has propelled HYPE, the currency of Hyperliquid, into the Top 20 Market Cap coins. The 'catchup trade' for other Perp Dex tokens such as Aster saw tokens jump 100%+ in a matter of hours. The animal spirits are back.
In each crypto-cycle there are multiple simultaneous trends. Some of the are purely speculation, others are actual technical innovations, others are on the political front. This cycle so far has seen the by-far most positive political breakthroughs for the industry. Stablecoin bills and regulation in jurisdictions such as the US and Europe allowed stablecoin use-cases to reach breakout velocity. In line with that comes accessible yield, as stablecoins are often backed by US bond yields, and payments. On the scalability front, rollups, extremely fast chains, zero-knowledge scaling technology and next-gen chains such as Monad or MegaETH have become available and at least somewhat battle-tested. There is still no solution to the Blockchain trilemma of how to achieve scalability, speed and decentralization. Yet it is obvious that we are on the road to a solution. That is extremely bullish for the promise of Blockchains to eventually become the backbone for large parts of finance.
In the meantime, this cycle's crypto price action has not managed to keep up with stock markets. The boom of AI has led to ever higher highs for the largest benefactors such as Google or Nvidia. The proliferation of ETFs that give exposure to new 'hot' topics, from modular nuclear to data centers, has made stock investing extremely accessible to retail investors. Many of these retail investors have previous first-hand knowledge of crypto markets' volatility and have so far refused to re-enter in the same numbers as last seen during the 2021 Bull market.
Will a new Bitcoin all-time-high change this and lure traders back into crypto markets? The probability of this happening remains but the pathway is less obvious. First and foremost, Crypto needs to see 'large new winners'. Nothing gets a retail trader back like watching their friend earn significant returns from a 100x on a new coin. But too many retail traders lost out in this cycle's launches due to insiders, overvalued market caps and a general lack of demand. Too few genuine retail participants have 'won'. For now though, Bitcoin continues to rise higher. The cycle continues. We ride on.
Cryptomarket
XRP Price Action – Accumulation Before GrowthXRP is currently navigating a phase defined by liquidity-driven swings and rapid sentiment shifts. After the market endured a heavy decline, buyers have re-emerged, showing resilience through aggressive rebounds. This behavior reflects a deeper pattern: sellers are losing efficiency in driving the market lower, while buyers are treating each dip as an opportunity to accumulate.
In the short term, the market appears to be balancing between two forces — the need for a corrective retracement to secure liquidity, and the desire of participants to push price into higher zones. This tug-of-war often results in shallow pullbacks, where temporary declines are quickly absorbed. Such behavior highlights that speculative capital is rotating back into XRP, aligning with broader risk-on sentiment across digital assets.
If this pattern holds, the near-term trajectory favors gradual expansion, with the asset likely aiming for higher valuations. However, investors should remain aware that short-term corrections are less about trend reversals and more about the mechanics of liquidity collection.

TradeCityPro | TON: Testing Resistance for Bullish Momentum👋 Welcome to TradeCity Pro!
In this analysis I want to review the TON coin for you. This project is one of the most popular crypto projects developed for the Telegram platform, and its coin is ranked 23 on CoinMarketCap with a market cap of $7.05 billion.
⏳ 4-Hour Timeframe
In the 4-hour timeframe, after a downward move, TON formed a bottom at 2.658. After this level was faked once, it was supported and the upward movement began.
✔️ The first trigger for bullish confirmation was at 2.752, which got activated, and after the breakout, the price moved up to 2.843.
📊 The 2.843 level is the last high that previously caused the price to print a lower low. These types of highs usually attract reactions in the future, and their breakout can lead to a trend reversal.
🔔 Currently, 2.843 is exactly that level, and so far the price has touched it twice. Considering the fake breakdown of the 2.658 support, good bullish momentum has entered the market, and in future attempts the price could break this level.
💥 The RSI oscillator has also been rejected from the 70 level and is now correcting. If 70 is broken and RSI enters Overbuy, the main bullish move can begin.
✨ The next levels above the price are 3.058 and 3.246. Although they are still far from the current price, in my view 3.246 is the main trigger for a larger bullish move in TON. If the price moves above this level, the trend in higher timeframes will turn bullish.
📝 Final Thoughts
Stay calm, trade wisely, and let's capture the market's best opportunities!
This analysis reflects our opinions and is not financial advice.
Share your thoughts in the comments, and don’t forget to share this analysis with your friends! ❤️

DOGS; BUY OR SELL?Hello friends
Given that the price has reached the specified support and the price is supported by buyers in the specified area and the specified resistance has been broken, we can buy in steps with risk and capital management and move to the specified targets.
*Trade safely with us*

NOTCOIN; BUY SIGNALHello friends
Given that the price has reached the specified support and the price is supported by buyers and the specified resistance has been broken, we can buy in steps with risk and capital management and move to the specified targets.
*Trade safely with us*

ETH/USDT – Bear Market Rally Into Q4Ethereum has staged a bear market rally as we move into the beginning of the last quarter of the year. After finding strong support around $3,826–$3,866, price recovered sharply and is now consolidating near the $4,480–$4,500 resistance zone.
• Resistance Zone (Supply): $4,487 – $4,561
• Support Zone (Demand): $3,826 – $3,866
• Current Price: $4,479
The structure shows that sellers are likely to step back in at this level, suggesting another weekend of selling pressure. If ETH fails to break and hold above the $4,560 level, downside momentum could retest the $3,800 area.
📉 Bearish Case: Rejection from resistance → continuation lower toward $3,826–$3,866.
📈 Bullish Case: Break and daily close above $4,561 → opens room for $4,700+ continuation.

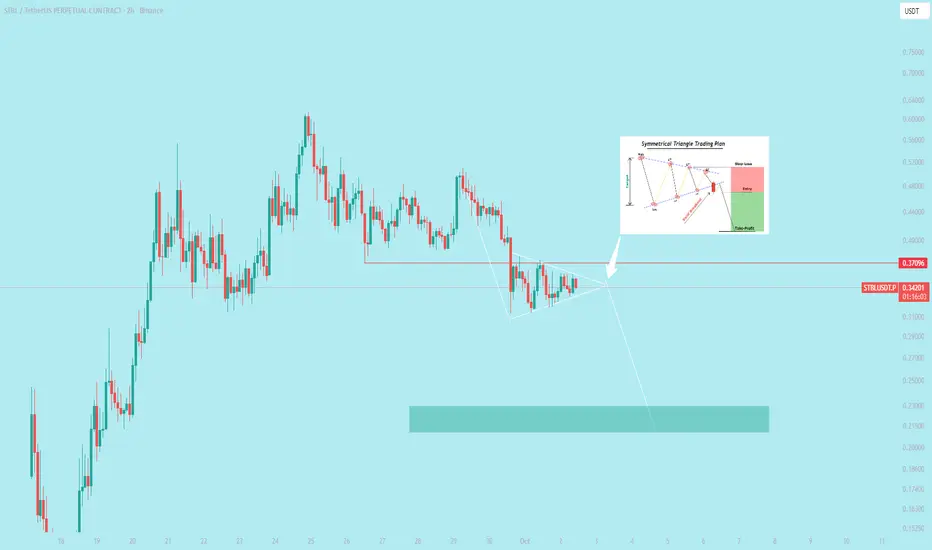
$STBL looks weak 🥴 *A bearish symmetrical triangle is a technical analysis chart pattern that signals a period of consolidation in a downward trend, followed by a continuation of the downtrend. It indicates that after a price decline, sellers and buyers reach a temporary equilibrium before sellers regain control and drive the price lower.*
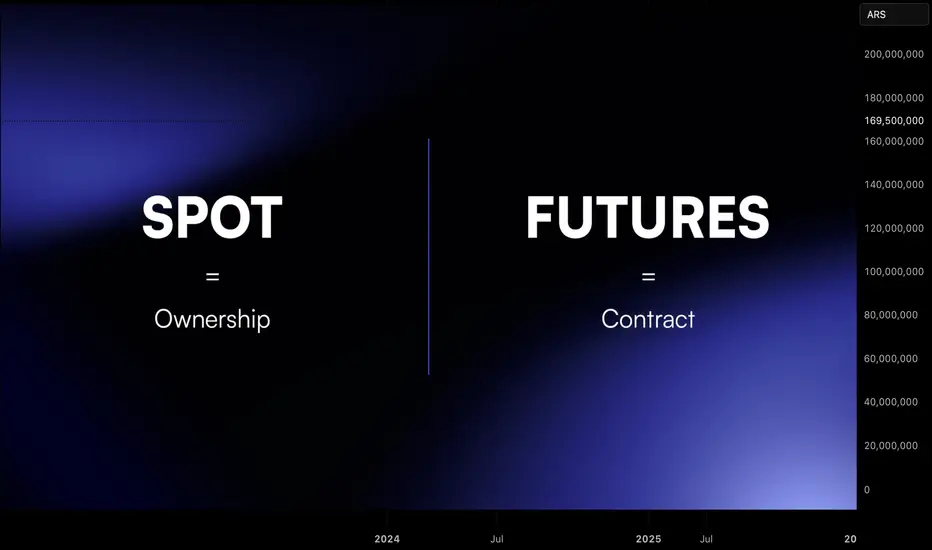
Futures vs Spot: What Traders Need to Know1. Introduction
In crypto, two of the most common ways to trade are spot markets and futures markets.
Both can be profitable, but they operate differently and knowing the differences is critical for survival.
Spot trading is straightforward: you buy the asset, you own it.
Futures trading is more complex: you speculate on the asset’s price without actually owning it.
This guide explains the differences, benefits, and risks of each so you can decide which suits your style.
2. What Is Spot Trading?
Spot trading is simple. You buy the asset, you own it.
There is no leverage. You pay the full price.
Profit and loss move one-to-one with the asset’s price.
Pros
Simple to understand.
No liquidation risk.
Can benefit from staking or long-term custody.
Cons
Limited upside with small capital.
Cannot profit when the market falls.
3. What Is Futures Trading?
Futures are contracts. You do not own the asset, only exposure to its price.
They allow leverage, often up to 10x or more.
You can go long to profit from rising markets or short to profit from falling ones.
Contracts can have expiry dates or be perpetual.
Pros
Flexibility to trade both directions.
Efficient capital use with leverage.
Useful for hedging spot positions.
Cons
Liquidation risk.
Complex funding fees on perpetuals.
Temptation to overtrade.
4. Key Differences: Spot vs Futures
Spot = You own the asset.
Futures = You own a contract.
Spot = No leverage.
Futures = High leverage possible.
Spot = Profits only when price rises.
Futures = Profits when price rises or falls.
Spot = Best for beginners and investors.
Futures = Best for experienced traders and hedgers.
Spot = simplicity. Futures = flexibility, but higher risk.
5. Why Futures Can Be Risky
Leverage is attractive, but it cuts both ways:
A 10 percent drop with 10x leverage equals a 100 percent account loss.
Liquidations close positions automatically if collateral is too low.
6. When to Use Spot vs Futures
Use spot if you want to own crypto long-term.
Use spot if you prefer simplicity and no liquidation stress.
Use futures if you want to hedge your holdings.
Use futures if you need market exposure with limited capital.
Use futures only if you have strict discipline and risk control.
7. Combining Spot and Futures
Many professionals use both:
Hold spot ETH as a long-term investment.
Use futures shorts to hedge during downturns.
This balances long-term conviction with short-term protection.
Think of it like insurance: futures protect spot positions when markets get volatile.
8. Risk Management Is the Deciding Factor
Whether you trade spot or futures, risk management decides survival:
In spot: limit allocation per asset.
In futures: control leverage, set stop losses, and manage liquidation risk.
In both: size positions by account % risk.
Without a risk plan, futures become gambling and even spot can lead to poor results.
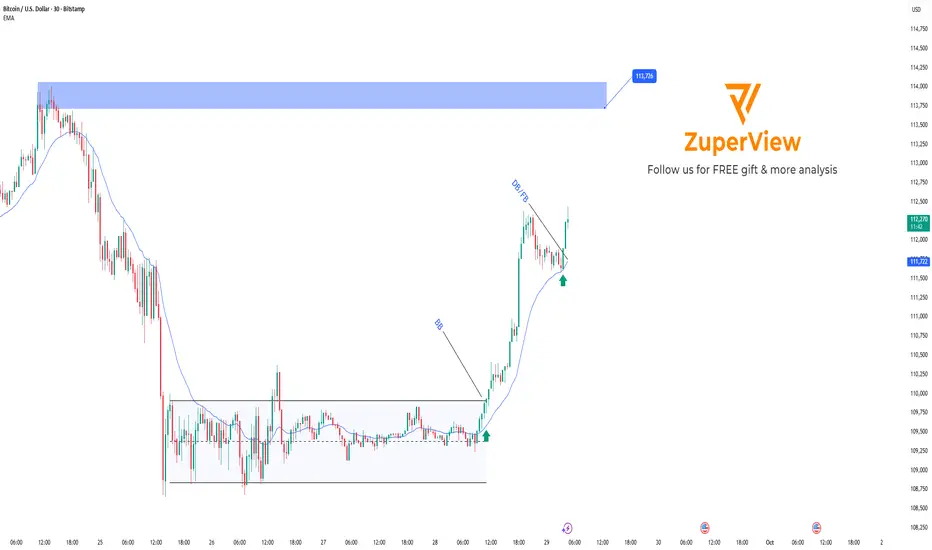
BTC escapes consolidation, shifting into an uptrend
Price has broken out of the sideway range 108,500 – 109,800, shifting from bearish to bullish.
After the BB (Block Breakout), BTC surged to 112,500 – 113,000 before consolidating.
Currently, price is trading far from the EMA (around 111,100), implying a possible pullback.
Strategy:
Wait for price to retrace toward EMA (111,000 – 111,200) or consolidate in this zone.
If patterns such as DD (Double Doji) or FB (First Breakout) form within 111,000 – 111,500, consider long entries.
Please like and comment to support our traders. Your feedback motivates us to produce more analysis in the future 🙏✨
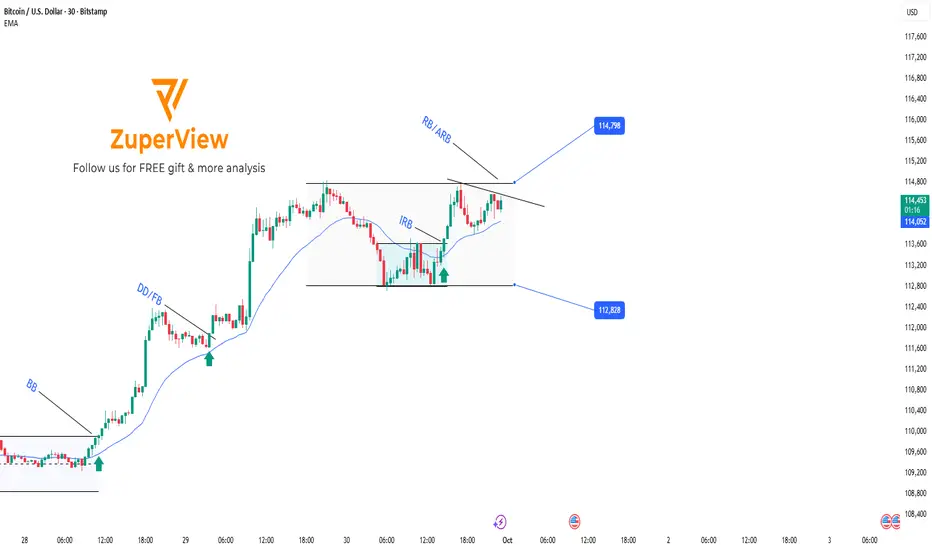
BTC breakout trading setupBITSTAMP:BTCUSD is currently consolidating within the 112,828–114,798 sideway range.
Earlier, the market broke out from a smaller accumulation inside the larger range, generating an IRB (Inside Range Break) signal, pushing price back toward the upper boundary.
Price is now forming a momentum consolidation, indicating potential for another breakout.
2 Possible Scenarios
1. RB (Range Break)
Price compresses further with EMA pressing tightly.
A strong breakout directly above the range top may occur with momentum.
2. ARB (Advance Range Break)
After breaking above the range, instead of continuing higher immediately, price may stall.
A new consolidation forms just above the broken range, with EMA pressing upward.
This setup may signal a continuation of the previous breakout move.
You can refer to my previous analysis here:
Please like and comment below to support our traders. Your reactions motivate us to do more analysis in the future 🙏✨
Daniel Miller @ ZuperView
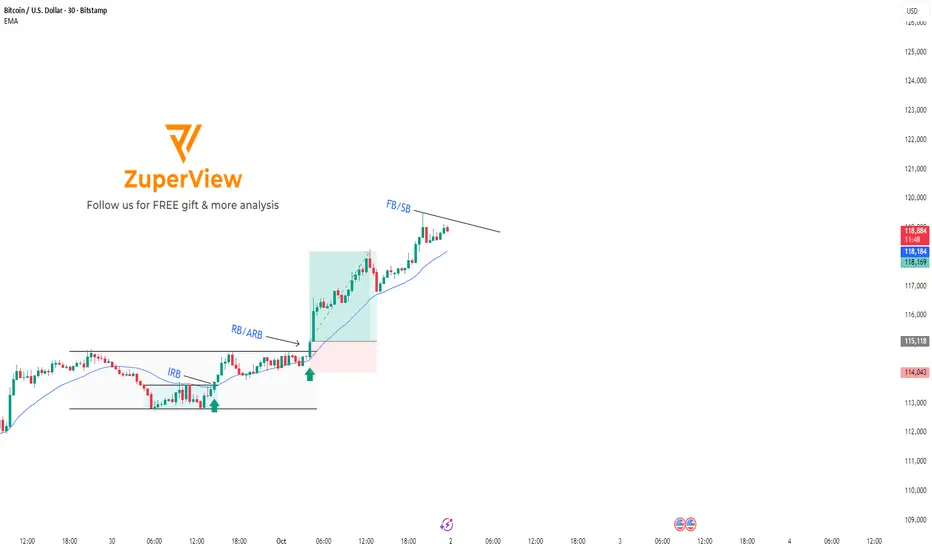
BTCUSD: Breakout played out, focus on EMA retestOverview
Yesterday’s Breakout Plan played out correctly, with BITSTAMP:BTCUSD continuing its bullish move.
The market remains in an uptrend, with no clear signs of reversal.
However, price is currently trading far above the EMA, so it’s not ideal to chase entries here.
Trading Plan for Today
Primary Scenario:
Wait for BITSTAMP:BTCUSD to retrace closer to the EMA and form a momentum consolidation zone.
If confirmation appears (e.g. breakout through the short-term trendline), consider long entries in line with the trend.
Alternative Scenario:
If BTC closes below the EMA with strong bearish momentum, a deeper correction is possible.
In this case, stay cautious and wait for a new structure to form before re-entering.
You can refer to my previous analysis here:
Please like and comment below to support our traders. Your reactions motivate us to do more analysis in the future 🙏✨
Daniel Miller @ ZuperView
CRV / USDT : One strong move will start Massive rallyCRV is breaking out from trend line resistance. A confirmed breakout with strong momentum can open the way for a rally towards $1.00 – $1.15.
Keep a close watch, wait for confirmation, and manage risk wisely.

BTCUSD H4 | Bullish Momentum Likely to ContinueBitcoin (BTC/USD) is falling towards the buy entry at 117,764.14, which is a pullback support that aligns with the 23.6% Fibonacci retracement and could bounce from this level to the upside.
Stop loss is at 114,705.13, which is a pullback support that lines up with he 50% Fibonacci retracement.
Take profit is at 124,031.38, which acts as a swing high resistance.
High Risk Investment Warning
Trading Forex/CFDs on margin carries a high level of risk and may not be suitable for all investors. Leverage can work against you.
Stratos Markets Limited (tradu.com ):
CFDs are complex instruments and come with a high risk of losing money rapidly due to leverage. 65% of retail investor accounts lose money when trading CFDs with this provider. You should consider whether you understand how CFDs work and whether you can afford to take the high risk of losing your money.
Stratos Europe Ltd (tradu.com ):
CFDs are complex instruments and come with a high risk of losing money rapidly due to leverage. 66% of retail investor accounts lose money when trading CFDs with this provider. You should consider whether you understand how CFDs work and whether you can afford to take the high risk of losing your money.
Stratos Global LLC (tradu.com ):
Losses can exceed deposits.
Please be advised that the information presented on TradingView is provided to Tradu (‘Company’, ‘we’) by a third-party provider (‘TFA Global Pte Ltd’). Please be reminded that you are solely responsible for the trading decisions on your account. There is a very high degree of risk involved in trading. Any information and/or content is intended entirely for research, educational and informational purposes only and does not constitute investment or consultation advice or investment strategy. The information is not tailored to the investment needs of any specific person and therefore does not involve a consideration of any of the investment objectives, financial situation or needs of any viewer that may receive it. Kindly also note that past performance is not a reliable indicator of future results. Actual results may differ materially from those anticipated in forward-looking or past performance statements. We assume no liability as to the accuracy or completeness of any of the information and/or content provided herein and the Company cannot be held responsible for any omission, mistake nor for any loss or damage including without limitation to any loss of profit which may arise from reliance on any information supplied by TFA Global Pte Ltd.
The speaker(s) is neither an employee, agent nor representative of Tradu and is therefore acting independently. The opinions given are their own, constitute general market commentary, and do not constitute the opinion or advice of Tradu or any form of personal or investment advice. Tradu neither endorses nor guarantees offerings of third-party speakers, nor is Tradu responsible for the content, veracity or opinions of third-party speakers, presenters or participants.

ETHUSD H4 | Signs of a Possible Bearish ReversalEthereum (ETH/USD) is reacting off the sell entry at 4,471.14, which is an overlap resistance that aligns with the 78.6% Fibonacci retracement and could drop from this level to the take profit.
Stop loss is at 4,673.87, which is a pullback resistance.
Take profit is at 4,278.67, which is a pullback support that lines up with the 38.2% Fibonacci retracement.
High Risk Investment Warning
Trading Forex/CFDs on margin carries a high level of risk and may not be suitable for all investors. Leverage can work against you.
Stratos Markets Limited (tradu.com ):
CFDs are complex instruments and come with a high risk of losing money rapidly due to leverage. 65% of retail investor accounts lose money when trading CFDs with this provider. You should consider whether you understand how CFDs work and whether you can afford to take the high risk of losing your money.
Stratos Europe Ltd (tradu.com ):
CFDs are complex instruments and come with a high risk of losing money rapidly due to leverage. 66% of retail investor accounts lose money when trading CFDs with this provider. You should consider whether you understand how CFDs work and whether you can afford to take the high risk of losing your money.
Stratos Global LLC (tradu.com ):
Losses can exceed deposits.
Please be advised that the information presented on TradingView is provided to Tradu (‘Company’, ‘we’) by a third-party provider (‘TFA Global Pte Ltd’). Please be reminded that you are solely responsible for the trading decisions on your account. There is a very high degree of risk involved in trading. Any information and/or content is intended entirely for research, educational and informational purposes only and does not constitute investment or consultation advice or investment strategy. The information is not tailored to the investment needs of any specific person and therefore does not involve a consideration of any of the investment objectives, financial situation or needs of any viewer that may receive it. Kindly also note that past performance is not a reliable indicator of future results. Actual results may differ materially from those anticipated in forward-looking or past performance statements. We assume no liability as to the accuracy or completeness of any of the information and/or content provided herein and the Company cannot be held responsible for any omission, mistake nor for any loss or damage including without limitation to any loss of profit which may arise from reliance on any information supplied by TFA Global Pte Ltd.
The speaker(s) is neither an employee, agent nor representative of Tradu and is therefore acting independently. The opinions given are their own, constitute general market commentary, and do not constitute the opinion or advice of Tradu or any form of personal or investment advice. Tradu neither endorses nor guarantees offerings of third-party speakers, nor is Tradu responsible for the content, veracity or opinions of third-party speakers, presenters or participants.

DOTUSD H4 | Bearish Drop in Progress”DOT/USD is reacting off the sell entry which is a pullback resistance that aligns with the 50% Fibonacci retracement and could drop from this levle to the downside.
Sell entry is at 4.165, which is a pullback resistance that aligns with the 50% Fibonacci retracement.
Stop loss is at 4.420, which is a pullback resistance.
Take profit is at 3.878, which is an overlap support that aligns with the 61.8% Fibonacci retracement.
High Risk Investment Warning
Trading Forex/CFDs on margin carries a high level of risk and may not be suitable for all investors. Leverage can work against you.
Stratos Markets Limited (tradu.com ):
CFDs are complex instruments and come with a high risk of losing money rapidly due to leverage. 65% of retail investor accounts lose money when trading CFDs with this provider. You should consider whether you understand how CFDs work and whether you can afford to take the high risk of losing your money.
Stratos Europe Ltd (tradu.com ):
CFDs are complex instruments and come with a high risk of losing money rapidly due to leverage. 66% of retail investor accounts lose money when trading CFDs with this provider. You should consider whether you understand how CFDs work and whether you can afford to take the high risk of losing your money.
Stratos Global LLC (tradu.com ):
Losses can exceed deposits.
Please be advised that the information presented on TradingView is provided to Tradu (‘Company’, ‘we’) by a third-party provider (‘TFA Global Pte Ltd’). Please be reminded that you are solely responsible for the trading decisions on your account. There is a very high degree of risk involved in trading. Any information and/or content is intended entirely for research, educational and informational purposes only and does not constitute investment or consultation advice or investment strategy. The information is not tailored to the investment needs of any specific person and therefore does not involve a consideration of any of the investment objectives, financial situation or needs of any viewer that may receive it. Kindly also note that past performance is not a reliable indicator of future results. Actual results may differ materially from those anticipated in forward-looking or past performance statements. We assume no liability as to the accuracy or completeness of any of the information and/or content provided herein and the Company cannot be held responsible for any omission, mistake nor for any loss or damage including without limitation to any loss of profit which may arise from reliance on any information supplied by TFA Global Pte Ltd.
The speaker(s) is neither an employee, agent nor representative of Tradu and is therefore acting independently. The opinions given are their own, constitute general market commentary, and do not constitute the opinion or advice of Tradu or any form of personal or investment advice. Tradu neither endorses nor guarantees offerings of third-party speakers, nor is Tradu responsible for the content, veracity or opinions of third-party speakers, presenters or participants.

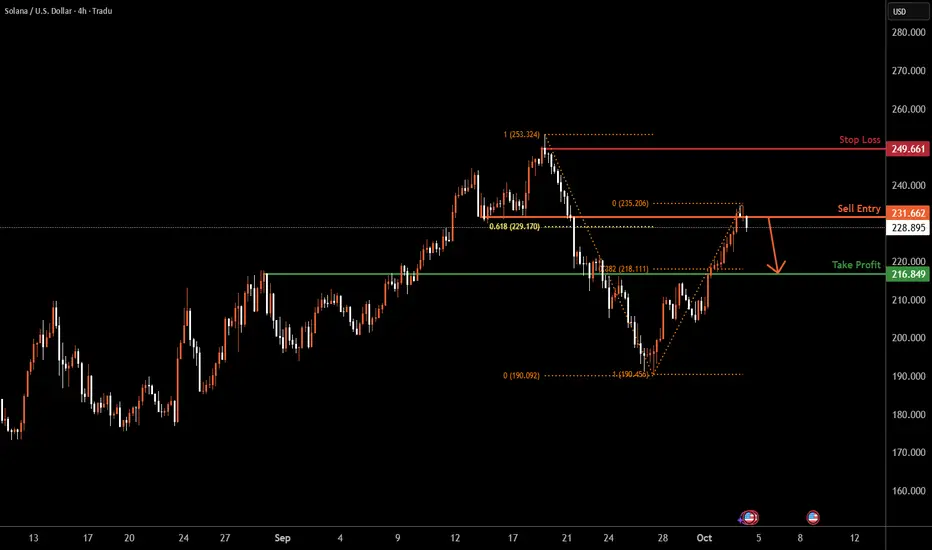
SOLUSD H4 | Bearish Reversal SetupSOL/USD is reacting off the sell entry, which is a pullback resistance that is slightly above the 61.8% Fibonacci retracement and could drop from this levle to the take profit.
Sell entry is at 231.66, which is a pullback resistance that is slightly above the 61.8% Fibonacci retracement.
Stop loss is at 249.66, which is a swing high resistance.
Take profit is at 216.84, which is an overlap support that aligns with the 38.2% Fibonacci retracement.
High Risk Investment Warning
Trading Forex/CFDs on margin carries a high level of risk and may not be suitable for all investors. Leverage can work against you.
Stratos Markets Limited (tradu.com ):
CFDs are complex instruments and come with a high risk of losing money rapidly due to leverage. 65% of retail investor accounts lose money when trading CFDs with this provider. You should consider whether you understand how CFDs work and whether you can afford to take the high risk of losing your money.
Stratos Europe Ltd (tradu.com ):
CFDs are complex instruments and come with a high risk of losing money rapidly due to leverage. 66% of retail investor accounts lose money when trading CFDs with this provider. You should consider whether you understand how CFDs work and whether you can afford to take the high risk of losing your money.
Stratos Global LLC (tradu.com ):
Losses can exceed deposits.
Please be advised that the information presented on TradingView is provided to Tradu (‘Company’, ‘we’) by a third-party provider (‘TFA Global Pte Ltd’). Please be reminded that you are solely responsible for the trading decisions on your account. There is a very high degree of risk involved in trading. Any information and/or content is intended entirely for research, educational and informational purposes only and does not constitute investment or consultation advice or investment strategy. The information is not tailored to the investment needs of any specific person and therefore does not involve a consideration of any of the investment objectives, financial situation or needs of any viewer that may receive it. Kindly also note that past performance is not a reliable indicator of future results. Actual results may differ materially from those anticipated in forward-looking or past performance statements. We assume no liability as to the accuracy or completeness of any of the information and/or content provided herein and the Company cannot be held responsible for any omission, mistake nor for any loss or damage including without limitation to any loss of profit which may arise from reliance on any information supplied by TFA Global Pte Ltd.
The speaker(s) is neither an employee, agent nor representative of Tradu and is therefore acting independently. The opinions given are their own, constitute general market commentary, and do not constitute the opinion or advice of Tradu or any form of personal or investment advice. Tradu neither endorses nor guarantees offerings of third-party speakers, nor is Tradu responsible for the content, veracity or opinions of third-party speakers, presenters or participants.
DOGEUSD H4 | Bearish Reversal in PlayDOGEUSD is reacting off the sell entry, which is a pullback resistance and could reverse from this level to the downside.
Sell entry is at 0.25862, which is a pullback resistance.
Stop loss is at 0.28429, which acts as a swing high resistance.
Take profit is at 0.23816, which is an overlap support that lines up with the 61.8% Fibonacci retracement.
High Risk Investment Warning
Trading Forex/CFDs on margin carries a high level of risk and may not be suitable for all investors. Leverage can work against you.
Stratos Markets Limited (tradu.com ):
CFDs are complex instruments and come with a high risk of losing money rapidly due to leverage. 65% of retail investor accounts lose money when trading CFDs with this provider. You should consider whether you understand how CFDs work and whether you can afford to take the high risk of losing your money.
Stratos Europe Ltd (tradu.com ):
CFDs are complex instruments and come with a high risk of losing money rapidly due to leverage. 66% of retail investor accounts lose money when trading CFDs with this provider. You should consider whether you understand how CFDs work and whether you can afford to take the high risk of losing your money.
Stratos Global LLC (tradu.com ):
Losses can exceed deposits.
Please be advised that the information presented on TradingView is provided to Tradu (‘Company’, ‘we’) by a third-party provider (‘TFA Global Pte Ltd’). Please be reminded that you are solely responsible for the trading decisions on your account. There is a very high degree of risk involved in trading. Any information and/or content is intended entirely for research, educational and informational purposes only and does not constitute investment or consultation advice or investment strategy. The information is not tailored to the investment needs of any specific person and therefore does not involve a consideration of any of the investment objectives, financial situation or needs of any viewer that may receive it. Kindly also note that past performance is not a reliable indicator of future results. Actual results may differ materially from those anticipated in forward-looking or past performance statements. We assume no liability as to the accuracy or completeness of any of the information and/or content provided herein and the Company cannot be held responsible for any omission, mistake nor for any loss or damage including without limitation to any loss of profit which may arise from reliance on any information supplied by TFA Global Pte Ltd.
The speaker(s) is neither an employee, agent nor representative of Tradu and is therefore acting independently. The opinions given are their own, constitute general market commentary, and do not constitute the opinion or advice of Tradu or any form of personal or investment advice. Tradu neither endorses nor guarantees offerings of third-party speakers, nor is Tradu responsible for the content, veracity or opinions of third-party speakers, presenters or participants.

BCHUSD H4 | Bullish Momentum BuildingBCH/USD has bounced off the buy entry which is a pullback support, and could rise to the take profit.
Buy entry is at 574.48, which is a pullback support.
Stop loss is at 548.19, which is a pullback support.
Take profit is at 623.52, which is a pullback resistance that aligns with the 78.6% Fibonacci retracement.
High Risk Investment Warning
Trading Forex/CFDs on margin carries a high level of risk and may not be suitable for all investors. Leverage can work against you.
Stratos Markets Limited (tradu.com ):
CFDs are complex instruments and come with a high risk of losing money rapidly due to leverage. 65% of retail investor accounts lose money when trading CFDs with this provider. You should consider whether you understand how CFDs work and whether you can afford to take the high risk of losing your money.
Stratos Europe Ltd (tradu.com ):
CFDs are complex instruments and come with a high risk of losing money rapidly due to leverage. 66% of retail investor accounts lose money when trading CFDs with this provider. You should consider whether you understand how CFDs work and whether you can afford to take the high risk of losing your money.
Stratos Global LLC (tradu.com ):
Losses can exceed deposits.
Please be advised that the information presented on TradingView is provided to Tradu (‘Company’, ‘we’) by a third-party provider (‘TFA Global Pte Ltd’). Please be reminded that you are solely responsible for the trading decisions on your account. There is a very high degree of risk involved in trading. Any information and/or content is intended entirely for research, educational and informational purposes only and does not constitute investment or consultation advice or investment strategy. The information is not tailored to the investment needs of any specific person and therefore does not involve a consideration of any of the investment objectives, financial situation or needs of any viewer that may receive it. Kindly also note that past performance is not a reliable indicator of future results. Actual results may differ materially from those anticipated in forward-looking or past performance statements. We assume no liability as to the accuracy or completeness of any of the information and/or content provided herein and the Company cannot be held responsible for any omission, mistake nor for any loss or damage including without limitation to any loss of profit which may arise from reliance on any information supplied by TFA Global Pte Ltd.
The speaker(s) is neither an employee, agent nor representative of Tradu and is therefore acting independently. The opinions given are their own, constitute general market commentary, and do not constitute the opinion or advice of Tradu or any form of personal or investment advice. Tradu neither endorses nor guarantees offerings of third-party speakers, nor is Tradu responsible for the content, veracity or opinions of third-party speakers, presenters or participants.

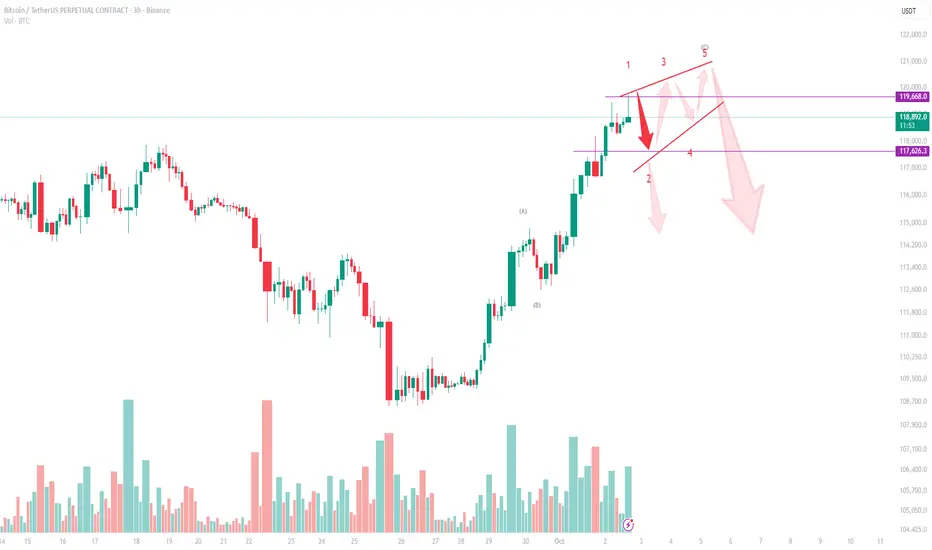
Bitcoin (BTC/USDT) Technical Analysis – 3H ChartWave Structure Outlook
Bitcoin is currently trading near $119,300, where the wave structure suggests a possible Ending Diagonal formation. This leaves us with two bearish scenarios to monitor:
Scenario 1 – Immediate Downside After 1–5 Completion
The 1–5 wave sequence may already be completed.
If so, the market could trigger an immediate downside move, breaking wedge support.
First critical level is $117,600. A clean break below this level would confirm the start of a deeper correction, opening the way toward $115,000 – $113,000.
Scenario 2 – Choppy Ending Diagonal (Light Red Arrows)
Alternatively, BTC may still extend within an Ending Diagonal.
This would mean choppy, back-and-forth price action (small up-and-down moves) before the final breakdown.
In this case, price may retest the $119,800 – $120,000 zone, but the structure remains corrective, and the eventual expectation is still bearish reversal.
Key Levels to Watch
Resistance: $119,800 – $120,000 (upper wedge boundary)
Support: $117,600 (first breakdown level)
Bearish Targets: $115,000 → $113,000
Conclusion
BTC is losing momentum at the end of a 5-wave structure. Whether the market follows Scenario 1 (immediate breakdown) or Scenario 2 (choppy diagonal ending before reversal), the overall outlook is bearish in the short term.
Rare Sell Opportunity on Bitcoin , target 114KBitcoin is currently approaching the 124,000 – 124,500 zone, which represents its all-time high and the strongest resistance level the market has ever seen.
From a technical perspective, this zone provides a golden and rare opportunity to enter a short trade, based on the following:
Price reaching an unprecedented all-time high.
Clear overbought signals on momentum indicators (RSI – MACD).
High probability of a significant profit-taking move from these levels.
🎯 Trading Plan:
Short entry: 124,000 – 124,500
Main target: 114,000
Stop-loss: Above 125,000
⚠️ This is not financial advice, but rather a personal technical analysis based on current market conditions.

ETH Retest Done – ATH SoonEthereum has pulled back perfectly into its key resistance-turned-support zone and held strong. This successful retest is a healthy sign for the trend, showing buyers are stepping in to defend the level.
If momentum builds from here, CRYPTOCAP:ETH could gear up for another big leg higher toward new highs.
Stay tuned.
DYOR, NFA
Follow us for more market insights and daily updates on Tradingview.
#PEACE ✌

WLFI Daily on SPOT
Looking at the daily SPOT chart with Fibonacci levels, price action is showing some key spots.
Support: 0.5 Fib at $0.1984 (aligns with S2 from the 4H series).
Resistance: 0.236 Fib at $0.2354.
Technicals show early signs of strength: price is above the BB center and SMA, though PSAR is still bearish. RSI sits above its MA but remains under the mid-level.
Overall, the chart suggests price is condensing before a move. Considering the macro (rate cuts pushing risk-on), positive crypto news, and a historically bullish Q4, odds lean upward.
Patience and risk management remain key, otherwise you risk getting liquidated and watching price climb without you.
Always take profits and manage risk.
Interaction is welcome.

Bitcoin Harmonic Pattern , Target 105,000On the daily chart of Bitcoin, we can see the formation of a Gartley Pattern, one of the most well-known Harmonic Patterns. These patterns rely on Fibonacci Ratios and are typically used to anticipate a trend reversal after a strong move either upward or downward.
Recently, Bitcoin has reached a very important resistance zone between $120,000 – $121,000. The completion of the Gartley pattern in this zone increases the likelihood of a bearish correction.
Factors supporting a downside move:
Harmonic Pattern – Gartley: Completion at resistance provides a reversal signal.
PRZ (Potential Reversal Zone): Located near $120K.
Technical Indicators:
RSI shows overbought conditions, suggesting buying pressure is weakening.
MACD is close to a bearish crossover, another negative signal.
Volume: Buying volume is declining at recent highs, which often signals a distribution phase by large players and institutions.
📉 Support Levels:
The main target for the pattern is $105,500, a strong support level where price previously rebounded.
🎯 Trading Plan (Expected Scenario):
Potential Entry Zone: Between $120,500 – $121,000 (near resistance).
Targets (Take Profit):
TP1 = $114,000
TP2 = $110,200
TP3 = $105,500 (main target).
Stop Loss: Daily close above $121,800.
✅ Conclusion:
Bitcoin is currently at a very critical level, with the Gartley pattern completing right at resistance, combined with weakening technical indicators and declining volume. This supports the idea that the market may enter a short-to-medium term bearish correction with gradual downside targets ending near $105,500.
At the current zone, this is not considered a safe buying opportunity. Instead, it looks more like a selling opportunity or a case for waiting until price corrects to more favorable levels.
👍 Don’t forget to boost this trading idea if you found it helpful,
and follow me for more daily crypto insights and trade signals.
⚠️ Please note:
This is not financial advice – I’m only sharing my personal trades.
Always do your own research before taking action.
Best of luck 🌹
