BTC/USDT ; Is the shedding over?Hello friends
Due to the price correction we had, the price has bounced back into a good support area where there were many buy orders and has reacted well.
Now it remains to be seen whether it will succeed in defeating the trading pain or not.
If buyers continue to support the price, it could break the range and move towards the specified targets.
*Trade safely with us*
Cryptomarket

SUI Swing Long Opportunity - HDDZ Model SUI Swing Long Opportunity – HTF Demand w/ Discount Zone (HDDZ Model)
📊 Market Sentiment
FED has resumed its rate-cutting cycle, starting with a 0.25% cut in September, with two more expected. Institutional liquidity inflows have accelerated as the U.S. officially adopts crypto as part of its reserves. Despite elevated inflation, a weakening labor market is forcing the FED to ease, pushing more capital into risk-on assets.
📈 Technical Analysis
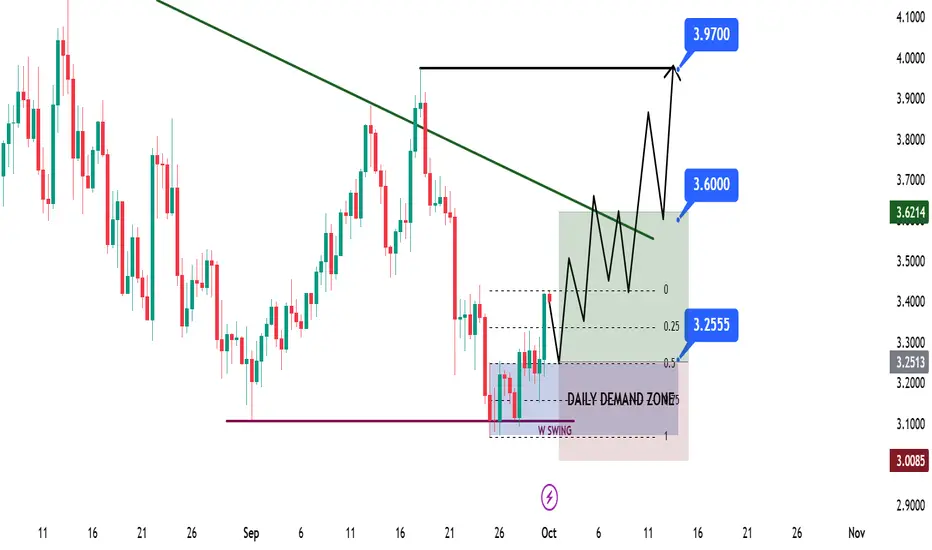
SUI is bullish on HTF, so only long setups are considered. Price recently swept the weekly swing liquidity and closed above, then broke market structure on LTF — confirming bullishness and creating a valid Daily Demand zone. Price has already tested this zone once and found rejection, validating its significance.
Currently, price is rejecting from the bearish LTF trendline above, which remains a key resistance. A retest of the confluence at 3.25$ (Daily Demand + Discount Zone) offers a strong setup for continuation higher.
📘 Model to be used – HDDZ (HTF Demand w/ Discount Zone)
In this model, I first confirm HTF bias. Then, I look for creation of HTF Demand zones. Finally, I use Fibonacci retracement to locate the discount zone. When both the demand zone and discount zone align, it creates a strong confluence for trade entries.
📌 Game Plan
1-Wait for price to revisit 3.25$ confluence zone.
2-Carry trade toward bearish LTF trendline, securing profits early if price rejects.
🎯 Setup Trigger
Entry confirmation once price hits 3.25$.
📋 Trade Management
Stoploss: 2.97$
Targets:
TP1: 3.61$
TP2: 3.97$
After TP1, move SL to breakeven to secure the position.
💬 Like, follow, and comment if this breakdown supports your trading! More setups and insights coming soon — stay connected!
⚠️ Disclaimer: This content is for informational and educational purposes only and does not constitute financial, investment, or trading advice. Always DYOR before making any financial decisions.
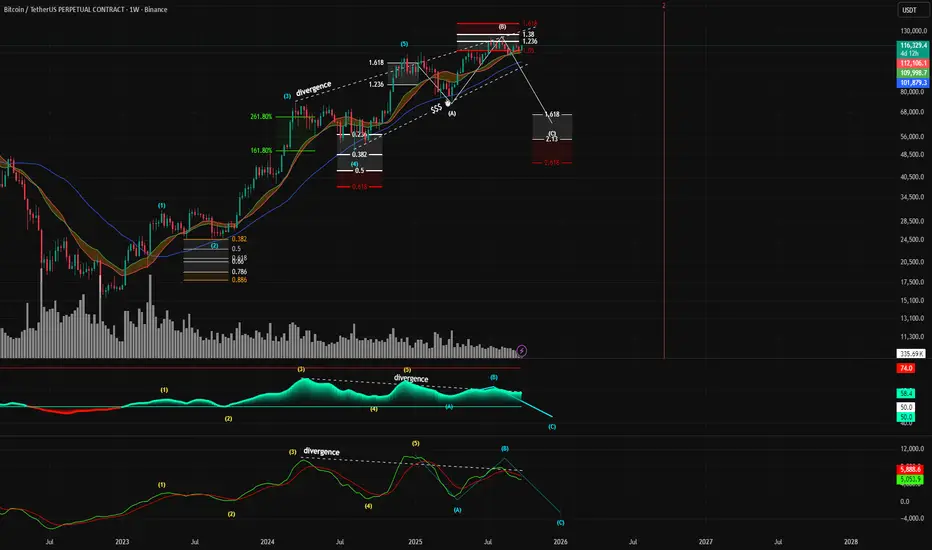
Expanding Flat Elliot wave countBitcoin may be approaching a significant macro top, with multiple technical indicators aligning to signal a potential reversal and a subsequent major corrective wave.
Key Projections:
Potential Top Formation: The current price action is forming what appears to be the peak of a corrective Wave (B), with a potential top range between $109,000 and $150,000.
Projected Corrective Target: Following the completion of Wave (B), a significant downward move, labeled as Wave (C), is anticipated. This corrective wave targets the $45,000 - $67,000 price zone.
Timeline: The entire corrective structure, from the formation of the top to the potential bottom of Wave (C), is projected to unfold by approximately September 2026.
Elliott Wave Structure: The primary thesis is based on an Elliott Wave count. The chart indicates the completion of a five-wave impulse cycle, and the market is now in a larger A-B-C corrective pattern. The current price is likely forming the peak of the B-wave.
Fibonacci Confluence: There is a strong confluence of Fibonacci extension levels at the potential top. The peak of the current Wave (B) is precisely testing the 1.618 Fibonacci extension level, a critical ratio often associated with the termination of corrective waves.
Significant Bearish Divergence (Crucial Point): This is one of the most compelling signals on the chart.While the price is making higher highs (from the peak of wave (5) to the peak of wave (B)).Both the RSI and the MACD indicators are showing lower highs. This is a classic, multi-indicator bearish divergence on a high timeframe (weekly), indicating that the upward momentum is weakening significantly and a trend reversal is becoming more likely.
TradeCity Pro | XRP: Key Support and Resistance Zones Testing👋 Welcome to TradeCity Pro!
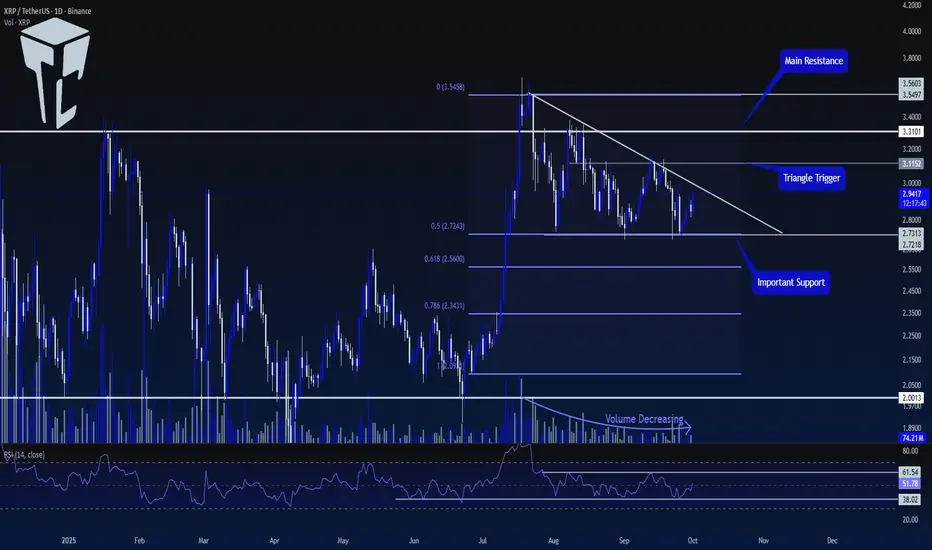
In this analysis, I will review the XRP coin. One of the oldest crypto projects, XRP aims to align crypto transactions with the SWIFT system. The coin has a market cap of $173 billion and is ranked 4th on CoinMarketCap.
📅 Daily Timeframe
After getting support at the 2.0013 level, XRP made a bullish move up to the 3.5603 resistance. Now, it has formed a descending triangle, and the volume has been decreasing as the price moves down.
⚡️ Currently, a crucial support zone has formed at 2.7218, which overlaps with the 0.5 Fibonacci level, forming a PRZ for us.
🧩 A descending trendline has also been created, and the price has touched it several times, making lower highs.
📊 To confirm the next bullish move for this coin, the first confirmation we need is the breakout of the trendline. The trendline breakout trigger is at 3.1152.
✨ Once this level is broken, we can open a long position. This trigger is the first long position trigger and is considered risky since we haven't yet received the main confirmation for a bullish trend.
🔍 The main trigger for the start of a new bullish trend is the breakout of the 3.3101 level. Breaking this level could start a new upward move for XRP.
💥 A very important confirmation for both long and short positions on the RSI is the breakout of the range between 38.02 and 61.54.
🎲 As long as the RSI remains between these two levels, the probability of hitting stop losses is high. Therefore, for a long position, we can wait for the 61.54 level on the RSI to be broken.
🔽 For a short position, the 38.02 level on the RSI is a good momentum trigger. We can also use the 2.7218 level as a trigger, but keep in mind that the main market momentum is bullish, so this short trigger is considered risky.
📝 Final Thoughts
Stay calm, trade wisely, and let's capture the market's best opportunities!
This analysis reflects our opinions and is not financial advice.
Share your thoughts in the comments, and don’t forget to share this analysis with your friends! ❤️
This month Will Define This Entire Crypto Cycle🎯 October Just Started — And It Might Define This Entire Crypto Cycle 📈
Happy October, everyone — a month with a powerful pattern.
If history repeats, this could be a defining moment:
2017 saw a 5x BTC rally in 60 days,
2021 delivered a 2.5x in just 45 days.
Now it’s 2025 , and we’re watching the charts line up once again. 🔁
We’ve been long Bitcoin since two days ago, right off the support at the bottom of the channel — a level we’ve tracked since March 14, 2023 .
That same chart gave us:
42K (hit summer 2023)
46K (initial rejection, later support)
And now, we’re targeting 127,370 → 138K–140K as part of the final macro wave. 🚀
Ethereum is showing strength too. From a solid buy zone near 4,000 , I still believe the next key levels are 6,443 and 10,364 .
Altcoins? Let’s talk dominance:
Bitcoin Dominance is still high (~58%) but could drop toward 56.91 — giving room for alts to breathe.
Ethereum Dominance remains in a clear descending channel, with a clean target of 18.29% dominance.
📊 We’ve revisited Ethereum vs. BTC charts, and I remain long ETH here with a 0.06 BTC target.
Other setups:
Solana support at 204.81 , targets 240 and 276 .
XRP ? I remain cautious — still preferring ETH over XRP based on recent cycles.
Total Market Cap still shows bullish structure, aiming for 4.8T and later 6.5T .
We’ve seen the October pattern repeat across cycles. While the exact altcoin winners change (XLM & XRP in 2017, ETH in 2021), the macro truth remains:
Bitcoin tends to lead — and October tends to explode.🔥
Thought of the Day 💡
“Cycles evolve, but the rhythm remains. Each October is a chance — not a promise. But charts give us a map, and right now, the map points up.”
Disclaimer
I share market views for educational and entertainment purposes only. This is not financial advice. I am not a licensed advisor. Trade at your own risk and always manage your capital responsibly.
One Love,
The FXPROFESSOR 💙
ps. it's a video..watch it and let me know your thoughts

XRP Swing Long Opportunity - LRKZ MODELXRP Swing Long Opportunity
📊 Market Sentiment
FED has resumed its rate-cutting cycle, starting with a 0.25% cut in September, with two more 0.25% cuts expected in the coming months. Additionally, institutional liquidity inflows have accelerated as the U.S. officially adopts crypto as part of its reserves. While inflation remains elevated, the weakening labor market is forcing the FED to ease, driving more capital into risk-on assets.
📈 Technical Analysis
Price made a new all-time high and is currently retracing before pushing higher again.
Price ran the weekly swing liquidity at $2.70 and closed above with a wick, confirming manipulation before expansion.
Price also retested the broken HTF Demand zone at $2.69, which was strong resistance previously and now acts as strong support.
These confluences strongly suggest rejection and continuation higher.
📘 Model to be used – HTF Liquidity Run into HTF Key Zone (LRKZ Model)
In this model, I first define the HTF trend. Then, I look for the most significant liquidity that lies opposite to the HTF trend (swing highs or lows). These zones often contain enough liquidity to trigger reversals or strong bounces. When price sweeps this liquidity and retests an HTF Key Zone (where strong limit orders sit), it creates a high-probability setup. Confirmation on LTF then provides the entry trigger.
📌 Game Plan
Price already closed above the $2.70 level, confirming entry. Looking for continuation higher with structured targets.
🎯 Setup Trigger
Setup is active long position valid after the daily close above $2.70.
📋 Trade Management
Stoploss: Daily close below $2.70 or hard stop at $2.50.
Targets:
TP1: $3.18
TP2: $3.37
TP3: $3.66 (ATH)
After TP1 is secured, I will move stoploss to breakeven and scale profits as price moves toward higher targets.
💬 Like, follow, and comment if this breakdown supports your trading! More setups and market insights coming soon — stay connected!
⚠️ Disclaimer: This content is for informational and educational purposes only and does not constitute financial, investment, or trading advice. Always DYOR before making any financial decisions.

$KERNEL Trade On Weekly Demand Zone Understanding Weekly Demand Zone Trading
Demand zone trading focuses on identifying specific price areas on a chart where significant buying pressure has previously caused prices to rise sharply. These zones are considered areas where institutional traders may have accumulated positions, creating an imbalance between supply and demand that can lead to future price increases when the market revisits these levels. When applying this to a weekly timeframe, traders look to identify these zones on weekly charts to locate major areas of demand.
**Important Considerations**
Demand zone trading requires patience, and while often effective, it is not always successful due to factors like news events or strong trends. Combining demand zone analysis with other indicators can provide additional confirmation and improve the strategy.

LIGHT VIEW HOW THE BREAKS CAN HAPPEN FROM BELOW $0,85 TO UP $2Licht is currently trading below $0.85. Based on trend data, once a low is confirmed, there is an 85% chance of a breakout. This analysis is supported by similar patterns observed in MYX and other coins that followed the same trajectory, as well as insights from the wallet DCA perspective.
The coin at this moment is below $0,85

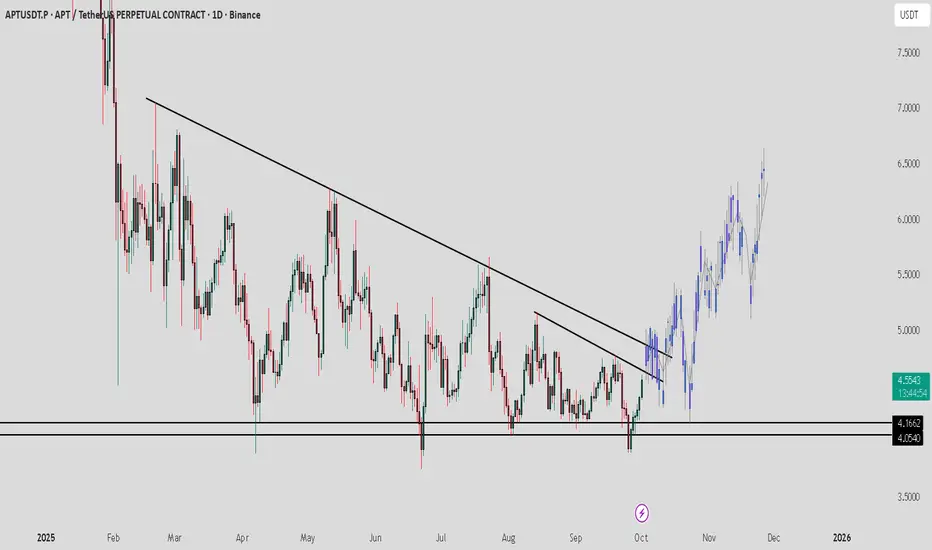
APT / USDT : Showing strong momentum for a strong rallyAPT/USDT Analysis
APT is building strong momentum and preparing for a potential breakout. Once it clears this level, we can expect a bullish rally towards $6 – $7 in the near term.
Always wait for confirmation before entering and manage risk wisely.
BTC Still IN GREEN ZONE - UPDATE 01-10-2025BTC/USDT Update
✅ Bitcoin has reclaimed the low time frame zone, showing renewed strength after the recent dip.
📊 As long as BTC continues holding above $113.6K support, the short-term trend remains bullish.
🚀 The next target sits around the $116K zone, where resistance could be tested in the coming sessions.
🔑 The main trend remains far below, meaning the broader structure is still secured and positive.
📌 Summary:
BTC is holding strong above the low time frame support, with momentum building toward the $116K target zone. Holding this structure keeps the outlook bullish.

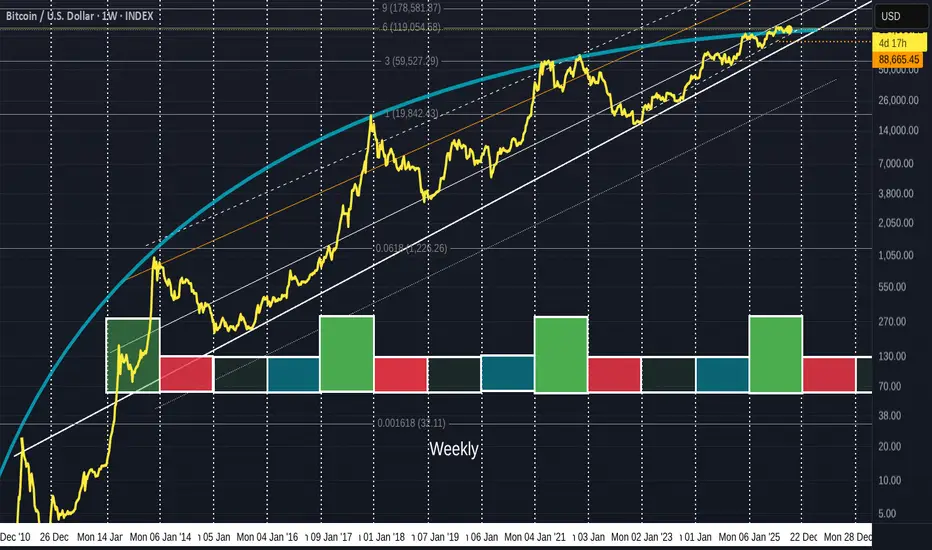
Why is Bitcoin under a LOT of pressure to move higher right now
That Blue line is a calculated Arc, that is, in fact, a part of a Fibonacci Spiral.
As you can see, it has rejected EVERY Bitcoin ATH - Every one.
And right now, PA is getting Squeezed by it and the line of long term support just below.
We have till year end to break and hold above this Blue Arc.
Here is a Zoomed version of the same chart.
PA is currently Just above that Line,,but only just.
It has been rejected a number of times since Q4 2024.
We need to break above and hold.
It is as simple as that, otherwise, PA will be dragged down.
As you probably realise, This is the end of this Series of Bitcoin cycles.
Once above the Spiral, we leave a series of patterns Bitcoin has been in since it was created in 2008
Exciting days ahead
Q-usdt ShortHello friends 😍
💖 First of all, thank you for giving me the motivation to post more analyses by hitting the
💖👉 boost button 👈💖
Let's start the day with another analysis
The Q-USDT cryptocurrency has the potential to fall
👉If I see the structure I want in these areas and the blue areas above, I will take a short and wait until the orange areas below
⚠️If I don't see the trigger I want, I will not enter the trade and short position!
So, you should not rush to enter and you must enter with a reason and a trigger
⚠️The analysis may not reach the final target, so at each target, if you make a good profit and see signs of a trend change, you can exit the trade or manage your capital.
⚠️ None of the analysis is a recommendation to buy or sell, but simply my personal opinions on the charts. You can use the charts and choose any that interest you and take a position if you wish.
To support me, I would appreciate it if you boost the analysis and share it with your friends so that I can analyze it with more energy for you, my dears. Thank you all. 💖

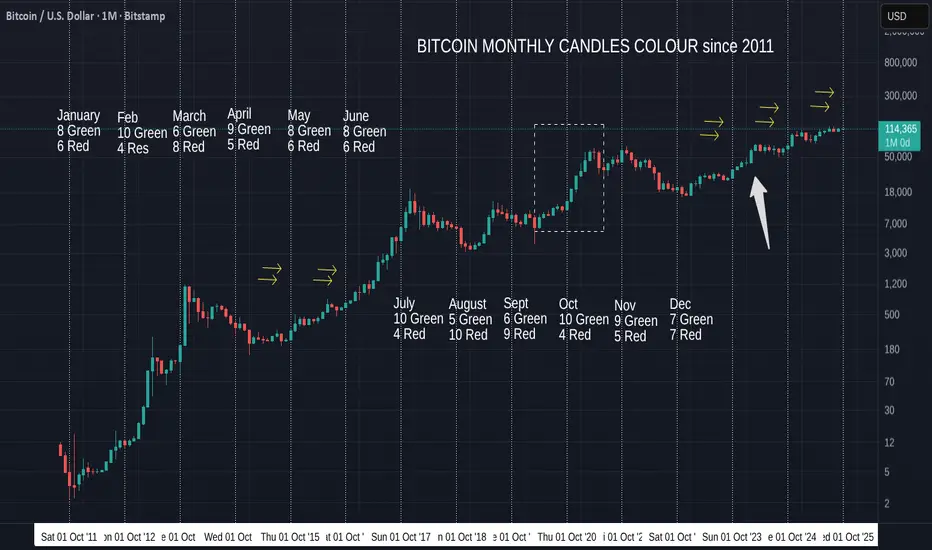
Bitcoin Monthly Candle Close colour & Patterns since 2011Septemer Closes GREEN
Where you see 2 Arrows is where we had a Green September after Red August Closes, as we have just had again.
All had Green Octobers Following.
Note those double arrows on the left are in the 2016 build up to 2017 ATH and the ones on the right are in the Current cycle.
Past October closes are 10 Green to 4 Red, so the Odds are we will see another Green October close, though it may not be a large candle.
InFacr, there are a few charts that point towards a Red start till around Second week, 12th - 15th October.
This of course can change but it maybe worth understanding that we may get a bloody month start.
However, given where we are in this Bitcoin cycle, assuming this one will continue as others have, we do not have a year plue left to reach ATH as the 2016 set of arrows would imply.
So my eye is now drawn to the Dashed box that leads up to the 2021 ATH in March 2021.
To many extents, that PA is very similar to that in 2023 (arrow) and if that is to be repeated, we could see a large recovery this month.
One thing that reslly needs to be mentioned is also how small the candles are now.
The pressure is on Bitcoin right now.
Of the 4 Red Octobers, only 1 was in a Bull run.
This months Candle Close Will certainly let us know where we are in a cycle.
That is IF we are still in a Cycle.
As mentioned in a number of posts now, the idea that Bitcoin will Drop away after the next ATH is possibly flawed.
But we have to wait and see what happens.
We can certainly look forward to a positive number of monthsd ahead for Bitcoin and this should take PA above a Long temm line of resistance that has rejected EVERY ATH since Bitcon started.( please refer to previous posts to learn more )
Happy October everyone and do not Panic if we do Dip further to start with
Bitcoin Under Pressure: Bearish Momentum BuildsBitcoin recently transitioned from a corrective decline into a consolidation phase, where price activity showed reduced volatility and market indecision. The breakout from this range has introduced renewed momentum, highlighted by strong bullish candles and a clear shift in trend dynamics. This move reflects fresh capital entering the market, suggesting growing investor confidence and positioning for potential continuation.
Despite this momentum, the structure also shows signs that rapid acceleration could invite short-term profit-taking, which may create phases of corrective retracement before the broader trend direction is reestablished. The market remains sensitive to global financial sentiment, liquidity cycles, and broader adoption narratives, meaning volatility should be expected even within an upward bias.
Overall, current conditions reflect a shift toward renewed optimism, with momentum favoring buyers while maintaining the likelihood of temporary corrections as part of a healthy market cycle.

MAVIA/USDT Analysis: Ready for a Major Breakout!🚀 MAVIA/USDT Recommendation 🚀
🔍 Technical Analysis:
We’re in a Strong Accumulation Phase, presenting an excellent opportunity to buy before a major breakout!
TP1: 2.44
TP2: 3.50
Ultimate Target (Talking to the Moon): 6.6660.
💡 About MAVIA:
MAVIA is an innovative metaverse project focused on building virtual worlds where users can own, develop, and profit from their digital assets. It offers strategy-based blockchain games that reward users for battles and base-building efforts.
🛠 Strong Partnerships:
MAVIA is backed by some of the most powerful names in the crypto industry, including:
Binance Labs : The investment arm of Binance, the world’s largest cryptocurrency exchange, adding enormous weight to MAVIA's credibility.
Crypto.com : A leading global cryptocurrency exchange supporting MAVIA’s mission to scale.
Animoca Brands : A leader in blockchain gaming and the metaverse, bringing valuable expertise to the project.
Delphi Digital : A premier research and investment firm in blockchain and crypto, providing strategic insights and support.
Merit Circle : A platform specializing in play-to-earn games, supporting MAVIA’s gaming ecosystem.
📈 Strategy:
Monitor price movements closely and keep an eye on key entry and exit levels to maximize profit potential.
We deliver top-tier insights and strategies that keep you ahead of the game.
#Crypto #MAVIA #Trading #MAVIAUSDT #Metaverse #Partnerships #CryptoHoneyTraders

$BTC Wyckoff DistributionPreliminary supply, or PSY:
Occurs when significant interests start to sell lots of shares following a sharp upward trend. Volume increases and the price spread widens, indicating the possibility of a trend change.
BC:
buying climax, characterized by frequently significant rises in volume and price spread. The intensity of purchasing peaks, with professional interests filling heavy or urgent public demand at prices close to their peak. Since large operators require enormous public demand to sell their shares without reducing the stock price, a BC frequently occurs in conjunction with excellent earnings reports or other positive news.
AR:
Automatic reaction. After the BC, the strong buying significantly decreased, but the heavy supply persisted, and an AR occurred. The lower border of the distribution TR is defined in part by the selloff's low.
ST:
Stands for the secondary test, in which the price returns to the BC region to evaluate the demand/supply situation at the current price levels. Supply must exceed demand for a top to be confirmed, so volume and spread should decline as the price moves closer to BC's resistance zone. An ST could appear as an upthrust (UT), in which case the price goes above the resistance indicated by the BC and perhaps other STs before abruptly reversing to close below resistance. Price frequently tests the TR's lower boundary after a UT.
SOW—sign of weakness:
A downtrend to (or just barely past) the TR's lower border, typically accompanied by an increase in spread and volume, is an indication of weakness (SOW). The AR and the initial SOW(s) point to a shift in the stock's price movement, with supply now in control.
Last point of supply, or LPSY:
A weak rally on a tight spread following a test of support on a SOW indicates that the market is having significant difficulties advancing. Strong supply, low demand, or both may be to blame for this market's inability to recover. Before markdowns start in earnest, LPSYs signify the end of the demand cycle and the final distribution waves from large operators.

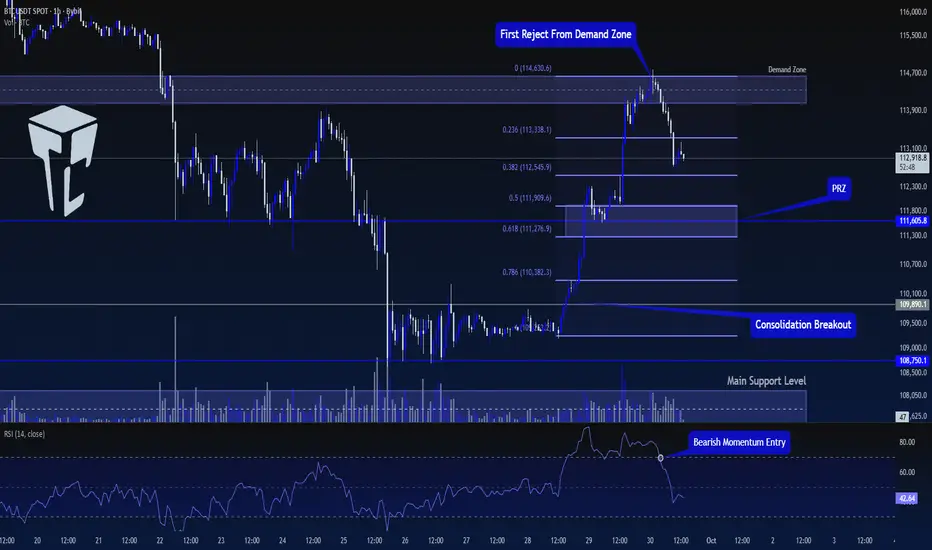
Daily Bitcoin Signal: Sell Now , target 110,500Bitcoin is currently showing signs of strength as it tests the key resistance level around 113,000.
A confirmed 1H candle breakout this zone could trigger fresh bearish momentum, opening the door for lower targets in the short term.
My Personal Long Setup
Entry : Sell Now from current Price 112,900
🎯 Target 1: 111,900
🎯 Target 2: 110,600
❌ Stop-loss: 115,500
👍 Don’t forget to boost this trading idea if you found it helpful,
and follow me for more daily crypto insights and trade signals.
⚠️ Please note:
This is not financial advice – I’m only sharing my personal trades.
Always do your own research before taking action.
Best of luck 🌹

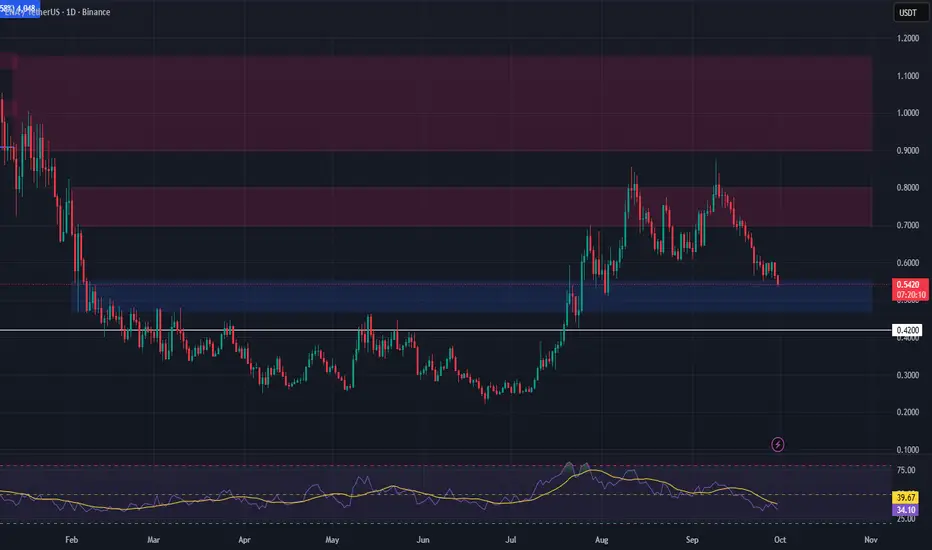
ENA – Breakout & Retest: Setup in PlayAfter a 6-month accumulation phase, ENA has finally shown strength with a clean breakout from the range, shifting its market structure. This rally marks what could be the first impulse wave in a broader trend reversal. Price action is now retesting the previous range high as support, which often serves as a springboard for continuation.
🔍 Retest in Progress
The current zone between $0.47–$0.55 is key. This level previously acted as resistance and is now showing signs of holding as support — a classic bullish retest. If buyers step in here, the setup aligns well with a Wave 2 retracement before another leg up.
🎯 Trade Idea
Entry Zone: $0.47 – $0.55 (Support zone)
Take Profit Targets:
→ TP1: $0.70 – $0.80
→ TP2: $0.90 – $1.15
Stop Loss: Daily close below $0.42 (structure invalidation)
✅ Clean structure, healthy retest, and clear invalidation make this setup attractive for trend continuation — but as always, wait for confirmation and manage risk.
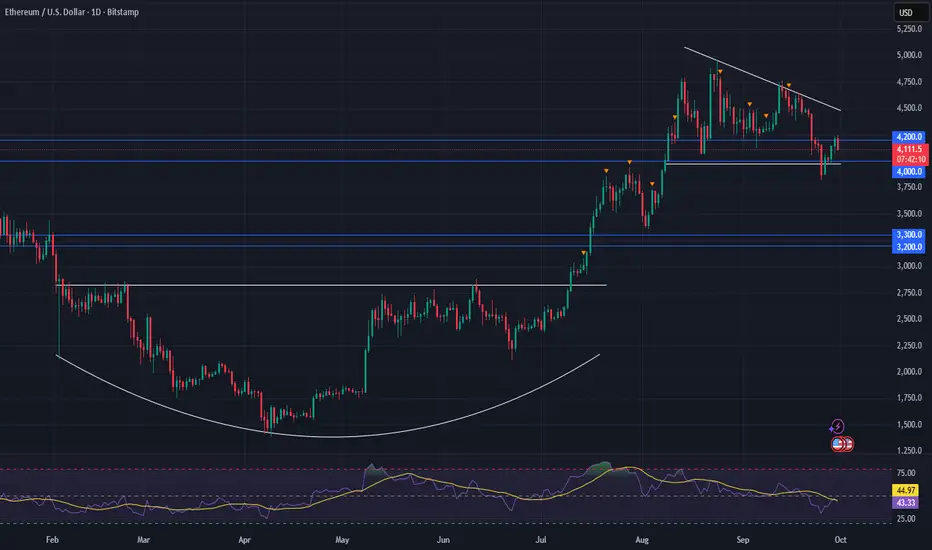
Ethereum Outlook – Key Levels in Play Amid Market JittersAfter a turbulent week across the crypto space—with volatility even bleeding into traditional equities—it's clear just how fragile sentiment remains. We’re seeing the usual overreactions: every minor selloff triggers calls that the bull market is over, despite the broader structure holding up... for now.
🔍 ETH Technical Outlook
Ethereum is retesting a major support zone between 4000–4200. This area has acted as a springboard before, but if it breaks decisively, it could flip to resistance, introducing more headwinds for bullish momentum.
Still, this may be shaping up as another dip-buying opportunity—if macro conditions remain stable and Bitcoin doesn't lead a broader breakdown.
🧱 Next Support Zone
If 4000–4200 doesn’t hold, the next major support zone is 3200–3300. This aligns with previous accumulation levels and would likely draw interest from larger buyers if price gravitates down there.
🔺 Chart Pattern Watch: Triangle Shift
We’ve been tracking a triangle formation, which now appears to be shifting from a symmetrical triangle to a descending triangle—a change in tone, but not yet a deal-breaker for the bulls.
The longer-term target remains intact: we’re still eyeing the 5700–5800 range, assuming structural support zones continue to hold and volume confirms any breakout.
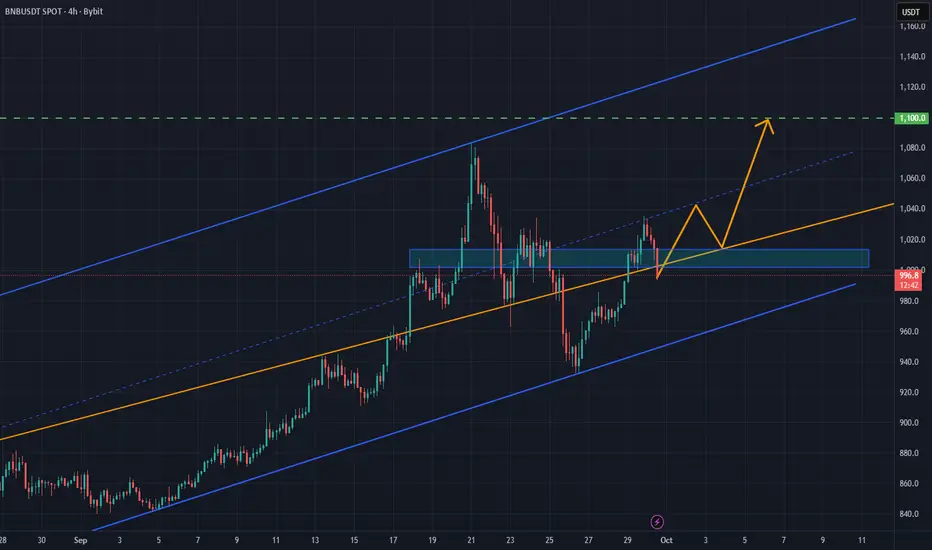
BNB/USDT: Bullish Structure Intact Above Key Support ZoneBNB/USDT is trading within a well-defined upward channel following a corrective pullback from its all-time high near 1,080. The recent rebound from a higher low around 1,000 confirms the presence of structural support and sustained bullish momentum.
If buyers continue to defend the 1,000–1,010 zone, price could push toward the 1,100+ pullback area. As long as the channel trendline remains intact, the broader outlook supports a bullish continuation toward higher levels.
TradeCityPro | Bitcoin Daily Analysis #184👋 Welcome to TradeCity Pro!
Let's go over the Bitcoin analysis. Yesterday, the price got rejected from a resistance zone, and today, it has started a corrective downward movement. Let's review the market together.
⏳ 1-Hour Timeframe
Yesterday, after the price reached the resistance zone, I mentioned that if the RSI exits the Overbuy zone, we could take profits.
📊 This is exactly what happened. After the price was rejected from the zone, the RSI moved out of the Overbuy zone and started heading downward.
⭐ Currently, the price correction has continued towards the 0.382 Fibonacci level. The trading volume during this correction has not decreased, which indicates that sellers are still active in the market, and their trading volume is not significantly lower than buyers.
🎲 If the price continues its correction and the volume increases at the same rate, the likelihood of a trend reversal and the start of a new downward trend becomes much higher. However, if the volume decreases simultaneously with the correction, the range between the 0.5 and 0.618 Fibonacci levels will be a very important support zone, and the price could find support there.
🔼 For a long position, the trigger we currently have is the breakout of the resistance zone. If we wait for the price to touch this zone a few more times, we can draw the exact numbers for the range and open our position upon its breakout.
⚡️ For a short position, it's better to wait and get confirmation of a bearish trend before looking for triggers. We will confirm the bearish trend if the selling volume increases and lower highs and lows are made.
❌ Disclaimer ❌
Trading futures is highly risky and dangerous. If you're not an expert, these triggers may not be suitable for you. You should first learn risk and capital management. You can also use the educational content from this channel.
Finally, these triggers reflect my personal opinions on price action, and the market may move completely against this analysis. So, do your own research before opening any position.
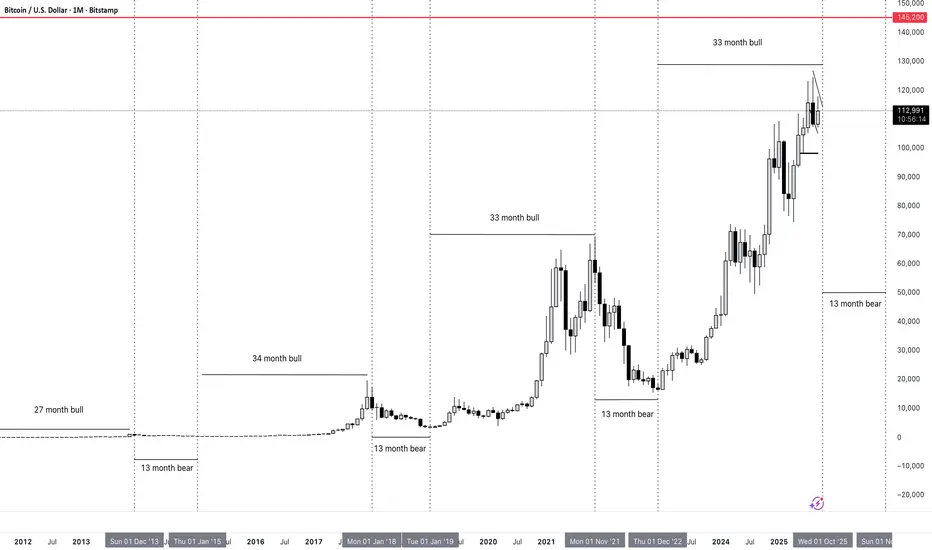
Bitcoin completing fourth bull cyclebtcusd completing 4th bull cycle fo 33 months.
Oct is the last month of this bull cycle
after it will retrace for 13 month as it did before 3 time
Oct target is around 145k
TradeCityPro | LINK Coin Testing Key Resistance👋 Welcome to TradeCity Pro!
In this analysis, I'll be reviewing the LINK coin. It’s one of the popular RWA crypto projects with a market cap of 14.56 billion dollars, ranked 13th on CoinMarketCap.
⏳ 1-Hour Timeframe
In the 1-hour timeframe, after a downward movement, this coin has formed a large range box with the upper boundary at $22 and the lower boundary at $20.02.
📊 Currently, after getting support at the lower boundary of the box, the price has moved upwards in two legs toward the $22 level and has now reached it.
🧩 The price has reacted to this level before, and it has significant strength. It can be viewed as a Maker Seller zone.
✨ We can confirm the bullish trend of LINK after breaking this level. Before breaking this level, opening a position is risky, and if we want to open a position, we need to pay close attention to risk and capital management.
✅ In the upward movement towards the top of the box, a divergence has formed in the RSI. We can confirm this divergence activation by breaking the 40.91 level in the RSI. For the price itself, we can confirm a bearish trend by stabilizing below 21.25.
📉 For a short scalp position, we can enter with the break of 21.25. But be cautious, as this position is very risky, and if you open it, make sure to take profit with low-risk-to-reward ratios because the market momentum is not fully in our favor, and the chance of volatile fluctuations is high.
🔔 For a long position, the best trigger is the breakout of the top of the box. If the price touches this level multiple times, we can find an accurate trigger for the breakout, and in subsequent touches, we can enter with the breakout.
📝 Final Thoughts
Stay calm, trade wisely, and let's capture the market's best opportunities!
This analysis reflects our opinions and is not financial advice.
Share your thoughts in the comments, and don’t forget to share this analysis with your friends! ❤️
