SHIB Swing Long Idea - MemecoinSHIB Swing Long Idea
📊 Market Sentiment
Market sentiment remains strongly bullish as the FED is expected to deliver a 0.25% rate cut, with speculation building for a possible 0.5% cut in September. Monetary policy shifts are being driven by both inflation trends and weakening labor market data. The latest August and September job reports were soft, signaling that the economy is cooling rapidly. This environment continues to fuel expectations for a major bullish run in the weeks ahead.
📈 Technical Analysis
Price ran the HTF liquidity and got rejection from there.
Price created the Daily Demand after the run which confirms the price wants to seek higher liquidity.
Price made its first retest to Daily Demand and got rejection there, indicating that Daily Demand is valid and likely to send price higher.
Price is also supported by the Weekly Demand zone.
📌 Game Plan
1. Price to come back and retest the Weekly Demand zone at 0.0125$
2. Price to come back and retest the Daily Demand zone at 0.0117$
3. Price to run Equal Lows (purple line – 0.0117$) and close back above
4. Price to hit the 0.75 most discounted range level
🎯 Setup Trigger
I will be looking for a 4H break of structure before entering any position.
📋 Trade Management
Stoploss: Below the 4H swing low responsible for BOS
Targets:
• TP1: 0.0149$
• TP2: 0.016$
• TP3: 0.0175$
💬 Like, follow, and comment if you find this setup valuable!
⚠️ Disclaimer: This content is for informational and educational purposes only and does not constitute financial, investment, or trading advice. Always do your own research before making any financial decisions.
Cryptomarket

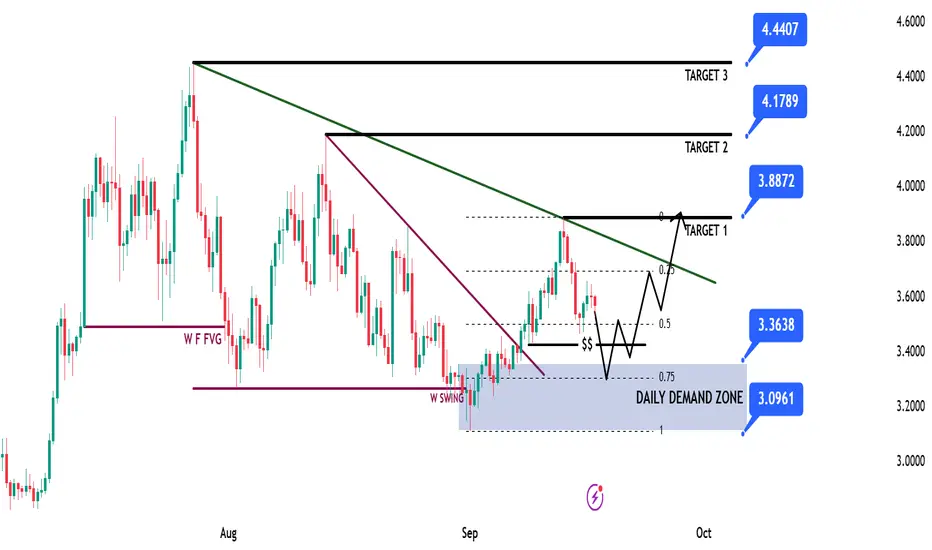
SUI Game Plan - Suinetwork📊 Market Sentiment
Market sentiment remains strongly bullish as the FED is expected to deliver a 0.25% rate cut, with speculation building for a possible 0.5% cut in September. Monetary policy shifts are being driven by both inflation trends and weakening labor market data. The latest August and September job reports were soft, signaling that the economy is cooling rapidly. This environment continues to fuel expectations for a major bullish run in the weeks ahead.
📈 Technical Analysis
Price is on HTF bullish trend so we will be looking only long setups.
Price ran HTF liquidity and closed above then broke the market on daily-weekly timeframe, creating the Daily Demand Zone.
Moreover, price broke the bearish trendline and closed above, giving strong upward momentum. Now price is retracing back into the Daily Demand Zone.
📌 Game Plan
1-Price to hit back to Daily Demand Zone
2-Price to hit possibly 0.75 max discount range zone. If not, I’ll still enter with LTF confirmation.
🎯 Setup Trigger
4H break of structure after hitting 3.36$ level. I won’t enter unless I see the 4H BOS.
📋 Trade Management
Stoploss: Below 4H swing low responsible for BOS
Targets:
TP1: 3.88$
TP2: 4.17$
TP3: 4.44$
💬 Like, follow, and comment if you find this setup valuable!
⚠️ Disclaimer: This content is for informational and educational purposes only and does not constitute financial, investment, or trading advice. Always DYOR before making any financial decisions.
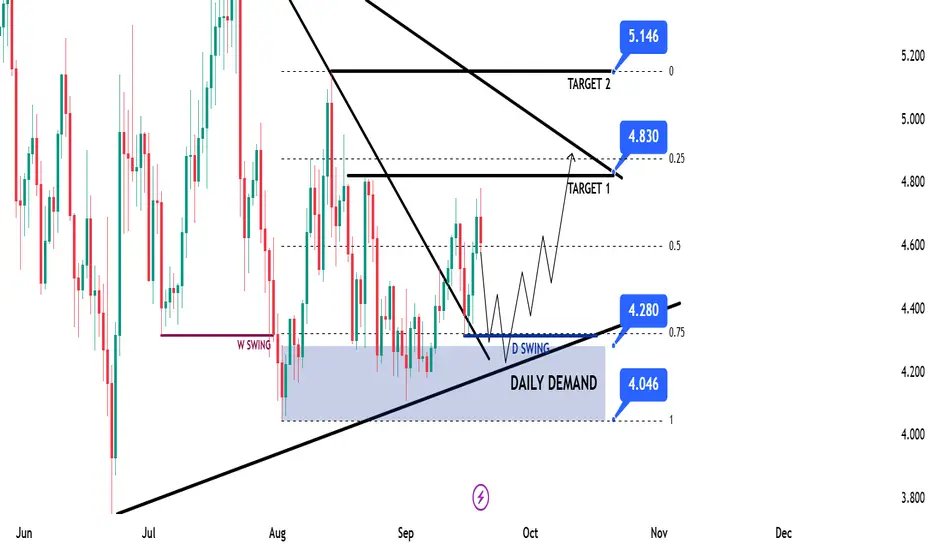
APT Swing Long IdeaAPT Swing Long Idea
📊 Market Sentiment
FED has resumed its rate-cutting cycle, starting with a 0.25% cut in September, with two more 0.25% cuts expected in the coming months. Additionally, institutional liquidity inflows have accelerated as the U.S. officially adopts crypto as part of its reserves. While inflation remains elevated, the weakening labor market is forcing the FED to ease, driving more capital into risk-on assets.
📈 Technical Analysis
Price ran HTF liquidity and got rejected, creating a strong Daily Demand Zone.
This zone is further supported by the HTF bullish trendline, so I will only look for longs as long as the HTF bullish structure holds.
📌 Game Plan
1-Price to revisit and reprice the Daily Demand Zone at $4.28
2-Price to run and close above $4.30 daily swing liquidity (engineered liquidity for expansion higher)
3-Price to reprice into the 0.75 max discount of the range
4-Possible retest of the HTF bullish trendline
🎯 Setup Trigger
I’ll be looking for a 12H break of structure before entering long.
📋 Trade Management
Stoploss: 12H swing low that breaks the market
Targets:
• TP1: $4.83
• TP2: $5.14
💬 Like, follow, and comment if you find this setup valuable!
⚠️ Disclaimer: This content is for informational and educational purposes only and does not constitute financial, investment, or trading advice. Always DYOR before making any financial decisions.
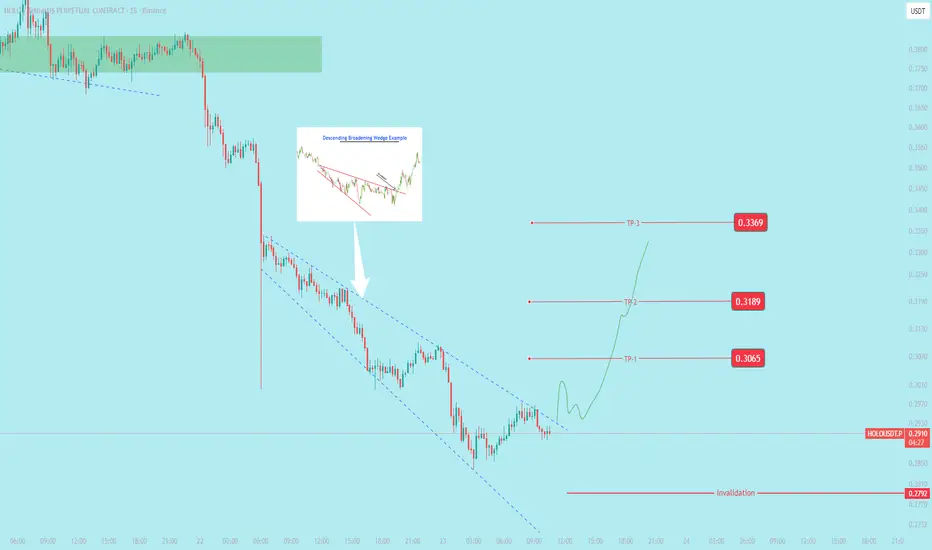
$holoworld forming descending broadening wedge pattern; await bbullish chart pattern that signals a potential reversal of a downtrend. Unlike a normal wedge, where trendlines converge, the trendlines in a broadening wedge diverge, showing increased volatility
$AVNT Perform of a bullish pennantWhat the pattern indicates
A bullish pennant is a continuation pattern, meaning that it signals the market is likely to continue its current trend after a brief pause. It suggests that the buying pressure that caused the initial rally is gathering strength for another push upward.
How to trade the pattern
Traders can use this pattern to plan entry and exit points:
Entry: A common strategy is to enter a long position (buy) when the price breaks above the pennant's resistance trendline.
Profit target: The typical price target for the trade is determined by measuring the height of the initial flagpole and projecting that distance from the breakout point.
Stop-loss: To manage risk, a stop-loss order can be placed just below the pennant's lower trendline.

Could we see a bullish reversal from here?The Bitcoin (BTC/USD) is reacting off the pivot which is a pullback support that aligns with the 61.8% Fibonacci retracement and could rise to the 1st resistance which acts as a pullback resistance.
Pivot: 111,273.51
1st Support: 109,394.29
1st Resistance: 114,518.42
Disclaimer:
The above opinions given constitute general market commentary, and do not constitute the opinion or advice of IC Markets or any form of personal or investment advice.
Any opinions, news, research, analyses, prices, other information, or links to third-party sites contained on this website are provided on an "as-is" basis, are intended only to be informative, is not an advice nor a recommendation, nor research, or a record of our trading prices, or an offer of, or solicitation for a transaction in any financial instrument and thus should not be treated as such. The information provided does not involve any specific investment objectives, financial situation and needs of any specific person who may receive it. Please be aware, that past performance is not a reliable indicator of future performance and/or results. Past Performance or Forward-looking scenarios based upon the reasonable beliefs of the third-party provider are not a guarantee of future performance. Actual results may differ materially from those anticipated in forward-looking or past performance statements. IC Markets makes no representation or warranty and assumes no liability as to the accuracy or completeness of the information provided, nor any loss arising from any investment based on a recommendation, forecast or any information supplied by any third-party.

Bitcoin backtesting WEEKLY 20MABitcoin recently backtested the weekly 20MA, and with the bullish divergence on the weekly RSI, it could reach a new all-time high of about $135,000.

THE UNEXPECTED BREAK OF PROM TO $15Prom is one of the coins that did show before a signal of fall, but unexpectedly, a whale trend did save it, with now the possibility that it can break to $15 in the coming time.

ENA 1D analysisEna got rejected from recent previous resistance. Possible buying range is given on chart. Let's see if it can break soon.

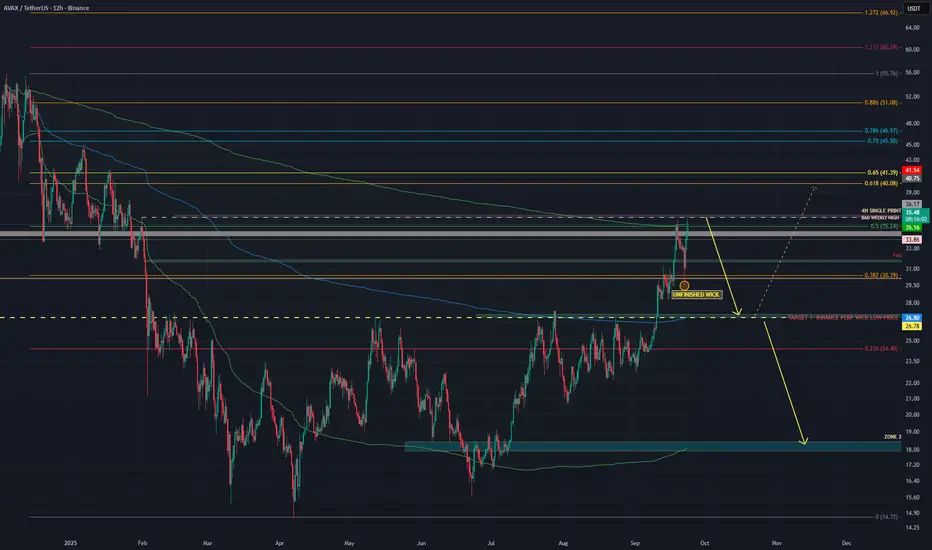
$AVAX – ARBITRAGE DUMP DETECTED – READY TO BALANCE?Traders,
Last time we nailed CRYPTOCAP:AVAX from 22.80 → 30 → 35 almost pixel perfect.
Now the setup may be flipping. Let’s break it down with the THETA method:
🔹 Imbalances
Perps vs Spot: Binance Perps wicked down to $26.83, Spot hasn’t filled it yet → liquidity gap below.
Market Profile: Price swept the 31 Jan weekly high, a “bad high” (too much excess, unstable).
Oscillators: RSI shows bearish divergences on multiple timeframes → momentum fading.
Context: Market is repairing imbalance above to build liquidity, which can later be used to fix the unfinished business below.
🔹 Order Flow & AVWAP
Aggressive buyers stepping in at $34–36 (since CME open).
Price is now trading at the upper band of the HTF AVWAP, a zone that often signals overextension vs volume-weighted positioning.
The unfilled wick imbalance at $26.83 is also the price of the HTF AVWAP itself (blue line) → strong confluence for a revisit.
If downside continues, those aggressive buyers will be trapped, fueling the move lower.
Next key check: At $26.90, we need to watch data + price action to define if AVAX stabilizes there or breaks further.
✅ Conclusion
Price is showing signs of distribution at the HTF AVWAP upper band. Liquidity is being absorbed above, and the confluence of the wick imbalance + HTF AVWAP at $26.83 strengthens the case for a downside move.
👉 Key takeaway: Longs chasing into AVWAP extremes = potentially trapped buyers, with the market likely rotating back to $26.90–26.83 before the next decision point.
AVAXUSDT ; Did the buyers arrive?Hello friends
You see that the price has created a channel and broken it and has had a good growth and has created a channel again that buyers support. Still, and considering the sharp movement that we are seeing, it seems that the price can break this channel.
If it fails to break the channel in the first encounter, it can move to the specified support areas and then grow.
If the channel is broken, the price can move to the specified targets.
*Trade safely with us*

WLFI (SIGNAL)
Hello friends
Regarding the price flooring in the specified support area and the creation of higher floors, it can be said that if the specified resistance is broken, the price can move to the specified targets.
*Trade safely with us*

Bitcoin Dominance at Channel Resistance – Reversal Ahead?Bitcoin dominance (BTC.D) has reached the top of its ascending channel around 58.5%, which is acting as a strong resistance.
🔹 Main Scenario (More Likely):
A rejection from this resistance zone could trigger a pullback toward 57.8% – 58%, giving some relief to altcoins in the short term.
🔹 Alternative Scenario:
If BTC.D manages to break and hold above 58.5%, the next upside target would be around 59%.
⚖️ Conclusion:
• Current levels are risky for further upside.
• Probability of a correction is higher.
• This setup may favor altcoin outperformance if dominance drops.

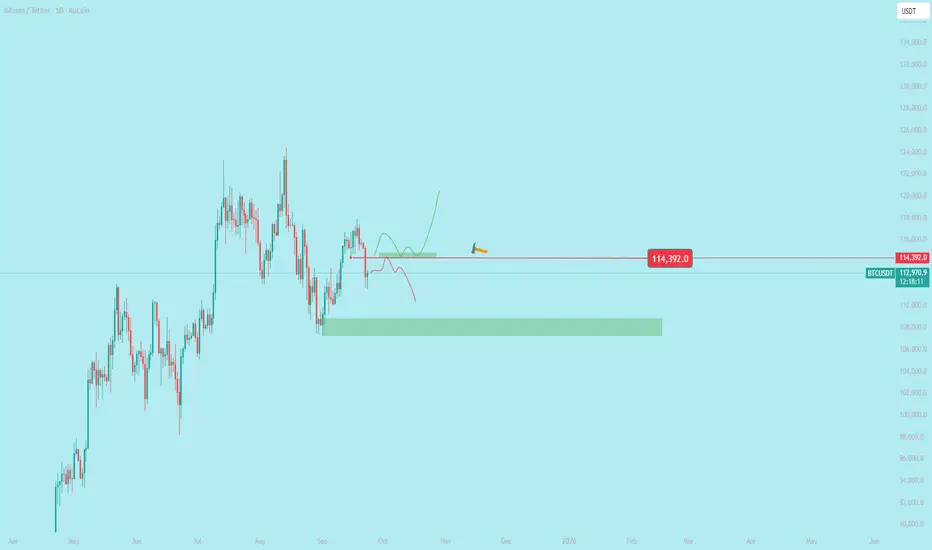
Bitcoin Price Update and Trading Plan
**Current Situation**:
Bitcoin (BTC) is at a critical level, and its weekly closing price is highly important for traders. A strong bounce from the current price, followed by a weekly close above **$114,500**, is needed to confirm bullish momentum. This could lead to a significant upward move, allowing traders to capitalize on the next strong price movement. However, BTC should first retest its key support level, which it previously broke, to confirm its strength. If rejected at this support, a downward move toward **$108,000** is possible.
**Trading Plan**:
1. **Bullish Case**:
- **Condition**: If BTC bounces from its current level and closes above **$114,500** on the weekly chart, it signals strong bullish momentum.
- **Action**: Enter a long position targeting higher levels, such as **$117,200-$120,000**.
- **Stop Loss**: Place below **$114,000** to manage risk.
- **Rationale**: A close above **$114,500** confirms support and sets the stage for the next upward move.
2. **Bearish Case**:
- **Condition**: If BTC fails to hold above **$114,500** and breaks below the key support, it may retest the **$108,000-$110,000** zone, where it previously found support.
- **Action**: Wait for confirmation of a bounce at **$108,000** for a potential long trade, or short if rejection occurs at this level.
- **Stop Loss**: For shorts, place above **$115,000** to limit risk.
- **Target**: A downward move could target **$108,000**, with further declines possible if selling pressure increases.
- **Rationale**: A rejection at **$108,000** after breaking key support indicates bearish pressure, potentially leading to a deeper correction.
**Key Levels to Monitor**:
- **Support**: **$114,500** (immediate), **$108,000-$110,000** (major support zone).
- **Resistance**: **$117,200-$118,000** (immediate), **$120,000+** (next target).
- **Weekly Close**: The weekly close on September 28, 2025, will determine whether BTC confirms bullish strength or signals a deeper pullback.
**Conclusion**:
For a bullish outlook, BTC needs to close above **$114,500** to confirm a bounce and target higher levels. If it fails, traders should prepare for a potential retest of **$108,000**, where a rejection could lead to further downside. Monitor price action closely and use tight risk management due to BTC’s volatility.
*Disclaimer*: Cryptocurrency trading is highly risky. This is not financial advice; always conduct your own research before trading.
BTCUSD 1H: Short Opportunity on Support Break & EMA Confluence🟨 Main Trend:
Based on the EMA indicator, the BINANCE:BTCUSD market is currently in a short-term downtrend. Pullbacks have only reached the EMA before facing renewed selling pressure.
🟨 Accumulation & Support Zone:
The price is moving sideways around a key support zone at ~112,800 – 113,200. This area has repeatedly attracted buying interest but has not yet produced a clear breakout.
🟨 Entry & Risk Management:
A valid short entry can be considered once a candle closes below the support zone, in confluence with the EMA continuing to slope downward.
Stop-loss should be placed above the EMA zone or the nearest resistance.
🟨 Targets:
Potential downside extension toward deeper support levels around 110,000 – 109,000.
🟨 Scenarios to Watch:
Bearish continuation (primary scenario): Wait for a support break and confirmation with a closing candle.
Alternative scenario 2: If the price breaks out above resistance, wait for confirmation that an uptrend is forming before looking for long opportunities.

BTCUSD H4 | Bullish reversalBitcoin (BTC/USD) has bounced off the buy entry at 111,672.42, which is a pullback support that is slightly above the 61.8% and the 78.6% Fibonacci retracement and could rise to the upside.
Stop loss is at 109,341.87, which is a pullback support.
Take profit is at 115,035.84, which is a pullback resistance that aligns with the 50% Fibonacci retracement.
High Risk Investment Warning
Trading Forex/CFDs on margin carries a high level of risk and may not be suitable for all investors. Leverage can work against you.
Stratos Markets Limited (tradu.com ):
CFDs are complex instruments and come with a high risk of losing money rapidly due to leverage. 65% of retail investor accounts lose money when trading CFDs with this provider. You should consider whether you understand how CFDs work and whether you can afford to take the high risk of losing your money.
Stratos Europe Ltd (tradu.com ):
CFDs are complex instruments and come with a high risk of losing money rapidly due to leverage. 66% of retail investor accounts lose money when trading CFDs with this provider. You should consider whether you understand how CFDs work and whether you can afford to take the high risk of losing your money.
Stratos Global LLC (tradu.com ):
Losses can exceed deposits.
Please be advised that the information presented on TradingView is provided to Tradu (‘Company’, ‘we’) by a third-party provider (‘TFA Global Pte Ltd’). Please be reminded that you are solely responsible for the trading decisions on your account. There is a very high degree of risk involved in trading. Any information and/or content is intended entirely for research, educational and informational purposes only and does not constitute investment or consultation advice or investment strategy. The information is not tailored to the investment needs of any specific person and therefore does not involve a consideration of any of the investment objectives, financial situation or needs of any viewer that may receive it. Kindly also note that past performance is not a reliable indicator of future results. Actual results may differ materially from those anticipated in forward-looking or past performance statements. We assume no liability as to the accuracy or completeness of any of the information and/or content provided herein and the Company cannot be held responsible for any omission, mistake nor for any loss or damage including without limitation to any loss of profit which may arise from reliance on any information supplied by TFA Global Pte Ltd.
The speaker(s) is neither an employee, agent nor representative of Tradu and is therefore acting independently. The opinions given are their own, constitute general market commentary, and do not constitute the opinion or advice of Tradu or any form of personal or investment advice. Tradu neither endorses nor guarantees offerings of third-party speakers, nor is Tradu responsible for the content, veracity or opinions of third-party speakers, presenters or participants.

DOTUSD H4 | Bearish reversal off major resistanceDOT/USD is rising towards the sell entry, which acts as an overlap resistance that aligns with the 23.6% Fibonacci retracement and could potentially reverse to the downside from this level.
Sell entry is at 4.007, which is an overlap resistance that lines up with the 23.6% Fibonacci retracement.
Stop loss is at 4.255, which is a pullback resistance that lines up with the 50% Fibonacci retracement.
Take profit is at 3.527, a pullback support that is slightly above the 161.8% Fibonacci extension.
High Risk Investment Warning
Trading Forex/CFDs on margin carries a high level of risk and may not be suitable for all investors. Leverage can work against you.
Stratos Markets Limited (tradu.com ):
CFDs are complex instruments and come with a high risk of losing money rapidly due to leverage. 65% of retail investor accounts lose money when trading CFDs with this provider. You should consider whether you understand how CFDs work and whether you can afford to take the high risk of losing your money.
Stratos Europe Ltd (tradu.com ):
CFDs are complex instruments and come with a high risk of losing money rapidly due to leverage. 66% of retail investor accounts lose money when trading CFDs with this provider. You should consider whether you understand how CFDs work and whether you can afford to take the high risk of losing your money.
Stratos Global LLC (tradu.com ):
Losses can exceed deposits.
Please be advised that the information presented on TradingView is provided to Tradu (‘Company’, ‘we’) by a third-party provider (‘TFA Global Pte Ltd’). Please be reminded that you are solely responsible for the trading decisions on your account. There is a very high degree of risk involved in trading. Any information and/or content is intended entirely for research, educational and informational purposes only and does not constitute investment or consultation advice or investment strategy. The information is not tailored to the investment needs of any specific person and therefore does not involve a consideration of any of the investment objectives, financial situation or needs of any viewer that may receive it. Kindly also note that past performance is not a reliable indicator of future results. Actual results may differ materially from those anticipated in forward-looking or past performance statements. We assume no liability as to the accuracy or completeness of any of the information and/or content provided herein and the Company cannot be held responsible for any omission, mistake nor for any loss or damage including without limitation to any loss of profit which may arise from reliance on any information supplied by TFA Global Pte Ltd.
The speaker(s) is neither an employee, agent nor representative of Tradu and is therefore acting independently. The opinions given are their own, constitute general market commentary, and do not constitute the opinion or advice of Tradu or any form of personal or investment advice. Tradu neither endorses nor guarantees offerings of third-party speakers, nor is Tradu responsible for the content, veracity or opinions of third-party speakers, presenters or participants.

SOLUSD H4 | Bearish dropSOL/USD is rising towards the sell entry which is a pullback resistance and could reverse from this level to the downside.
Sell entry is at 230.926, which is a pullback resistance.
Stop loss is at 250.04, which is a swing high resistance.
Take profit is at 201, which is a pullback support that is slightly below the 61.8% Fibonacci retracement.
High Risk Investment Warning
Trading Forex/CFDs on margin carries a high level of risk and may not be suitable for all investors. Leverage can work against you.
Stratos Markets Limited (tradu.com ):
CFDs are complex instruments and come with a high risk of losing money rapidly due to leverage. 65% of retail investor accounts lose money when trading CFDs with this provider. You should consider whether you understand how CFDs work and whether you can afford to take the high risk of losing your money.
Stratos Europe Ltd (tradu.com ):
CFDs are complex instruments and come with a high risk of losing money rapidly due to leverage. 66% of retail investor accounts lose money when trading CFDs with this provider. You should consider whether you understand how CFDs work and whether you can afford to take the high risk of losing your money.
Stratos Global LLC (tradu.com ):
Losses can exceed deposits.
Please be advised that the information presented on TradingView is provided to Tradu (‘Company’, ‘we’) by a third-party provider (‘TFA Global Pte Ltd’). Please be reminded that you are solely responsible for the trading decisions on your account. There is a very high degree of risk involved in trading. Any information and/or content is intended entirely for research, educational and informational purposes only and does not constitute investment or consultation advice or investment strategy. The information is not tailored to the investment needs of any specific person and therefore does not involve a consideration of any of the investment objectives, financial situation or needs of any viewer that may receive it. Kindly also note that past performance is not a reliable indicator of future results. Actual results may differ materially from those anticipated in forward-looking or past performance statements. We assume no liability as to the accuracy or completeness of any of the information and/or content provided herein and the Company cannot be held responsible for any omission, mistake nor for any loss or damage including without limitation to any loss of profit which may arise from reliance on any information supplied by TFA Global Pte Ltd.
The speaker(s) is neither an employee, agent nor representative of Tradu and is therefore acting independently. The opinions given are their own, constitute general market commentary, and do not constitute the opinion or advice of Tradu or any form of personal or investment advice. Tradu neither endorses nor guarantees offerings of third-party speakers, nor is Tradu responsible for the content, veracity or opinions of third-party speakers, presenters or participants.

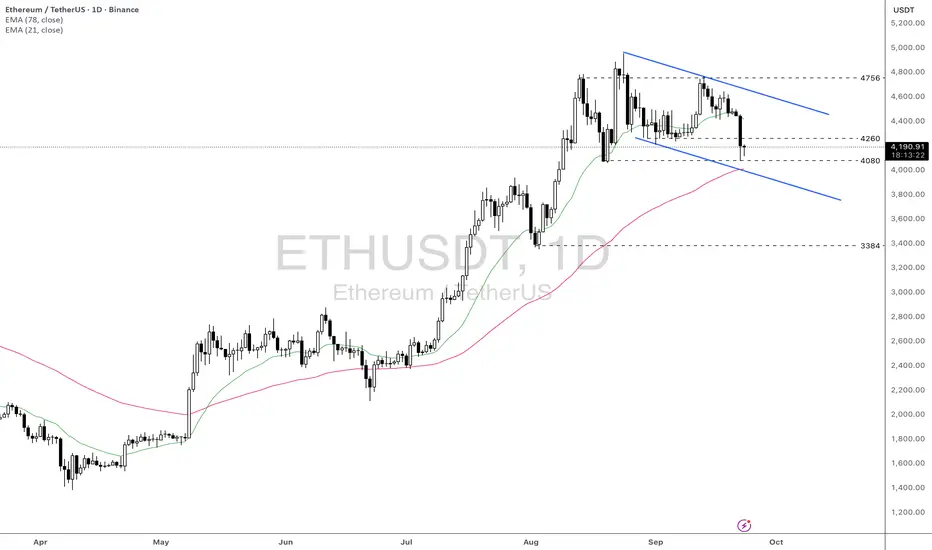
ETH this week: stabilization after liquidations and ETF flows inFundamental approach
- ETH prices slipped this week amid a broad crypto pullback following a weekend wave of leveraged liquidations and profit-taking, even as prior spot ETF inflows and easing Fed policy supported risk appetite earlier in the week. Sentiment was volatile as traders digested mixed ETF flow signals and macro easing after the Fed's rate cut.
- The main impacting factors included a reported $1.5B in crypto long liquidations, which are pressuring majors. ETH prices posted their weakest two-day stretch since late Aug as risk unwound into Monday's session. Offsetting factors were mid-Sep net inflows into US spot ETH ETFs, led by BlackRock's product, and growing anticipation for Dec's Fusaka upgrade aimed at scaling Layer 2 data capacity.
- In the near term, ETH could stabilize if ETF flows remain favorable and macro conditions stay supportive; however, further deleveraging and data-sensitive risk sentiment could keep swings elevated. Upcoming catalysts include continued daily ETF flow prints, developer communications around the Fusaka timeline, and features that may influence medium-term adoption.
Technical approach:
- ETHUSD is forming a lower high and lower low pattern within the defined range of 4080-4756. The price is awaiting a clear breakout to determine the upcoming trend.
- If ETHUSD breaks below the support at 4080, EMA78, and the descending channel's lower bound, the price may retest the following support at 3384.
- On the contrary, closing above 4260 may help ETH prices gain momentum to retest the descending channel's upper bound.
Analysis by: Dat Tong, Senior Financial Markets Strategist at Exness
DOGEUSD H4 | Bullish bounce offBased on the H4 chart analysis, we can see that the price has bounced off the buy entry which is a pullback support that aligns wiht hte 78.6% Fibonacci retracement and could rise to the upside.
Buy entry is at 0.22383, which is a pullback support that aligns with the 78.6% Fibonacci retracement.
Stop loss is at 0.2053, which is a pullback support.
Take profit is at 0.25819, which is a pullback resistance that aligns with the 61.8% Fibonacci retracement.
High Risk Investment Warning
Trading Forex/CFDs on margin carries a high level of risk and may not be suitable for all investors. Leverage can work against you.
Stratos Markets Limited (tradu.com ):
CFDs are complex instruments and come with a high risk of losing money rapidly due to leverage. 65% of retail investor accounts lose money when trading CFDs with this provider. You should consider whether you understand how CFDs work and whether you can afford to take the high risk of losing your money.
Stratos Europe Ltd (tradu.com ):
CFDs are complex instruments and come with a high risk of losing money rapidly due to leverage. 66% of retail investor accounts lose money when trading CFDs with this provider. You should consider whether you understand how CFDs work and whether you can afford to take the high risk of losing your money.
Stratos Global LLC (tradu.com ):
Losses can exceed deposits.
Please be advised that the information presented on TradingView is provided to Tradu (‘Company’, ‘we’) by a third-party provider (‘TFA Global Pte Ltd’). Please be reminded that you are solely responsible for the trading decisions on your account. There is a very high degree of risk involved in trading. Any information and/or content is intended entirely for research, educational and informational purposes only and does not constitute investment or consultation advice or investment strategy. The information is not tailored to the investment needs of any specific person and therefore does not involve a consideration of any of the investment objectives, financial situation or needs of any viewer that may receive it. Kindly also note that past performance is not a reliable indicator of future results. Actual results may differ materially from those anticipated in forward-looking or past performance statements. We assume no liability as to the accuracy or completeness of any of the information and/or content provided herein and the Company cannot be held responsible for any omission, mistake nor for any loss or damage including without limitation to any loss of profit which may arise from reliance on any information supplied by TFA Global Pte Ltd.
The speaker(s) is neither an employee, agent nor representative of Tradu and is therefore acting independently. The opinions given are their own, constitute general market commentary, and do not constitute the opinion or advice of Tradu or any form of personal or investment advice. Tradu neither endorses nor guarantees offerings of third-party speakers, nor is Tradu responsible for the content, veracity or opinions of third-party speakers, presenters or participants.

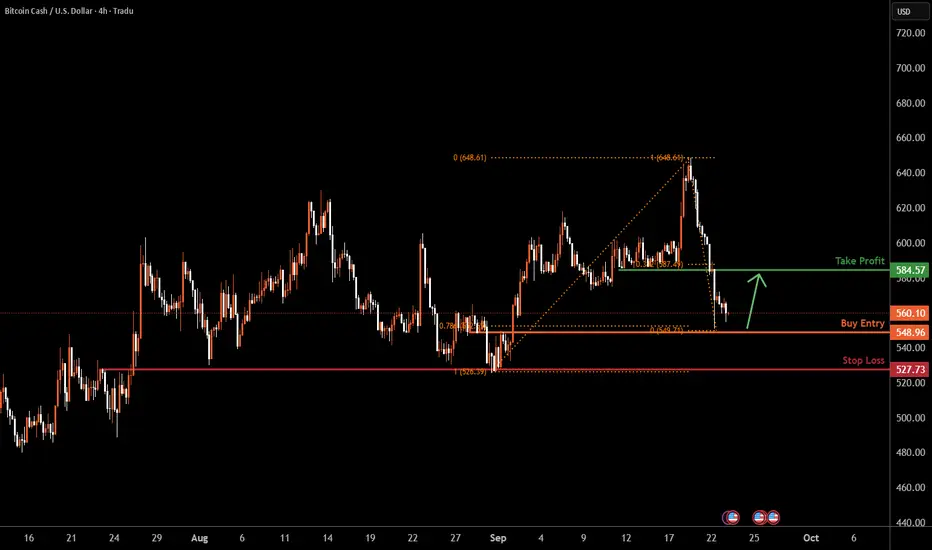
BCHUSD H4 | Bullish reversalBCH/USD is falling towards the buy entry which is a pullback support that lines up with the 78.6% Fibonacci retracement and oculd bounce from this level to the take profit.
Buy entry is at 548.20, which is a pullback support that lines up with the 78.6% Fibonacci retracement.
Stop loss is at 527.73, which is an overlap support.
Take profit is at 584.57, which is a pullback resistance that aligns with the 38.2% Fibonacci retracement.
High Risk Investment Warning
Trading Forex/CFDs on margin carries a high level of risk and may not be suitable for all investors. Leverage can work against you.
Stratos Markets Limited (tradu.com ):
CFDs are complex instruments and come with a high risk of losing money rapidly due to leverage. 65% of retail investor accounts lose money when trading CFDs with this provider. You should consider whether you understand how CFDs work and whether you can afford to take the high risk of losing your money.
Stratos Europe Ltd (tradu.com ):
CFDs are complex instruments and come with a high risk of losing money rapidly due to leverage. 66% of retail investor accounts lose money when trading CFDs with this provider. You should consider whether you understand how CFDs work and whether you can afford to take the high risk of losing your money.
Stratos Global LLC (tradu.com ):
Losses can exceed deposits.
Please be advised that the information presented on TradingView is provided to Tradu (‘Company’, ‘we’) by a third-party provider (‘TFA Global Pte Ltd’). Please be reminded that you are solely responsible for the trading decisions on your account. There is a very high degree of risk involved in trading. Any information and/or content is intended entirely for research, educational and informational purposes only and does not constitute investment or consultation advice or investment strategy. The information is not tailored to the investment needs of any specific person and therefore does not involve a consideration of any of the investment objectives, financial situation or needs of any viewer that may receive it. Kindly also note that past performance is not a reliable indicator of future results. Actual results may differ materially from those anticipated in forward-looking or past performance statements. We assume no liability as to the accuracy or completeness of any of the information and/or content provided herein and the Company cannot be held responsible for any omission, mistake nor for any loss or damage including without limitation to any loss of profit which may arise from reliance on any information supplied by TFA Global Pte Ltd.
The speaker(s) is neither an employee, agent nor representative of Tradu and is therefore acting independently. The opinions given are their own, constitute general market commentary, and do not constitute the opinion or advice of Tradu or any form of personal or investment advice. Tradu neither endorses nor guarantees offerings of third-party speakers, nor is Tradu responsible for the content, veracity or opinions of third-party speakers, presenters or participants.
BTCUSDTHello Traders! 👋
What are your thoughts on BITCOIN?
Bitcoin appears to be moving within a descending channel. Upon reaching the upper boundary of the channel, which coincided with the major resistance zone at 117,000 – 120,000 USDT (and the 61.8% Fibonacci retracement ), the price entered a corrective move.
The short-term ascending trendline has already been broken.
As long as the price stays below 118,000 – 120,000, the correction is likely to continue.
Despite the short-term selling pressure, the medium-term trend remains bullish.
The ongoing correction could serve as a healthy pullback before the larger uptrend resumes.
Don’t forget to like and share your thoughts in the comments! ❤️

Bitcoin Long Trade Signal, Buying with the Whales at 110KI noticed large buy orders from market whales and strong buying momentum accumulating around the 110,000 level.
The current drop supports demand accumulation at the same area.
I will enter a long position from 110,000 with quick targets.
Here’s my personal trade plan:
✅ Entry 1: Buy from 110K
✅ Entry 2: If price dips, add another buy at 107K
🎯 Target 1: 111,100
🎯 Target 2: 112,000
Stop-loss: For both entries, a daily close below 107K
Please note:
This is not financial advice – I’m only sharing my personal trades.
Always do your own research before taking action.
👍 Don’t forget to like if you found this useful, and feel free to follow me for more analysis of this kind.
Best of luck 🌹
