WULF risks of mid-term top being Price has reached a key macro resistance level, which could substantially increase selling pressure and push the market into at least a mid-term correction below November 2024 highs. As long as price continues to close below October highs, I favor the view that a mid-term top is likely in place.
While a final push higher into the resistance zone remains plausible — especially if price holds above the 21dEMA — maintaining a high level of caution with new or existing long exposure is strongly adv
Cryptomining
HIVE on mid-term top and more downside potentialPrice has reached the key macro resistance outlined as a potential extension in the October update and continues to act in line with the reversal hypothesis mentioned in the last week review.
While price might already be completing the initial wave of decline, any recovery attempts should be approached as a bounce within a developing corrective phase, with the next macro support zone at 4–2.5 levels.
Chart:
Previously:
• On downside reversal (Oct 13) and on possible upside extensions (Oct
BITF - when structure starts to matter more than headlinesBitfarms Ltd. is a publicly traded Bitcoin mining company operating large scale mining facilities across North and South America. The core business is cryptocurrency mining with a strong focus on energy efficiency, infrastructure ownership, and geographic diversification across Canada, the United States, Argentina, and Paraguay.
From a fundamental perspective as of late 2025, Bitfarms remains a growth focused company still in its investment phase. The upcoming Q4 2025 report is expected to sho
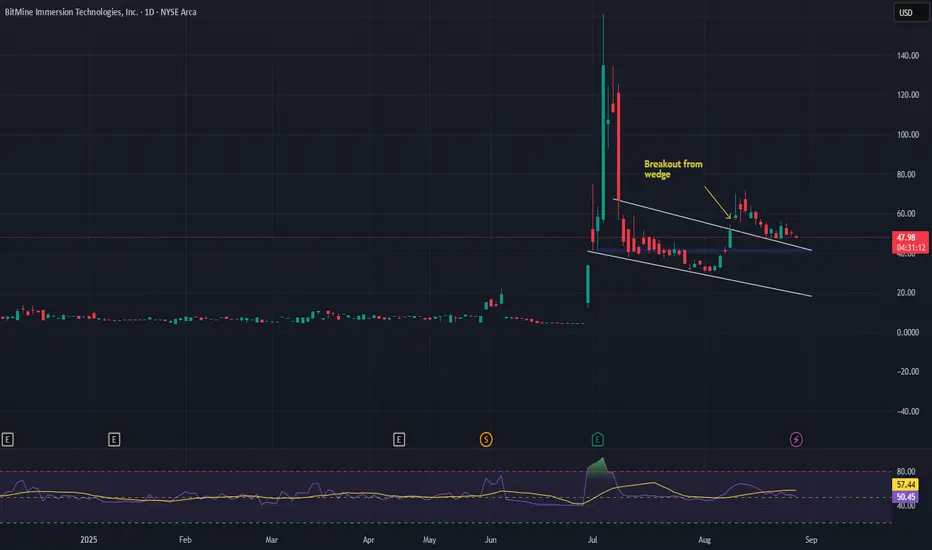
BitMine Immersion Technologies (BMNR) AnalysisCompany Overview:
BitMine Immersion Technologies AMEX:BMNR is a crypto mining innovator leveraging immersion cooling to maximize mining efficiency and lower operational costs. Recently, the firm has pivoted from Bitcoin mining to Ethereum accumulation, positioning itself as a long-term Ethereum value play.
Strategic Drivers:
Ethereum Focus: Building exposure to the fast-growing DeFi, smart contract, and developer ecosystem.
Treasury Growth: Ethereum holdings have surged in value with ETH ri
BLong
Hut 8 Corp (HUT) From Miner to Digital Infrastructure PowerhouseCompany Overview:
Hut 8 NASDAQ:HUT is transforming into a next-gen digital infrastructure leader, blending Bitcoin mining, AI compute, and cloud services for diversified, long-term growth.
Key Catalysts:
Major Operational Upgrades ⛏️
79% QoQ jump in deployed hashrate and 37% fleet efficiency gain in Q1 2025.
Positions HUT for cost-effective BTC production as crypto markets rebound.
Massive Bitcoin Reserves ₿
10,264 BTC on balance sheet (~$847M as of Mar 31, 2025).
Acts as a digital asse
$MARA still going to go under $10Even though NASDAQ:MARA has bounced, we're still not completed with the correction.
So far, we've only completed 4/5 waves down and the last leg should take us to the supports below.
I think the most likely target is at $7.64, but other two support levels possible as well.
Let's see where we end up.
Those levels will mark a great buying opportunity for the future.
Bullish Pennant breakout for Hive! $39 CAD price target.Hive appears to be trading in multiple bullish patterns.
Noticeably the stock is creating higher lows and higher highs forming a bullish pennant & a crude bull flag pattern.
Hive has bounced off the upward sloping support of the pattern 4-5 times, displaying strong support for the bulls.
Considering Hive is correlated to the price of Bitcoin & Ethereum we should see some volatile price action over the upcoming months heading into the US presidential elections..
Bullish cross on the KST
Also
H
MARA Potential Bounce Off Bullish Ascending Triangle MARA has tested the lower bounds of the ascending triangle before, so a bounce next week has potential. If one occurs a test of the upward bound of the triangle is likely, with a breakout also in speculation as the upward bound has been tested many times already. But, if a bounce occurs and then immediately retraces and breaks through the lower bound, I think MARA will continue on the downtrend.
BTCUSD Bitcoin / US Dollar Bearish Side Money Heist PlanMy Dear Robbers / Traders,
This is our master plan to Heist BTCUSD Market based on Thief Trading style Technical Analysis.. kindly please follow the plan I have mentioned in the chart. Our target is Green Zone that is High risk Dangerous level MA act as a Dynamic Support & Order Block, So the Market is oversold / Consolidation / Trend Reversal at the level Bullish Robbers / Traders gain the strength. Be safe and be careful and Be rich.
Note: Day traders & Scalpers If you've got a lot of money yo
$RIOT, more downside before upside?I know everyone is bullish BTC and miners here, but the charts still don't look great even after the bounce.
I think what's most likely from here is that we sweep the lows before getting a sustained trend higher.
We're rejecting off resistance here at $12. I think this is likely to lead to a strong move to the downside. We have a ton of gaps to fill from the move up, and supports haven't been retested from the initial leg up in February.
Most likely scenario is to find support in that $6.69-
$HUT - Another view, target $16-17?Updating my past idea with some lower targets. It looks like we're in a large downtrend channel.
We've just tested the bottom of the downtrend channel and now have turned up. I think the next big move is to test the top of the channel around the $16-17 target.
I don't think we'll break the channel because 3rd tests rarely break. 4th+ tests break the channel.
Therefore, I think if we get up to the top of the channel, that's a great place to sell.
I think this move will happen somewhat quickl
$HUT send it to $28-$30Updating timing from my last analysis on $HUT.
Still think we get a monster move higher from here that happens over the next month. It did go lower than I expected, but I've been using the move down to accumulate even more calls.
As you can see from the chart, we've formed a large falling wedge, should it break to the upside we should see a big move higher.
My calls are stacked between 1/19, 1/26, 2/02 and 2/09 w/ most of the contracts expiring 1/26 and most are between $13-15 strikes.
My gu
$HUT run it back turbo targeting $30ish rangeI've been very bullish on $HUT. Made a good amount of money on the move up and derisked at $17 thinking there would be a pullback. Now we've had a capitulation move down and have now reentered my position w/ both spot and calls (I've averaged in all morning between $12.90-$13.70).
Thinking we're going to see a massive move up over the next 1-3 weeks targeting the $30 range.
Let's see how it plays out.
$MARA down again to $6-8 before up?Similar to my thoughts on NASDAQ:RIOT , I also think NASDAQ:MARA likely has another leg down before starting the uptrend higher.
I think most likely scenario is price tests the $10.43 level once more, rejects, and falls to retest the lows.
After retesting the lows in the gray box, then we start the real rally higher.
If this idea does play out, my current thinking is that the rally higher would be quick in early December hitting between $16-20 as the final move higher.
This idea lower wou
$MARA capitulation, then strong bounce to new yearly highs?I've been tracking the movement of NASDAQ:MARA very closely over the past few weeks as I think the setup will end up being one of the best possible trades over the next month or two.
I originally turned bullish on it a bit too early last week, but the chart has become clearer over the past week or so as it hasn't been able to gain any strength.
From here, I think we'll see a capitulation in price over the next week going into the lower support area (buy zone).
From there, I think we'll see
$RIOT, more downside around $8 before higher?As you can see on the chart, NASDAQ:RIOT has formed a rising channel and has broken to the downside and is currently testing the channel as resistance. Should it not be able to make it back into the channel, then my bias leans towards more downside before higher prices.
As of now, I lean towards the lows getting retested or broken and a bottom forming around the $8 region.
After that takes place, then I think NASDAQ:RIOT is primed for a large move higher in which we should see prices go 10
[Watch] MARA versus Bitcoin 5️⃣4️⃣| Year to date 287,15%; RSI 50Year to date ⤴️287,15%
What's going on, Team NASDAQ:MARA
New Month, New Opportunities, New Ideas, New beautiful people to meet...!
Summer 2023 starts now.
Avoid margins, and do not ask for money to buy your shares.
Let's all be better, get a 2nd job and save money so you can invest in this opportunity.
I know there are other mining companies in the US, still Marathon Digital Holdings is my favorite because I think they are making the effort to cut their energy expenses, and that matters th
[Watch] MARA versus Bitcoin 5️⃣2️⃣| How high can MARA pull...?Year-to-date: ⤴️156,70%
What's going on, Team NASDAQ:MARA
Yes, yesterday, the SEC went after Binance, and as usual, it created a new buy opportunity.
You can see how hard they work to kill BITSTAMP:BTCUSD to introduce their ideas.
Sellers seem exhausted, and they come and go...
Today I am sharing Tradingview's Autopattern available for premium members.
I make zero money from this; still, please consider becoming a premium member and using it as a new tool for trading and investing de
[Watch] MARA versus Bitcoin 5️⃣1️⃣| Summer 2023 Idea Year-to-date: ⤴️154,47%
What's going on, Team NASDAQ:MARA ?
Where do I see myself picking that winning trade if I need cash to fund my Summer 2023?
Yes, you got it; Marathon Digital Holdings.
Sellers seem exhausted, and they come and go...
Today I share how I see the indicator called; The Rainbow is adding some excellent levels to our position.
In my next video, I will bring deFran (indicator) back on the screen for us to review the charts.
This is my Demand Zone 7,98$ to 7,66$ per share
[Watch] MARA versus Bitcoin 5️⃣0️⃣| Stan Weinstein 30WMAYear-to-date: ⤴️167,60%
What's going on, Team NASDAQ:MARA ?
Thank you for watching this video, No. 50, the big 50.
Today, I would like to talk about Stan Weinstein 30WMA, which you can use on the weekly chart.
As you can see, Sellers are no longer in control.
They keep selling, but still, someone is buying.
This is my Demand Zone 7,98$ to 7,66$ per share. Those levels are the weekly candle's Open and Low Prices on April 10, 2023.
What does this mean to you? It means I am a buyer at those
[Watch] MARA versus Bitcoin 4️⃣9️⃣| The Rainbow AnalysisWhat's going on, Team NASDAQ:MARA ?
When we have red days, I would like to record the most because it allows me to have more and more conviction.
I went over multiple levels and talked about 30WMA (Stan Weinstein) and The Rainbow, which has no monthly sell activate, which is good for our longs.
This is my Demand Zone 7,98$ to 7,66$ per share. Those levels are the Open Price and Low Price on the weekly candle dated April 10, 2023.
What does this mean to you? It means I am a buyer at those l
[Watch] MARA versus Bitcoin 4️⃣8️⃣| God's Hand Indicator Year-to-date: ⤴️193.02%
What's going on, Team NASDAQ:MARA ?
Today I want to share the newest indicator I am running; God's Hand.
I will share the $NYSE: SPOT findings on the monthly chart and the entries we have so far in 2023 on SKILLING:NASDAQ : MARA
Stay tuned because I will share more of God's Hand on Tradingview.
Enjoy your Saturday, and I talk to you tomorrow.
This is my Demand Zone 7,98$ to 7,66$ per share. Those levels are the Open Price and Low Price on the weekly candle dat