Cardano Price Analysis: Can ADA Deliver a 2x Move From Here?* ADA is sitting right on a major support zone, and traders are starting to watch closely for any early signs that a reversal could be taking shape.
* The chart makes it clear what needs to happen before a 2x move even becomes realistic, not just hopeful.
* On-chain data and market structure aren’t fully aligned yet, which makes this a setup worth monitoring rather than chasing.
When you zoom out and look at what Cardano has been doing lately, it’s pretty clear the market isn’t panicking, even though the ADA price is still stuck inside a broader downtrend.
The ADA price didn’t slide lower in a slow and gentle way. It dropped back toward the bottom of its descending channel with speed, flushing out late longs and cooling off the optimism that had started building during earlier consolidation. That move forced a reset in expectations. But since then, the tone has started to change a bit.
Instead of continuing to sink without any pauses, ADA has begun to stabilize around the low-to-mid $0.30s. This is the first area where selling pressure has clearly slowed after that drop from the middle of the channel. The price isn’t falling apart anymore, and dips into this zone are getting absorbed faster than before.
After cutting through several support levels on the way down, this is the first place where the market looks willing to slow down instead of accelerating lower. It doesn’t mean the bottom is in, but it does indicate the market is starting to digest the move rather than reacting emotionally to it.
Market cap data backs that up. After peaking near $15.4 billion and sliding toward $13.6 billion, Cardano’s valuation has stopped dropping aggressively and has begun moving sideways. Money isn’t rushing out anymore, even if fresh inflows haven’t shown up yet.
So what comes next for Cardano?
The main challenge is still overhead resistance. The ADA price is repeatedly being held back below the level of $0.3966 on the 4-hour chart, where the 100-period SMA is placed. Each attempt at a rebound has so far not managed to get back above there.
Until ADA can break above that zone and hold it, upside moves are better seen as relief rallies, not real trend reversals. The bigger downtrend stays in control as long as price remains capped there and the descending channel keeps guiding price action.
Cryptonews

How High Could ETH Price Go After Breaking the EMA Band?* The ETH price is sitting on a support area that’s quietly doing a lot of work right now.
* Momentum is starting to turn, but ETH still has a big technical hurdle to clear overhead.
* If the price can push through resistance, the whole structure could start to look very different.
Looking at Ethereum right now, the overall vibe feels very different from earlier in the cycle. There’s no panic selling, no sharp breakdowns, and no sense that the market is rushing for the exits.
Instead, the ETH price looks like it’s finding its balance. After defending the $2,700–$2,800 support zone, price has stopped drifting lower and moved into a tighter, sideways range. It’s not exciting price action, which is exactly why many traders overlook it.
Ethereum has been moving within a fairly narrow band. Volume has cooled, momentum has slowed, and things feel quiet. If you’re waiting for a fast breakout, this phase can be frustrating. Nothing dramatic is happening, so attention fades. But this is often the part that matters.
Ethereum isn’t slipping back into its old downtrend. Dips toward support keep attracting buyers, while moves higher stall under resistance. Sellers aren’t pushing aggressively anymore, and buyers aren’t chasing the price either. What’s forming is balance.
That kind of balance usually shows up when a market is adjusting after a structural shift. Trends rarely restart in a straight line. They pause, compress, and test patience before the next move appears.
On-chain data supports that view. Ethereum’s market cap has stayed steady, and network activity is improving. Active addresses and transactions are ticking higher even as price moves sideways, suggesting participation is quietly building underneath.
What’s next for ETH?
For now, structure matters more than hype. As long as the ETH price holds higher support while grinding below the EMA band, the setup stays constructive. Ethereum may look calm, but that calm often comes before a more decisive move.

Post-Rally Consolidation, Awaiting CatalystHello everyone,
Bitcoin is no longer in an expansion phase of the uptrend, but has shifted into a consolidation phase following the recent rally.
From a structural perspective, the medium-term uptrend remains intact. Bitcoin continues to print higher highs and higher lows, with price holding above both the EMA 34 and EMA 89, while these two moving averages are still sloping upward. The key point here is that sellers have not been able to trigger any meaningful breakdown, especially failing to force a clear close below the EMA 89 — the critical dynamic support of the current trend.
After setting a high around the 94,000 area, BTC pulled back and began moving sideways within a relatively tight range around 91,000–92,000. Many interpret this phase as a sign of weakness, but in my view, this behavior looks more like post-trend accumulation rather than distribution. The trading range is narrowing, volume is gradually declining, and each dip toward the EMA 89 is quickly met with buying interest, indicating that defensive capital is still present. A truly weak market would show a decisive break below the EMA 89, followed by aggressive selling on rebounds — and so far, that scenario has not materialized.

Bitcoin Under Pressure - H1-Bearish Flag (10.01.2026)📝 Description 🔍 Setup (Market Structure) COINBASE:BTCUSD
BTC/USDT - Bitcoin is forming a classic Bearish Flag pattern on the H1 timeframe after a strong impulsive sell-off (flagpole). Price is consolidating upward in a tight channel while staying below EMA and Ichimoku cloud resistance, indicating weak bullish momentum and a high-probability continuation to the downside.
📌 Trade Plan - Bearish Bias 📉
Wait for a clear breakdown below the flag support
Aggressive entry: breakdown candle close
Conservative entry: breakdown + pullback (retest of flag support)
📍 Support & Resistance Levels
🔴 1st Support: 88,670
🔴 2nd Support (Measured Move Target): 87,620
🟢 Key Resistance: Bearish flag upper trendline / Cloud resistance
🎯 Target Projection: Height of flagpole applied from breakdown point
#Bitcoin #BTCUSDT #CryptoTrading #BearishFlag #PriceAction #TechnicalAnalysis #CryptoMarket #TradingView #Kabhi_TA_Trading
⚠️ Disclaimer
This analysis is for educational purposes only.
Crypto markets are highly volatile — always use proper risk management and trade with a stop-loss.
💬 Support the Idea 👍 Like if you see the bearish continuation
💬 Comment: Breakdown or Fakeout? 🔁 Share with traders watching Bitcoin

Bitcoin - Waiting for confirmation on weekly candleWe’re at a critical inflection point for Bitcoin. A weekly close above the orange trendline would strongly favor continuation toward $100k. Structurally, this could still be interpreted as a right shoulder within a large weekly head and shoulders formation unless price decisively breaks through resistance. A clean break and close above that level would invalidate the bearish structure and instead signal the potential start of an extreme bull run.
If Bitcoin fails to close above the orange trendline, I expect either downside or extended consolidation before another attempt. At that point, the setup looks weak. Personally, that’s where I would exit rather than sit through uncertainty.

BNB Price Analysis: Is the Next BNB Rally Taking Shape?* The BNB price is sitting in a zone where the next move really matters, with price reacting around major moving averages and previous resistance.
* While short-term charts have shown early signs of improvement, the market is really waiting for confirmation around the $890–$900 area before it can commit.
* According to on-chain data, this looks more like a cooling-off period rather than a breakdown or capitulation.
When you step back and look at BNB, it’s clear the market isn’t in a hurry to make a decision. There’s no panic and no clean breakout either. After running into resistance, the BNB price has slipped into a slow, uncomfortable phase where momentum has cooled and direction is still in the air.
Over the last few sessions, BNB has been hovering around the same area. This kind of price action usually drains attention. Volume dries up, conviction weakens, and the passion in the story fades. It’s not very exciting, but it doesn’t show weakness either; it simply indicates the market is resting on its laurels after the strong movement.
That’s why this stretch matters. The BNB price isn’t breaking down, and buyers are still stepping in on dips. At the same time, rallies keep stalling as price runs into overhead resistance. Sellers aren’t pushing hard, but buyers also haven’t done enough to force a clean break higher. For now, it’s a pause rather than a breakdown.
We’ve seen this before with BNB. In past cycles, we commonly experienced periods of quiet markets following major breakouts. Prices temporarily stalled, momentum decelerated, and the hype died down. Then, once expectations reset, the structure shifted quickly.
On-chain data lines up with that view. BNB’s market cap has eased back slightly from its recent peak, but there are no signs of stress. Network activity surged during the rally and has since cooled, which fits a digestion phase rather than panic selling.
What’s next for BNB?
From here, structure matters more than sentiment. As long as the BNB price holds key support while pressing against resistance, the broader setup stays intact. This phase doesn’t reward impatience, but it’s often where the next meaningful move quietly takes shape.

Bullish retest possible on $NEARBullish retest possible on CBOE:NEAR 🚀
Key support to be maintained for this setup: 1.580 - 1.600$
I remain cautious under 1.840$ daily basis (key resistance weekly).
A breakout above with fresh volume would lead to a huge bull pressure 📈

Bitcoin (D1) - Breaks The Channel - Liquidity Grab Complete ?📝 Description 🔍 Setup (Market Structure) BINANCE:BTCUSDT
Bitcoin was trading inside a well-defined descending channel on the Daily timeframe.
Price has now broken above the channel resistance, showing early signs of trend reversal.
Key confluences:
Multiple support reactions inside the demand zone
Breakout supported by EMA & cloud shift
Strong base formation near higher-timeframe support
Momentum gradually shifting from sellers to buyers
📍 Support & Resistance
🔴 Support Zone: 83,700 – 87,300
🟢 1st Resistance: 107,500
🟢 2nd Resistance: 118,000
#Bitcoin #BTCUSDT #CryptoTrading #PriceAction #ChannelBreakout #SupportResistance #TradingView #Kabhi_TA_Trading
⚠️ Disclaimer
This analysis is for educational purposes only.
Crypto markets are highly volatile — always manage risk and use proper position sizing.
💬 Support the Analysis👍 Like if you trade BTC 💬 Comment: Breakout confirmed or needs retest?

Chainlink (LINK) Price Eyes a Push Toward the Top of Its Channel* The Chainlink price is trading inside a tight channel, with momentum slowly starting to pick up.
* On-chain data indicates steady, real network usage rather than short-term speculation.
* LINK is approaching the top of its channel, a level that could shape the next move.
If you step back and look at what Chainlink has been doing lately, one thing stands out right away: nothing feels rushed. There’s no panic, no aggressive selling, and no breakout mania either. LINK is just moving sideways inside a tight range, and that kind of price action tends to make people tune out because it feels boring.
For a while now, the LINK price has been slowly compressing inside its channel. Every bounce runs into resistance, and every dip finds buyers waiting. It’s the kind of market that feels awkward to trade because nothing follows through. Momentum traders lose interest, and the broader narrative around LINK goes quiet.
That’s exactly why this phase is important. LINK isn’t falling apart. Buyers are clearly defending the $12–$13 area, and sellers haven’t managed to push the price meaningfully lower. At the same time, buyers aren’t quite strong enough yet to break through the top of the channel. The market is paused, not weak.
This setup is nothing new for Chainlink. In past cycles, similar low-volatility stretches showed up near the end of long consolidation periods. Volume dried up, momentum flattened, and the price went nowhere long enough for most people to stop watching. When that happened, LINK often moved once expectations were low and positioning had thinned out.
On-chain data backs this up. Market cap has been creeping higher, active addresses are still rising, and transfer activity looks steady. That points to ongoing network use and gradual positioning, not speculation or large-scale selling.
So what comes next for LINK?
At this point, structure matters more than hype. As long as the LINK price holds its support zone and continues tightening beneath resistance, the setup stays intact. A move toward $14.63 with stronger volume would start putting real pressure on sellers.
Right now, LINK isn’t grabbing headlines. Price is grinding, volatility is low, and excitement is missing. But those quiet phases are often when things start to shift, especially for an asset that tends to move once the market stops paying attention.

!!! URGENT WARNING !!!This is not intended to cause panic, but to provide awareness of a highly probable scenario developing today.
In our latest update, we highlighted liquidity resting near the weekly POC. This area also aligns with the Asia session high and low that have not been swept, as Asian markets have been closed for holidays since December 31. Today marks Asia’s first trading day of 2026.
Over the weekend, additional geopolitical news surfaced involving Venezuela and renewed market interference tied to Donald Trump. The timing of this news, combined with the current technical structure, increases short-term downside risk.
We are seeing a buildup of long exposure following the recent bullish price action, which has been constructive and rewarding for many traders. However, when paired with unswept Asia liquidity and a visible weekly POC below, conditions are present for a temporary liquidity sweep.
There is a high probability of an aggressive downside spike during the Asia open transitioning into London or New York. This would likely be a temporary move designed to rebalance liquidity rather than a trend reversal.
If you are holding long positions, ensure profits are secured and risk is managed appropriately. This is not a guaranteed outcome, but the probability is elevated enough to warrant caution and preparedness.
Regards,
ENTRYLAB

BTC/USDT - Demand Holding Strong (18.12.2025)📝 Description🔹 Market Structure WHITEBIT:BTCUSDT
BTC has formed a clear Double Bottom pattern inside a strong demand / support zone, signaling potential trend exhaustion on the downside. Price respected the support zone multiple times
Momentum is attempting to shift from sellers to buyers. This structure favors a bullish reversal if confirmation holds.
📌 Trade Plan 🟢 Bullish above the support zone
Entry Idea: Buy on pullback / breakout confirmation above trendline
🟢 1st Resistance: 91,900 – 92,000
🟢 2nd Resistance / Target: 94,100 – 94,200
#Bitcoin #BTCUSDT #CryptoTrading #DoubleBottom #PriceAction #SupportResistance #CryptoAnalysis #TradingView #Kabhi_TA_Trading
⚠️ Disclaimer
This analysis is for educational purposes only.
Crypto markets are volatile — always use proper risk management and a stop-loss.
❤️ Support the Work👍 Like if you see the reversal💬 Comment: Bullish or Fakeout? 🔁 Share with your crypto friends

Cardano Price Analysis: ADA Flashes Familiar Signals* ADA is again flashing a bullish divergence on the 3-day chart, a pattern that's preceded solid rallies several times in the past.
* However, the price of Cardano remains near stubborn levels of resistance that may hint that this movement could take some time and won't appear overnight.
* Whether ADA is building a solid base or needs more patience will come down to how price reacts around its most important support and reclaim zones.
When you step back and look at Cardano’s recent price action, one thing stands out. The market isn’t panicking; there’s no rush to sell, no sharp breakdown, and no sense that traders are trying to get out at any cost. Instead, ADA has settled into that uncomfortable middle ground where price just drifts.
For a while now, the ADA price has been hovering around the low-$0.30s. That kind of slow, sideways movement drains attention. Narratives cool off, and conviction fades simply because there’s no action to react to. It’s dull, and that’s often when markets start to matter.
What’s important is that ADA isn’t accelerating lower. Each dip into support tends to find buyers, while every bounce runs into resistance and fades. Sellers aren’t pushing aggressively, but buyers also aren’t ready to take control. The market is paused, not breaking.
This behavior isn’t new for Cardano. In past cycles, similar low-volatility stretches showed up late in consolidation phases. The ADA price went nowhere long enough for many traders to stop paying attention. Then, once positioning was light and expectations were low, structure shifted quickly.
On-chain data supports that view. ADA’s market cap has stayed within a relatively narrow range, and the recent drift hasn’t come with signs of panic. That points more toward digestion than fear.
What’s next for ADA?
What comes next will come down to structure, not sentiment. As long as price holds support in the low-to-mid $0.30s and continues to compress under resistance, the setup stays intact.
ADA isn’t making headlines right now, but this kind of quiet phase often matters more than it looks.

1 hour view (xrp) short-term SHORTHello 🙋♀️🙋♂️👽👻🐮🌍
just a quick idea and possible short available here. price could go much lower because we are in a descending triangle on daily time frame view.
⏬⏬
For now I have my eyes on 💲1.8 as a possible short term target.
This is just an idea, please trade at your own risk
🐶This is a Short term short Idea. The cryptocurrency market is extremely volatile💣
This is not financial advice
🐶
Always have a stop loss ✋🛑💲 set🆗
Any thoughts 💭💡, questions 🙋♀️🙋♂️❓, good 👍, bad👎, happy 😄 or sad 😥, in the comments always welcome.😄
Jazerbay ☯️

Is XRP Price About to Repeat a Familiar Market Pattern?* The XRP price movement has been ranging, mirroring the calm market action that often precedes significant price movements.
* On-chain data indicates that market participants are not leaving the market but rather just losing some excitement, which always calls for attention.
* The $2.10 level remains the boundary level; only a breakout can change the scene.
When you zoom out and look at XRP’s recent price action, it’s clear the market isn’t panicking. There’s no rush to sell and no sharp breakdown. After reaching a recent top, XRP has been settling into a slow sideways trend that is just awkward because there is simply a lack of action.
For the past few weeks, the XRP price has been stuck in a range. That kind of action tends to drain attention. Traders get bored, narratives fade, and conviction slowly slips away.
That’s exactly why this phase matters. The XRP price isn’t accelerating lower. Every dip will attract buyers, while every rally will falter as it reaches the resistance level. Sellers are not pushing, nor are buyers committed to breaking past them. The market is simply in a pause, not in a position to break out.
This pattern is familiar for XRP. In past cycles, similar stretches of low volatility showed up late in consolidation phases. Volume dried up, momentum flattened, and the price went nowhere long enough for most people to stop paying attention. Then, once positioning was light, structure shifted quickly.
On-chain data supports that view. XRP’s market cap has held steady during this range, and network activity hasn’t dropped off sharply. That indicates digestion, not panic.
What’s next for XRP?
From here, what matters is structure, not sentiment. As long as the XRP price continues to hold its lower support zone while compressing beneath resistance, the setup stays intact.
This phase doesn’t reward impatience, but historically, it’s been the kind of environment where XRP has caught traders off guard once attention shifts elsewhere.
Right now, XRP isn’t making headlines. It’s grinding sideways, volatility is low, and excitement is missing. But that quiet behavior is exactly what makes this setup worth watching.

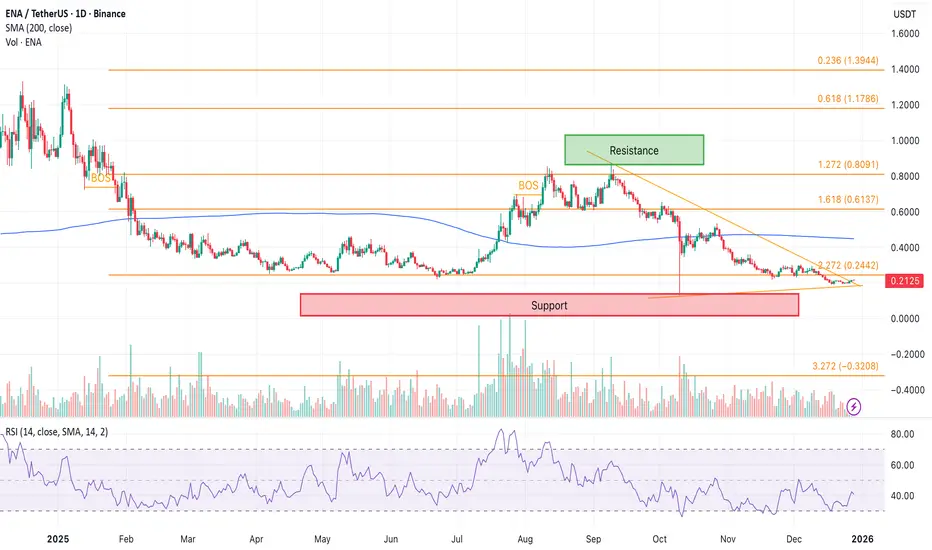
Here’s Where Ethena (ENA) Price Could Go Next* Ethena has just emerged out of a bear flag, but whether it has legs to stand on or if further downside can be expected is now in question.
* The recent bounce has been a weak one, which shows a measure of restraint on the part of traders who are holding out for further signs.
* On-chain data points to stabilization, not strong buying, which keeps ENA in a wait-and-see phase for now.
When you zoom out and look at Ethena’s recent price action, it’s clear the market isn’t panicking anymore, even after a sharp breakdown.
The ENA price didn’t drift lower slowly. Once the bear flag broke, the price dropped fast, falling more than 30% in a short span. That move wiped out late buyers and cooled off the optimism that had built up during consolidation. Since then, though, the tone has shifted. Instead of continuing lower, the market looks like it’s taking a pause.
Over the past few sessions, the ENA price has been hovering around the $0.2000–$0.2100 area. This is the first zone where selling pressure has clearly slowed after the breakdown.
The price isn’t cascading lower anymore, and dips into this range are getting absorbed more quickly. That indicates sellers are losing urgency, even if buyers aren’t stepping in aggressively yet.
That matters. After slicing through multiple support levels during the selloff, this is the first place where the market seems willing to stabilize instead of accelerate lower. It doesn’t mean a bottom is in, but it does suggest the market is digesting the move rather than reacting emotionally.
On-chain data supports that view. ENA’s market cap stopped falling sharply once the price reached this area and has moved mostly sideways since. Capital isn’t rushing out anymore, even if fresh inflows haven’t arrived.
What’s next for Ethena?
The main challenge remains overhead resistance. The ENA price continues to stall near $0.2160 on the daily chart.
Every bounce so far has failed before reclaiming that level, keeping the broader trend intact. Until that zone is cleared and held, upside moves are better seen as relief bounces, not true reversals.
For now, ENA remains in wait-and-see mode. The damage has already been done, and what the market needs next isn’t hope, but confirmation.
LINK/USDT - Bearish Flag Breakdown in Play (17.12.2025)📝 Description🔹 Setup WHITEBIT:LINKUSDT
LINK/USDT formed a classic Bearish Flag pattern after a strong impulsive drop (flagpole).
Price is now consolidating inside a rising channel, but remains below Ichimoku Cloud resistance and key EMAs — signaling weak bullish momentum.
As long as price stays below the flag resistance, bearish continuation remains the higher probability.
📌 Trading Plan
Primary Bias: 🔴 Bearish continuation
Watch for flag breakdown confirmation below minor support
Momentum confirmation = strong bearish candle close
🔴 1st Support: 12.12
🔴 2nd Support (Flag Target): 11.69
Measured Move: Flagpole height projection aligns with lower target
#LINKUSDT #Chainlink #CryptoTrading #BearishFlag #PriceAction #TechnicalAnalysis #CryptoMarket #TradingView #Altcoins #Kabhi_TA_Trading
⚠️ Disclaimer
This analysis is for educational purposes only.
Crypto markets are highly volatile — always use proper risk management and stop-loss.
❤️ Support the Work 👍 Like if this setup makes sense 💬 Comment your LINK view (bullish or bearish? )
🔁 Share to help more traders learn Your support keeps these breakdowns coming 🙌

BTC 4H CHART ROUTE MAPDear Traders,
Please review the BTC 4H chart technical analysis below.
We previously shared our price action analysis, and it remains valid. However, BTC has been moving sideways on the 4H timeframe for nearly three weeks. Recently, price broke the lower trendline, suggesting a potential retest higher—first toward the FVG around 88k, and possibly a further retest at the BPR zone near 91k.
Scenario 1:
If price is rejected from the FVG or BPR levels and the trend line, this would confirm a pullback toward the order block (OB) and demand zone around 83k–84k, clearly marked with a downside arrow.
If this demand zone 83k is broken, price could continue lower toward the next key demand level around 81k and potentially sweep liquidity at 78k.
Scenario 2:
If price successfully breaks above the FVG and BPR levels and trend line, it would confirm a move back into the trendline and zone area, supporting further bullish continuation to collect liquidity around 99k & potentially at 107k zone.
As always, it’s best to buy from dip levels and sell from higher levels. Avoid chasing price at the top, and trade with proper risk management. Our level-based structure typically provides 40–50 pips of reaction, offering solid opportunities for clean entries and exits.
With December 2025 underway and the holiday season approaching, market conditions remain uncertain. There are several red-flag news events on the calendar, so it’s important to keep positions light and tight and avoid choppy market conditions.
Please like, comment, and boost the post.
The Quantum Trading Mastery

TRON Price Analysis: TRX Returns to a Key Zone – What's Next* TRX has actually maintained a strong uptrend line, which has protected it against various dips over the past year.
* Activity on TRX stays stable despite being close to a critical level of support.
* Should the current level of support hold, a move to the region of $0.30-$0.32 is possible.
When you zoom out on TRON’s recent price action, it’s pretty obvious the market isn’t panicking. the TRX price has been drifting lower in a slow, controlled way rather than collapsing
For a while now, the price has been hovering around the $0.27–$0.28 area, which lines up with a rising trendline that’s already stepped in to catch several pullbacks over the past year. Each time TRX has dropped into this zone, selling pressure has eased and buyers have quietly started to show up again.
What makes this area more interesting is that the on-chain data isn’t falling apart along with price. Even as TRX moved sideways, its market cap stayed fairly stable, which indicates money isn’t rushing out of the ecosystem.
Active addresses and transaction activity have cooled off a bit, but they’re still close to normal levels. That usually points to consolidation, not abandonment.
The real challenge is still overhead. The TRX price has tried multiple times to push above the $0.30 area, only to get turned away near the 100-day moving average. Every time that happens, the price drifts back toward support and the range tightens even more.
That’s why this zone matters so much. If TRX can finally break through $0.30 and hold above it, a move into the $0.30–$0.32 range would feel like a natural next step, not a stretch.
If that breakout doesn’t happen, the downside becomes easier to map out. A clean break below the rising trendline would shift attention toward the $0.25 area pretty quickly. Until then, the TRX price is stuck in between, not weak enough to break down, but not strong enough yet to run.
What’s Next for TRON?
CoinCodex’s one-month TRON price target sits around $0.3011, which lines up almost perfectly with this resistance zone. That makes the current level even more important.
As long as TRX keeps holding the $0.27–$0.28 support area, the setup still leans slightly higher. Lose that support, and the mood changes fast.
For now, TRON isn’t offering an easy trade. It’s in wait-and-see mode. And whatever move comes next out of this range is probably going to say a lot more than the slow grind that brought price here.

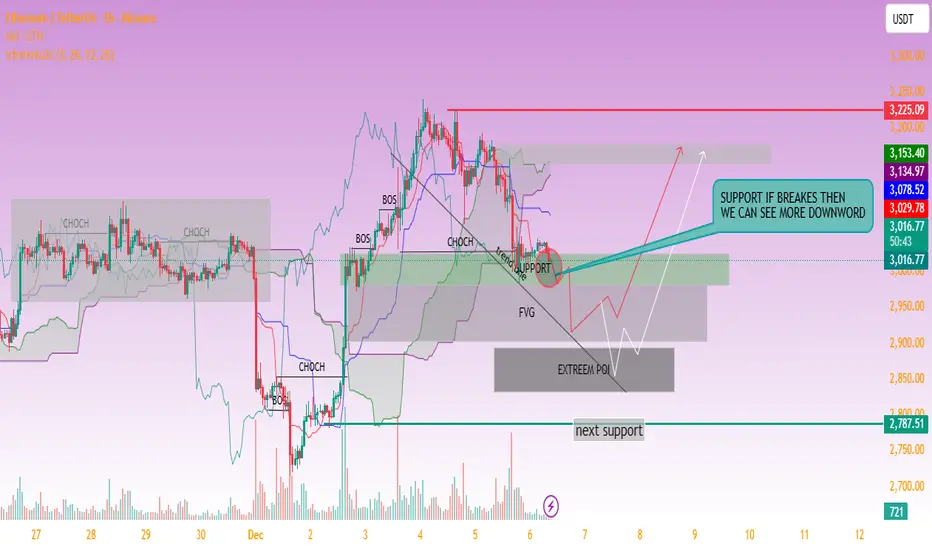
ETH 1H Outlook: Key Support Retest With Potential Downside RiskKey observations:
1. Support Level Under Pressure
ETH is retesting this support multiple times.
The annotation suggests: “SUPPORT IF BREAKS THEN WE CAN SEE MORE DOWNWORD” — meaning a breakdown could trigger further selling.
2. Downside Targets
If the current support fails, the next liquidity zones highlighted are:
FVG (Fair Value Gap) around $2,950–$2,900
Extreme POI zone around $2,880–$2,850
Major support at $2,787 (marked as “next support”).
3. Upside Scenario
If support holds, ETH could bounce toward:
$3,078
$3,134
High resistance around $3,225
4. Market Structure
Several CHoCH and BOS labels indicate mixed structure, showing recent weakness but with potential for rebound if buyers defend support strongly.
XRPUSD – The December Accumulation Play | Smart Money Blueprint Market Context – The Perfect Storm for XRP |
XRP is sitting at one of the most compelling risk/reward setups in crypto right now. After a historic 430% rally from early November that took XRP from $0.50 to a local peak of $2.87 on December 2, 2024, the asset has entered a healthy consolidation phase inside a rising channel between $1.95-$2.00 support and $2.62-$2.80 resistance.
But here's what makes this different from your typical alt pump: the fundamentals are actually there.
The surge followed Donald Trump's election victory in November 2024, which triggered expectations of more favorable US crypto policies. The SEC, under new pro crypto leadership, is nearing a final resolution with Ripple, with the SEC keeping $50 million from the previous $125 million fine and returning the rest. This removes years of regulatory overhang.
Then came the game changer: Ripple launched its RLUSD stable coin globally on December 17, 2024 Business Wire, which is fully backed by U.S. dollar deposits, U.S. government bonds, and cash equivalents Business Wire. This isn't just another stable coin it's enterprise grade infrastructure designed for cross border payments for Ripple's customers starting early next year FXStreet.
Translation? XRP isn't speculation anymore. It's becoming institutional grade infrastructure.
🔎 Technical Framework – Smart Money Channeling Higher
Current State:
Rising channel accumulation phase with whale conviction
Key Liquidity Zones:
🔴 Premium Liquidity Zone (Sell Opportunity):
$2.62 - $2.80 (upper channel resistance + FVG cluster)
This is where retail gets greedy and smart money distributes
Historically, significant spikes in whale to exchange transactions align closely with XRP price peaks.
🟢 Discount Liquidity Zone (BUY ORIGIN):
$1.90 - $2.00 (lower channel support + whale accumulation cluster)
This support zone has consistently triggered rebounds since December 2024
In the last 24 hours alone, large holders accumulated an additional 110 million XRP.
⚖️ Equilibrium / Chop Zone:
$2.20 - $2.40 (mid channel consolidation)
Avoid blind entries here—wait for structural confirmation
🐋 WHALE ACTIVITY – The Real Story
This is where it gets JUICY . While retail panicked during the recent pullback, whales went on an absolute buying spree:
Ripple whales accumulated 160 million XRP worth around $380 million as of December 10, 2024
Large XRP investors added 590 million XRP worth $1.29 billion over a seven day period
Between December 25 and December 28, XRP whales accumulated tokens worth $2.17 billion
Let me repeat that: $2.17 BILLION in THREE DAYS .
CryptoQuant data indicates whale activity over the past month reached unprecedented levels, multiples higher than any other period. This isn't retail FOMO—this is institutional positioning.
Now here's the kicker: Whale order clusters near $1.80-$2.00 USD during 2025 show persistent large holder activity. Every time XRP dips to this zone, whales defend it aggressively. That's your signal.
🚨 Recent Developments – Catalyst Stack
SEC Settlement (MASSIVE)
Ripple will retain $75 million from the SEC settlement, and most importantly, be able to offer XRP tokens to institutional investors. This was the missing piece preventing institutional adoption. Now? Game on.
RLUSD Stablecoin Launch
Ripple announced the launch of RLUSD on December 17, 2024, calling it an "enterprise grade stablecoin built on trust, utility, and compliance". Ripple plans to use both RLUSD and XRP in its cross border payments solution, creating direct utility demand for XRP in institutional payment flows.
Regulatory Tailwinds
With Trump's pro crypto administration and Gary Gensler stepping down, the regulatory environment has flipped 180 degrees. Former CFTC Chair Christopher Giancarlo stated the SEC should drop the Ripple case.
ETF Momentum Building
Franklin Templeton and Canary Capital have filed for XRP ETFs. If approved, we're talking about billions in potential institutional inflows.
🎯 Trade Plans – Precision Entry & Exits
🟢 BUY XRPUSD: $1.90 - $2.00 | SL $1.82
Thesis: Discount origin tap at proven whale accumulation zone + rising channel support = institutional buy zone
Entry Rules (WAIT FOR CONFIRMATION):
Price dips into $1.90-$2.00 zone
Bullish CHoCH (Change of Character) + BOS (Break of Structure) on M15-H1
Strong bullish wick rejection + volume spike
Ideally on FVG fill or after Order Block retest
Targets:
$2.40 - $2.50 (mid-channel retest, quick 20-25% gain)
$2.70 - $2.85 (upper channel resistance, 35-42% gain)
$3.50 - $3.75 (1:1 Fibonacci extension + previous ATH retest, 75-87% gain)
Moonshot: $4.75+ (if RLUSD adoption + ETF approval coincide)
🔴 SELL XRPUSD: $2.65 - $2.80 | SL $2.92
Thesis: Premium liquidity grab at channel top followed by engineered bearish displacement—smart money distribution before reaccumulation
Entry Rules (WAIT FOR CONFIRMATION) :
Price touches $2.65-$2.80 zone
Bearish CHoCH + MSS (Market Structure Shift) + BOS down on M15-H1
Heavy volume spike on exchange inflows (use CryptoQuant whale inflow data)
Entry after FVG fill or Order Block retest post BOS
Targets:
$2.35 - $2.40 (first reaction, mid channel)
$2.10 - $2.15 (deeper retracement)
$1.90 - $2.00 (full channel retest—BUY zone reactivates)
⚠️ Risk Management & Critical Notes
Do NOT trade inside the mid channel chop zone ($2.20-$2.40) without structural confirmation—this is where retail gets chopped to pieces
Sweeps ≠ Trend Entries: If XRP wicks to $2.80 or down to $1.85, that's likely a liquidity grab, NOT a breakout/breakdown
Use tight SL based on structure invalidation—never average down in consolidation
Monitor whale to exchange inflow data (CryptoQuant): Rising whale to exchange flow indicates selling pressure
Given macro volatility (Fed policy, crypto regulation news), consider scaling position size down by 30-50%
📊 The Bottom Line – December's Hidden Gem
XRP is trading at a critical juncture. On one hand, you have:
✅ Record whale accumulation ($3.8B+ since November)
✅ SEC settlement removing regulatory overhang
✅ RLUSD launch creating institutional utility demand
✅ Pro Crypto political environment
✅ Rising channel structure with clear support/resistance
On the other hand:
⚠️ Consolidation phase means volatility is coiling
⚠️ Whales could distribute at channel top ($2.65-$2.80)
⚠️ Bitcoin weakness could drag XRP lower short-term
My Take? This is classic Smart Money accumulation. The $1.75-$2.16 support zone has been defended relentlessly by whales. Every dip gets bought. That's institutional positioning for a leg higher.
Strategy:
If you're not in yet wait for $1.90-$2.00 pullback (high probability long setup)
If you're already in take partial profits at $2.65-$2.80, let the rest ride with a trailing stop
If we break $2.80 with volume add to position, target $3.50-$4.75
This isn't financial advice this is technical + fundamental confluence at its finest.
🔥 Final Word – Why This Time Is Different
XRP has had false starts before. But this time, the stars are actually aligning:
Regulatory clarity ✅
Institutional utility (RLUSD) ✅
Whale conviction ✅
Political tailwinds ✅
Technical setup ✅
The question isn't if XRP moves it's when and how violently.
Position accordingly. Trade the structure. Follow the whales.
Drop a 🚀 if you're accumulating XRP at these levels. Let's ride this wave together.

SOL/USDT: Strong Uptrend – Short-Term Buy Opportunity!We are witnessing an excellent opportunity on the SOL/USDT chart, as Solana (SOL) continues to maintain a strong upward trend. In the context of a gradually stabilizing cryptocurrency market and positive news about Solana's ecosystem development, SOL is entering a significant price increase phase.
Currently, SOL/USDT is trading within an ascending channel and has broken out of the 140.00 support zone . The price is fluctuating around 143.66, close to the 140.00 support, which could see a slight pullback before continuing the upward momentum.
The next target for SOL/USDT in the short term is 155.00, where it might encounter some resistance. However, if the price maintains above 140.00, there is a high probability that SOL could continue its strong upward momentum towards 156.00 and even beyond.
Trading Strategy:
Buy SOL around the 140.00–143.00 range, with a short-term target of 155.00 and 156.00.
Set stop-loss if the price breaks below 139.00, as this is a crucial support level within the current uptrend channel.
In conclusion, SOL/USDT is maintaining a solid uptrend, and with positive signals from both technical indicators and fundamental factors, buying around the support zone is a reasonable strategy to capitalize on the upward movement.

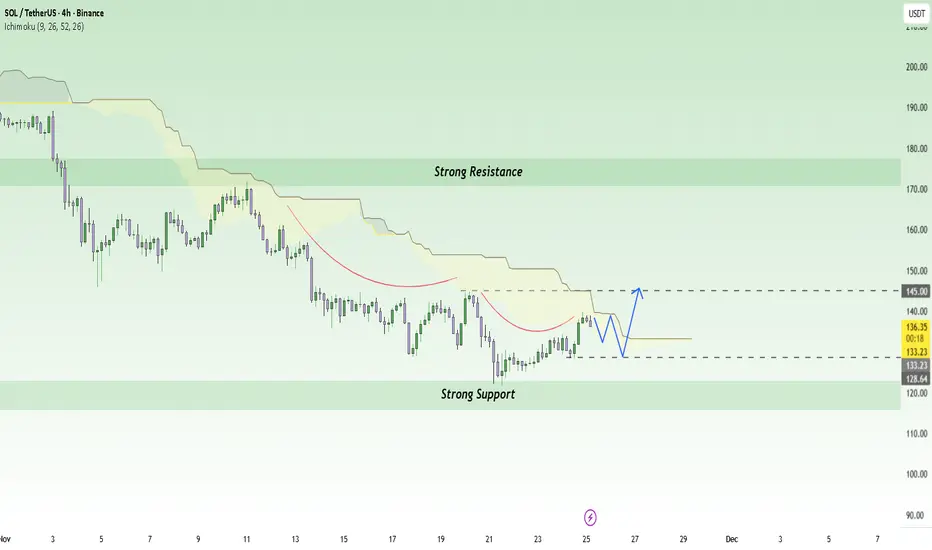
SOL/USDT: Growth Fueled by Inflows and Network ExpansionNews: The Solana spot ETF in the U.S. has seen a significant inflow of capital , with over $476 million USD coming in over 17 consecutive days. At the same time, the Solana network has reported strong revenue growth , reaching around $2.85 billion USD . These factors have bolstered investor confidence in Solana, creating a favorable environment for the upward trend of SOL/USDT.
Chart: On the H4 chart, SOL/USDT is currently trading within a strong uptrend channel , supported by the Ichimoku cloud at 133.23 USD. The price is in the support zone around 128 USD, and there is potential for a strong rebound if it continues to hold above this level. If SOL/USDT maintains this trend, the next target could be 145 USD, where there is strong resistance in the short term.
Outlook: With positive macro factors and a clear technical structure , SOL/USDT could continue its strong uptrend, aiming for the 145 USD resistance level in the near future, as long as the price stays above 128 USD.
XRPUSDT: Strong Downward Pressure – Risk of Falling Toward 2.02Over the past 24 hours, XRP has been under significant pressure as the key support level at 2.15 was broken. This breakdown happened alongside a broader “risk-off” sentiment across the crypto market, combined with Bitcoin’s shift into a bearish structure , adding more downward momentum to XRP.
On the 4H chart, the bearish trend of XRPUSDT is very clear as price remains trapped inside a long-term descending channel . Each rebound has been capped at the channel’s resistance line, showing weak buying pressure while sellers continue to dominate .
The 2.22 zone is now acting as short-term resistance. If price retraces to this level, there is a high probability of renewed selling pressure pushing the market back into the downtrend. The next bearish target lies at 2.02, a historically strong support area that has held price multiple times before.
With a combined view of fundamentals and technicals, the overall trend for XRPUSDT remains bearish. Traders may look for sell setups if price retraces into the 2.20–2.22 region, aiming for the 2.02 target in the short term.
