TRONJust a line I drew while I'm drinking.
TRX is forming a strong ascending structure after a long consolidation. Price has broken above the mid-level resistance and is now retesting it as support. If this level holds, we could see a breakout toward the next resistance zone around 0.4184 USDT, which is a potential 16% move from current levels.
Cryptos

Bitcoin retest of $119k to $124KI think based on trend and a potential inverse head and shoulders we could see higher prices. I think we will see a retest of $119k to $124K, at which point perhaps a pause or a pullback would be in order. Not financial advice. DYOR

Pump doubles from here before year endWith a billion $ in annualized revenue, pumpfun in following in the footsteps of hyperliquid as crypto's second killer app with a massive buyback flywheel. As long as daily revenue does not drop off, this narrative should pick up steam over the next few months. If the team executes it will be crypto's first successful social app into the mainsteam, succeeded where so many projects before failed.

UGLY! FNMA Collapse! We Are in a Recession!The recession began in earnest in late 2022.
Subsequently, in March 2023, Silicone Valley Bank was wiped out; the feds took over and now here we are on the other side of the expansionary cycle. As it currently stands, banks are still sitting on hundreds of billions in unrealized losses.
This can collapse faster than you can blink.
Dump 'em!

LINK/USDT - Bearish Flag PatternBINANCE:LINKUSDT LINK/USDT - Looking for strong bearish, Bearish Flag Pattern Formation
Fundamental Updates :
SEC listing rules to boost crypto ETFs, but no guarantee of inflows: Bitwise
The US Securities and Exchange Commission streamlining the approval process for crypto exchange-traded products (ETPs) may trigger a surge of new offerings, but that doesn’t guarantee their success, a crypto executive warns.
Support by Likes and Comments.
Thank you.

AAVE/USD - Bearish OutlookBINANCE:AAVEUSDT AAVE/USD - Looking for strong bearish around Trendline and Resistance Zone.
Fundamental Update :
Decentralized liquidity protocol Aave announced it had surpassed $60 billion in net deposits, scammers launched a phishing campaign targeting its users through Google Ads, according to security researchers.
Support by Likes and Comments.
Thank you.

ANFIBO | BTCUSD on 09.17.2025 to 09.21.2025 I guess ???Hello guys, Anfibo's here! 👋
I think BITSTAMP:BTCUSD is bullish on the uptrend channel and still holding strong without any break. BTC may retest the support zone of $111.000 and re-reach the resistance levels of $123.000 and $127.000, and possibly up to $135.000.
Here's my setup:
✅ BUY SCALP: 110 - 111, SL 107, TP 122 - 126
❌ SELL SCALP: 126 - 128, SL 130, TP 120 - 114
Wishing my followers all the best <3

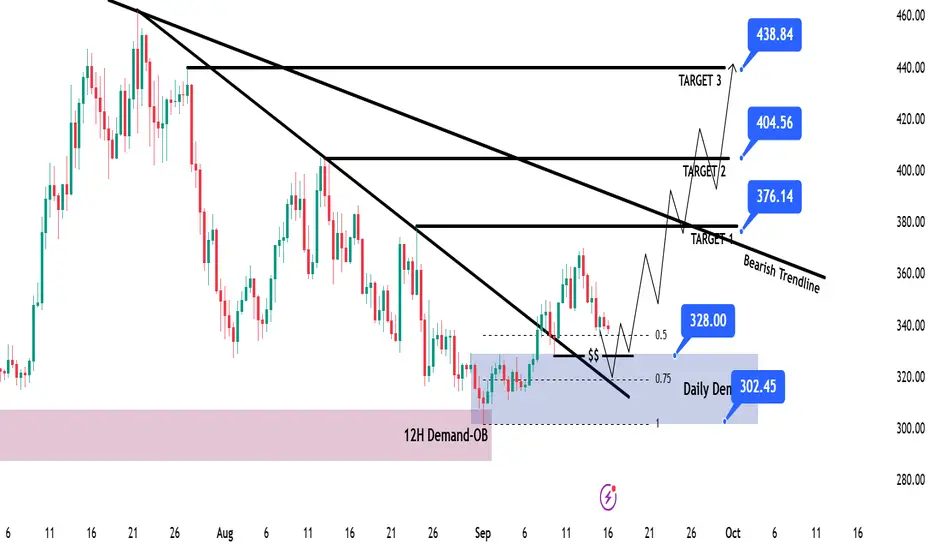
TAO – Bittensor Swing Long IdeaTAO – Bittensor Swing Long Idea
📊 Market Sentiment
Market sentiment remains strongly bullish as the FED is expected to deliver a 0.25% rate cut, with speculation building for a possible 0.5% cut in September. Monetary policy shifts are being driven by both inflation trends and weakening labor market data. The latest August and September job reports were soft, signaling that the economy is cooling rapidly. This environment continues to fuel expectations for a major bullish run in the weeks ahead.
📈 Technical Analysis
• Price rejected the 12H Demand zone and then broke the Daily Structure.
• Price also broke the bearish trendline and closed above, signaling higher targets ahead.
• Current retracement is gathering liquidity to expand higher.
📌 Game Plan
1-Price to hit Daily Demand
2-Price to run liquidity at $328
3-Possible retest of the broken trendline
🎯 Setup Trigger
Looking for a 4H Break of Structure before entering any long position.
📋 Trade Management
Stoploss: Daily close below the Daily Demand zone at $302
Targets:
• TP1: $376
• TP2: $404
• TP3: $438
💬 Like, follow, and comment if you find this setup valuable!
⚠️ Disclaimer: This content is for informational and educational purposes only and does not constitute financial, investment, or trading advice. Always DYOR before making any financial decisions.
Ripple Finished A Correction Within Bullish TrendRipple Finished A Correction Within Bullish Trend, as we see it recovering in an impulsive fashion, which can extend the rally from technical perspective and by Elliott wave model.
Ripple with ticker XRPUSD is waking up from projected support after an ABC correction in wave IV, so bulls could be back, as we see it breaking above channel resistance line and important 3.08 level. So after current short-term pullback, we may see more gains and another push toward all-time highs for wave V, possibly to the 4-5 area.

DOGE/USDT - H4 - Breakout (17.08.2025)The DOGE/USDT pair on the H4 timeframe presents a Potential Buying Opportunity due to a recent Formation of a Breakout Pattern. This suggests a shift in momentum towards the upside and a higher likelihood of further advances in the coming Days.
Possible Long Trade:
Entry: Consider Entering A Long Position around Trendline Of The Pattern.
Target Levels:
1st Resistance – 0.2809
2nd Resistance – 0.3062
🎁 Please hit the like button and
🎁 Leave a comment to support for My Post !
Your likes and comments are incredibly motivating and will encourage me to share more analysis with you.
Best Regards, KABHI_TA_TRADING
Thank you.

LINK - Swing Long OpportunityLINK - Swing Long Opportunity
📊 Market Sentiment
Market sentiment remains strongly bullish as the FED is expected to deliver a 0.25% rate cut, with speculation building for a possible 0.5% cut in September. Monetary policy shifts are being driven by both inflation trends and weakening labor market data. The latest August and September job reports were soft, signaling that the economy is cooling rapidly. This environment continues to fuel expectations for a major bullish run in the weeks ahead.
📈 Technical Analysis
Price is bullish on the HTF, so I will only be interested in long setups.
Price recently broke and closed above the bearish trendline, confirming bullish continuation.
We also saw a break and close above the HTF Key Level, which should now act as support.
Moreover, the 0.5 Fibonacci retracement level aligns perfectly with the HTF Key Level, creating strong confluence for a potential entry.
📌 Game Plan
I will be entering long positions at the 0.5 Fibonacci retracement / HTF Key Level intersection.
🎯 Setup Trigger
Confirmed 15M break of structure before entry.
📋 Trade Management
Stoploss: Daily close below the HTF Key Level or hard stop at $22.64
Targets:
• TP1: $26.03
• TP2: $26.63
• TP3: $27.85
💬 Like, follow, and comment if you find this setup valuable!
⚠️ Disclaimer: This content is for informational and educational purposes only and does not constitute financial, investment, or trading advice. Always do your own research before making any financial decisions.

Range Locked, But Bulls are Knocking on the DoorCRYPTOCAP:ONDO has been moving inside a wide sideways range for months, bouncing between support and resistance.
Recently, it broke above the falling resistance line and is now holding around the mid S/R zone.
If buyers keep control here, price could work its way back toward the upper resistance; losing this level, however, risks a slide toward the lower support zone.
DYOR, NFA
#PEACE
Stay tuned for more updates!

One Push Away From Lift-Off, BB Breakout Setup$BB/USDT is right at a crucial confluence zone where the downtrend resistance and horizontal supply overlap. Buyers have been pushing price higher, but this area is acting as a real test.
If BB manages to break and close above this zone with strength, it could fuel a strong rally as momentum shifts in favor of the bulls. On the other hand, failure to clear this resistance might lead to another rejection, keeping price stuck in the range.
In simple words: this is the make-or-break moment, watch closely for a breakout confirmation before calling the next big move.

EIGEN Breakout Confirmation, Eyes on 2.20+$EIGEN has broken above a key resistance zone, signaling a shift in momentum. The breakout comes after weeks of consolidation with strong support holding at the ascending trendline.
Trade Setup
Entry: Around current breakout levels
Stop Loss: Below 1.33 (trendline support)
Targets:
TP1: 2.20
TP2: 2.86
TP3: 3.78
TP4: 5.27
As long as price holds above the reclaimed zone, the structure favors bulls with upside targets in play.
DYOR, NFA
#PEACE

AIN PREPARING FOR BREAK OUTS One of the best charts in the current market.
Perfect accumulation tells about smart market maker.
Watching out closely , it can blast anytime

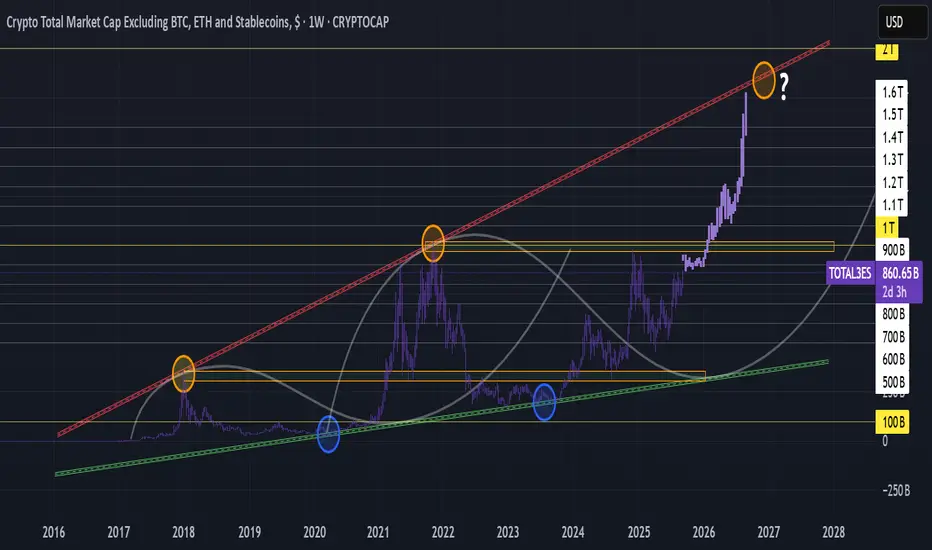
TOTAL3ES (Excluding BTC/ETH/stables) is coiled up."History doesn't repeat itself, but it often rhymes"
$1T is the line in the sand - reclaim & retest and the runway opens.
DXY rolling over (see previous post) = perfect fuel.
Alt season & beyond may almost be here.
Quant Facing the Wall of SellersGETTEX:QNT is still respecting its long-term resistance line. Every time price has tried to break above it, sellers have stepped in, keeping the structure bearish.
Right now, QNT is holding above a key zone that has acted as strong support in the past. If buyers can defend this level and push back toward resistance, we could see another test of the upper line.
In short: support is holding, resistance is heavy, the real move comes only if QNT can finally break through that long-term resistance line.
DYOR, NFA
Stay tuned for more update!

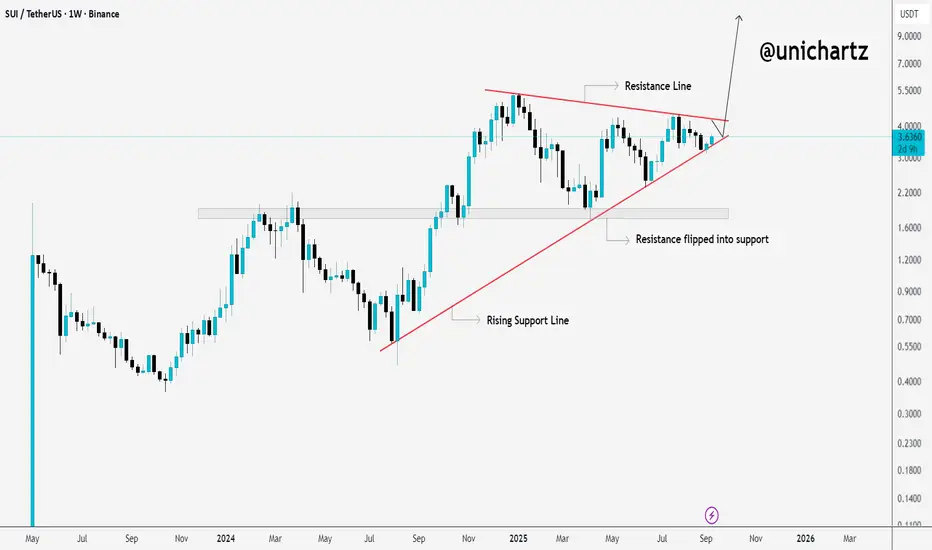
SUI at a Crossroads: Next Move Could Be HugeCRYPTOCAP:SUI has been moving inside a big triangle pattern, with rising support holding the lows and strong resistance capping the highs. Notice how the old resistance around $1.60 has already flipped into support, a healthy sign showing buyers are still in control.
Right now, SUI is sitting at the apex of the triangle. A breakout above resistance could open the door for a sharp move higher, while losing that rising support would mean buyers need to regroup at lower levels.
In simple terms: the squeeze is on, and whichever side breaks, momentum will likely follow fast.
DYOR, NFA
Stay updated everyday follow us on TradingView
#PEACE
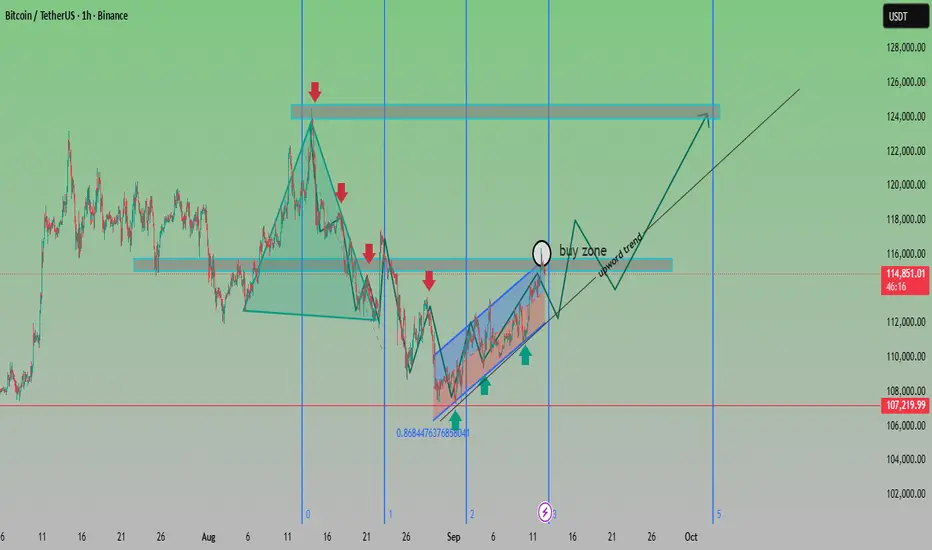
BTC Buy Zone Forming – Potential Bullish Breakout AheadAnalysis:
Trend Structure: After a corrective decline from the $124K resistance area, BTC has rebounded strongly, forming a rising channel (highlighted in blue).
Support Levels: Strong demand observed near $107,200, aligning with the 0.868 Fibonacci retracement, making it a crucial support zone.
Buy Zone: Chart highlights the $114K–$116K range as a buy zone before continuation of the upward trend.
Resistance Levels: Key resistance remains around $124K–$126K, which is the next major target if the bullish momentum sustains.
Outlook: As long as BTC stays above $114K support, the bias remains bullish, with a potential rally towards $120K–$124K. A breakdown below $112K would invalidate the bullish scenario.
✅ Bias: Bullish continuation
🎯 Targets: $120,000 → $124,000
🛑 Invalidation: Break below $112,000
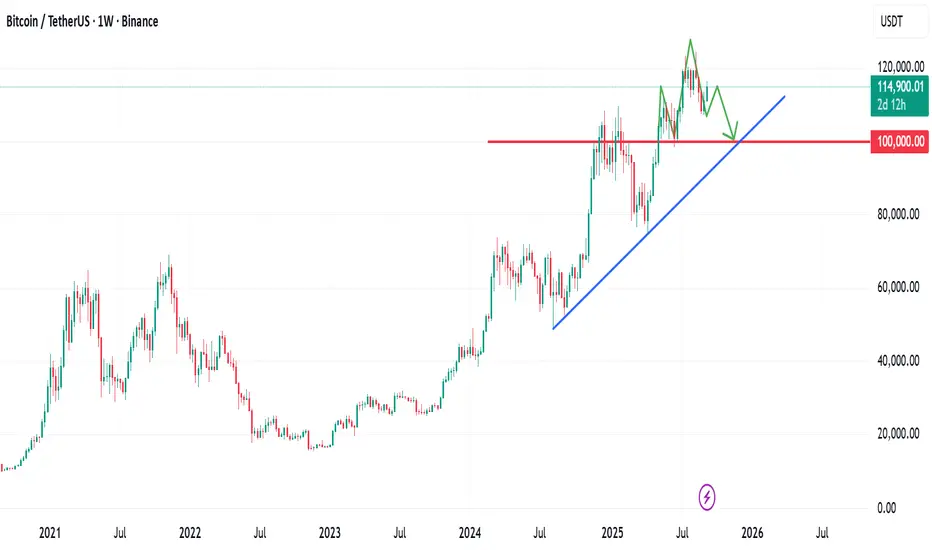
What if Bitcoin drop to $100KWhat if Bitcoin drop to $100K?
Technically looking at this asset from when it broke the $100K resistance and pushed further up, a possible reversal pattern has been forming.
This reversal pattern is a generally accepted pattern called the ''Head and Shoulder'' pattern
If this plays out technically, we may see BTC at $100K not far from now.
If you found this helpful, like, follow me, subscribe, share and comment.
📌 This analysis is for educational purposes only and not financial advice. Please trade and invest responsibly.
ADA – Cardano Swing Long IdeaADA – Cardano Swing Long Idea
📊 Market Sentiment
Market sentiment remains strongly bullish as the FED is expected to deliver a 0.25% rate cut, with speculation building for a possible 0.5% cut in September. Monetary policy shifts are being driven by both inflation trends and weakening labor market data. The latest August and September job reports were soft, signaling that the economy is cooling rapidly. This environment continues to fuel expectations for a major bullish run in the weeks ahead.
📈 Technical Analysis
Price found support on September 1st at the bullish HTF trendline and has been moving upward since.
Price is currently at the HTF Key Resistance level, showing accumulation rather than sharp rejection, with deviations pushing upward. This indicates strength and a bias toward higher prices.
📌 Game Plan
1)Watch for a daily close above the bearish trendline.
2)Look for the HTF Key Resistance to be broken and confirmed with a daily close above.
🎯 Setup Trigger
Entry after the retest of the HTF Key Resistance level ($0.885).
📋 Trade Management
Stoploss: Daily close below HTF Key Level ($0.85 area)
Targets:
TP1: $0.96
TP2: $1.02
💬 Like, follow, and comment if you find this setup valuable!
⚠️ Disclaimer: This content is for informational and educational purposes only and does not constitute financial, investment, or trading advice. Always do your own research before making any financial decisions.

The 5+1 Fears Every Investor Faces And How To Overcome themThe 5+1 Fears Every Investor Faces And How To Overcome them
Trading isn’t just about charts and numbers, it’s about handling emotions.
I would love to read about your fears in trading and how you are overcoming them.
I choose the 5 most common fears, some affected me a lot in the past and others not that much, but I know are all very common in the Traders community.
#1 Fear of Losing Money
The obvious one.
Every loss used to feel like failure . I’d hold trades too long, hoping they’d turn around while loses kept accumulating in the trade.
This is essential, is like understanding that the most important thing when you drive is avoiding a collision! If you have a big accident, you are out. The game is over.
Trading is the same, a big accident means you are out. Your account is wiped and you can’t do anything to reverse tha t.
To stay alive in the market , I learned to risk small (1–2% max), diversify across sectors, countries, tight stops, steady take profits and different trade directions. That way, even if I lose, I can move on without blowing up my account.
This is an example:
Today, If I do a Montecarlo simulation into my account the risk of losing a 25% is under 0,1%. You can learn how to do so in my profile newsletter.
#2 Fear of Missing Out (FOMO)
I used to chase breakouts just because everyone else was already in , usually at the worst possible price, on the worst possible day.
Now, if I miss the move, I simply let it go.
I remind myself there are countless stocks, currencies, metals, and cryptos out there waiting for me.
Why waste money on expired opportunities?
My rule is simple: it’s always better to miss a trade that’s already gone than to miss the next one that’s just around the corner.
So I keep searching.
#3 Fear of Being Wrong
This is my favorite !
Once I understood that t rading is about balancing wins and losses in a healthy way, everything changed.
Mistakes stopped feeling like failures and started to look like what they really are, necessary steps forward, even if you can’t see it in the moment.
For me, it’s just like sports : no basketball team wins a game without the rival scoring points. No football team wins a championship without losing some matches. No tennis player wins every single point.
So yes, you must make mistakes . They’re simply part of the process . The key is not to let them wipe out your account and trigger Fear #1.
#4 Fear of Overtrading / Freezing
This is an unknown fear for most traders. But must be a big one for you all.
If you trade so often, you are probably entering at tons of unnecessary trades which are undermining your returns, but if you never decide to trade you are missing big opportunities.
So having clear entry and exit reasons helped me a lot to hold a reasonable investment rithm.
#5 Fear of the next big crisis
The market is rallying … and that little voice kicks in: What if I’m the one who doesn’t see the crash coming? What if I get stuck in a bear market for years? Are we heading toward a crisis worse than 2009, or even 1929?
Trust me, that fear is more common than you think . You are not alone!!
In my case, trading short-term has given me the freedom to hold long-term positions without hesitation. In fact, I actually get excited when markets decline , it means I can move more money into long-term opportunities.
Right now, most of my portfolio is in short-term trades, some of which I’ve already shared with you here. The results? They’re fully transparent and published on my website (coming soon).
An example of short term trade even though knowing it was a super good long term entry.
#6 The Bonus: Fear of Success
Yes, this one is wild.
I was two years knowing exactly how to make money in the market , but somehow, I couldn’t succeed.
I kept sabotaging myself and my investments by doing stupid things outside my strategy.
You need to believe in yourself, and stay cold as ice. Avoid news, avoid gurus. You vs the market!
Follow your rules, and review them regularly. If a rule isn’t adding value, feel free to tweak or remove it, but never change nor break your rules in the middle of a trading day.
Day after day, you’ll start to realize that yes, it is possible to earn money in the market. Gradually, your confidence grows, and eventually, it feels effortless, like riding a bike on a sunny day. Pure joy.
Final Thoughts
Fear doesn’t disappear, but you can manage it.
Taking small risks, following clear rules, and accepting that you’ll never catch every market move may sound obvious, but they’re far from common among traders.

16,532% growth in just 37 days! A new star in the crypto world!MYX Finance: Understanding the Crypto Star that Soared Over 16,000%
BINANCE:MYXUSDT.P
In the fast-moving world of cryptocurrency, stories of incredible growth often capture our imagination. Recently, a new star has emerged, producing a truly breathtaking performance. In just 37 days, the MYX Finance token (MYX) experienced a massive price increase of over 16,532%. This kind of rocket launch makes everyone ask two simple questions: What is MYX Finance, and how did its price rise so fast?
This article is your guide to understanding this exciting story. We will explore what makes MYX Finance a special project in the crypto universe. Then, we will uncover the key reasons behind its recent, explosive growth. This is more than just a story about numbers; it’s a look into the innovation and energy that makes the world of digital finance so exciting.
Part 1: What is MYX Finance? A Simple Guide to a Powerful Platform
Before we understand why MYX grew so quickly, we first need to understand what it is. At its heart, MYX Finance is a new type of crypto trading platform designed to be powerful, fair, and easy for everyone to use.
The Best of Both Worlds - A New Kind of Crypto Market
In the crypto world, there are two main types of exchanges. Centralized Exchanges (CEXs) are like big, traditional banks. They are fast and easy to use, but you have to trust them to hold your money safely. Decentralized Exchanges (DEXs) are more like a community market. You always control your own money, but they can sometimes be slower and more complicated. MYX Finance combines the best features of both. It’s a DEX, so you always have control of your funds, but it’s designed to be as fast and easy to use as a CEX. It achieves this with a special system that lets trades happen instantly and with a feature they call “zero-slippage.”
The Magic of "Zero-Slippage"
Imagine you want to buy a crypto token for $100. On many platforms, by the time your order is processed, the price might have changed to $101. That $1 difference is called “slippage.” It can be very frustrating for traders. MYX Finance has built a system to eliminate this problem. Zero-slippage means the price you see when you click “buy” is the exact price you get. This makes trading fairer and more predictable, which is a huge advantage for traders of all levels.
More Than Just Trading - A Multi-Chain Universe
MYX isn't limited to just one blockchain. It operates across more than 20 different chains, including popular ones like Ethereum, BNB Chain, and Arbitrum. This means users can trade a huge variety of tokens without having to move their funds between different platforms, saving them time and money.
Part 2: The Perfect Storm: Four Key Catalysts for Explosive Growth
A 16,532% price increase doesn't happen by accident. It takes a “perfect storm” of technology, timing, and community excitement. For MYX, four main factors came together to create this incredible rally.
Excitement for the V2 Upgrade: Before the big price surge, there was a lot of positive talk in the MYX community about a major platform upgrade called V2. This upgrade promised to make the platform even better, faster, and more powerful, creating a strong foundation of positive sentiment.
Major Exchange Listings: The real explosion began when the MYX token was listed on popular crypto exchanges, especially Binance Alpha. This exposed the token to millions of new potential buyers. In one day, trading volume surged by 710%, reaching an incredible $354 million.
The "Short Squeeze": When the price started to rise, traders who had bet against the token (shorting) were forced to buy it back to cover their losses. This created a rapid buying frenzy called a “short squeeze.” In just 24 hours, over $14.6 million in these short positions were liquidated, adding even more fuel to the rally.
Industry Recognition and Awards: Finally, MYX Finance received a prestigious award from the BNB Chain, one of the biggest networks in crypto. They were named a “Volume Powerhouse,” which served as a powerful endorsement and gave new buyers more confidence in the project.
Part 3: The Big Picture - Why This Matters for Crypto
The story of MYX Finance is more than just one token's success; it shows us some important trends in the world of crypto.
Innovation Matters: MYX didn’t just grow because of hype; it grew because it offers a genuinely better trading experience with its zero-slippage feature. This shows that projects with strong technology can achieve incredible things.
The Power of Community: The excitement and support from the MYX community played a huge role in its success. In decentralized finance, a strong community is one of the most valuable assets a project can have.
Opportunity Still Exists: It reminds us that the crypto market is still young and full of opportunity. While there are always risks, stories like MYX show that there is still massive potential for growth.
Conclusion: Your Adventure in the World of Crypto Begins
The incredible 37-day journey of MYX Finance is a powerful reminder of how dynamic and exciting the world of digital assets can be. We’ve seen how a project with innovative technology, strong community support, and perfect timing can capture the attention of the entire market.
As the Founder of ForecastCity and the creator of the 4CastMachine AI software, my mission is to help traders navigate this exciting market with better tools and insights. The crypto world is full of opportunities like this one. To stay ahead of the curve and continue your learning journey, make sure to follow me! Let's explore the future of finance together.
Frequently Asked Questions (FAQs)
What is MYX Finance in one sentence?
MYX Finance is a next-generation decentralized exchange (DEX) that makes trading crypto fast, easy, and fair by offering zero-slippage trading across more than 20 different blockchains.
What does "zero-slippage" mean?
It means the price you see when you make a trade is the exact price you get, which prevents you from losing money to sudden price changes during your transaction.
Why did the MYX token price rise so fast?
It was a "perfect storm" of four main factors: excitement for a major platform upgrade (V2), listings on popular exchanges like Binance, a "short squeeze" that forced rapid buying, and a prestigious award from BNB Chain that boosted confidence.
Is MYX a good investment?
Like all cryptocurrencies, MYX is a high-risk, high-reward asset. Its recent performance has been incredible, but the market is very volatile. This article is for educational purposes, and you should always do your own research (DYOR) and assess your personal risk tolerance before investing.
For ongoing analysis and to discover more exciting projects in the crypto space, don't forget to follow me!
Trade Smart!
Navid Jafarian
