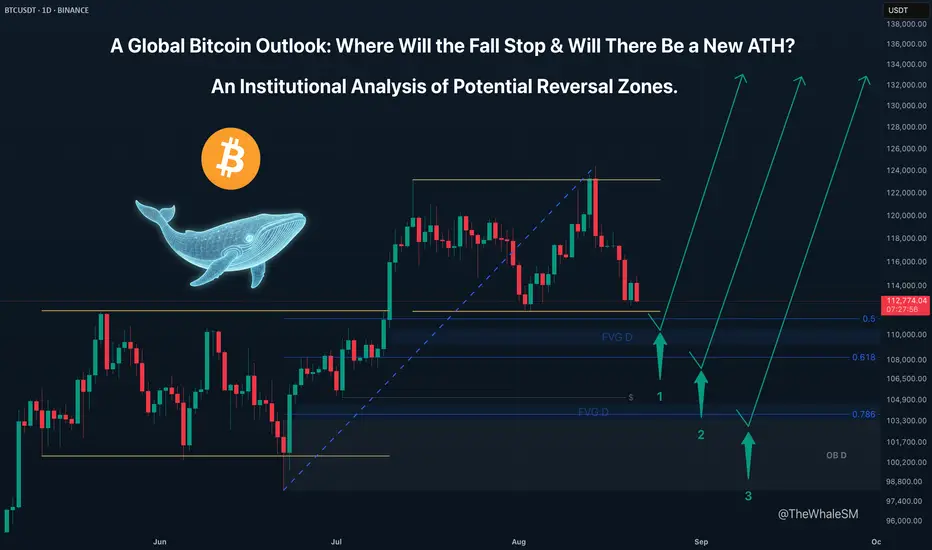
Bitcoin's Tumble: How Deep Does the Rabbit Hole Go?This isn't just a correction; it's a journey down the rabbit hole. The recent "fake" ATH was a calculated move by the whales to engineer a deep pullback. This analysis maps out the key levels in this rabbit hole where Alice—and Bitcoin—might finally find the bottom and begin the climb to a new Wonderland.
After updating its ATH on August 14th, Bitcoin did not continue its global uptrend. It was merely a liquidity sweep of the previous ATH, which confirmed the formation of a large range on the weekly and daily structures. In essence, this new ATH was a deviation above the range, after which the asset began a sharp markdown, collecting all the internal liquidity.
Most likely, the recent ATH was not the final one in this global bull cycle for Bitcoin because a proper, definitive high that would look like the start of a bear cycle was not established. Instead, it was achieved through a manipulation aimed at engineering a correction for the instrument down to key institutional levels.
Three Potential Long Scenarios
General Entry Conditions for All Scenarios:
Since these are levels from a global structure, a valid entry requires a clear reversal reaction and price finding acceptance above the respective Fib level . Confirmation of this may require waiting for 1-2 daily candles to close if the 1-4H candles do not immediately confirm the reversal.
SCENARIO 1 (Primary): The 50% Weekly Fib Level
This is the first corrective level from which a reversal is possible. A key confluence here is that reaching this level would be accompanied by a sweep of the external liquidity from the lower boundary of the range, as well as the mitigation of the upper boundary of the previous range, which could provide the necessary fuel for the next major impulse up. An added plus would be the price reaching the daily FVG that lies just below this level.
SCENARIO 2 (Deeper Correction): The 61.8% Weekly Fib Level
A break of the 50% level would mean that there wasn't enough liquidity and a deeper correction is needed. The next logical target would be the 61.8% level.
SCENARIO 3 (Final Defense): The 78.6% Weekly Fib Level
This is the last line of defense for the bullish structure. A reaction here would offer the most discounted entry to join the potential continuation of the bull run.
If the final retracement level is broken, the price will most likely attack the June 22nd low at 98200 . If the price finds acceptance below this level with daily/weekly candles, it would signal the end of the global bull cycle and the beginning of a bear market, but this is a distant and less probable perspective for now. I find it more probable that one of the three long scenarios will play out, and the price of Bitcoin will set a new, legitimate ATH.
Since the price is still inside the new large range—albeit near its lower boundary—reaching the first 50% global correction level may take some time and will likely happen next week. Whether this level can withstand the assault will determine if Bitcoin's fall continues, and just how deep Alice's rabbit hole truly is.
~~~~~~~~~~~~~~~~~~~~~~~~~~~~~~~~~~~~~~~~~~~~~~~~~~~~~~~~~~~~~~~~~
The principles and conditions for forming the manipulation zones I show in this trade idea are detailed in my educational publication, which was chosen by TradingView for the "Editor's Picks" category and received a huge amount of positive feedback from this insightful trading community. To better understand the logic I've used here and the general principles of price movement in most markets from the perspective of institutional capital, I highly recommend checking out this guide if you haven't already. 👇
P.S. This is not a prediction of the exact price direction. It is a description of high-probability setups that become valid only if specific conditions are met when the price reaches the marked POI. If the conditions are not met, the setups are invalid. No setup has a 100% success rate, so if you decide to use this trade idea, always apply a stop-loss and proper risk management. Trade smart.
~~~~~~~~~~~~~~~~~~~~~~~~~~~~~~~~~~~~~~~~~~~~~~~~~~~~~~~~~~~~~~~~~
If you found this analysis helpful, support it with a Boost! 🚀
Have a question or your own view on this idea? Share it in the comments. 💬
► Follow me on TradingView for timely updates on THIS idea (entry, targets & live trade management) and not to miss my next detailed breakdown.
~~~~~~~~~~~~~~~~~~~~~~~~~~~~~~~~~~~~~~~~~~~~~~~~~~~~~~~~~~~~~~~~~
Cryptos
MSFT 1D Time frameMarket Snapshot
Current Price: ~$498.41
Daily Change: +0.23 (≈0.05%)
Market Cap: ~$2.79 Trillion
P/E Ratio: ~28.9
EPS: ~12.93
🔎 Technical Indicators
RSI (14-day): ~41 → Neutral, leaning slightly bearish.
MACD: –2.7 → Negative but giving a weak buy crossover signal.
Williams %R (14-day): ~–74 → Suggests a possible rebound (buy).
CCI (14-day): ~–108 → Oversold zone, buy indication.
ADX (14-day): ~20.6 → Weak trend strength.
ROC (Rate of Change): –3.5 → Mild bearish momentum.
📈 Moving Averages
5-day MA: Below current price → Bearish short-term.
20-day MA: Below current price → Bearish.
50-day MA: ~$509, above price → Acting as resistance.
100-day MA: ~$476, below price → Supportive.
200-day MA: ~$443, below price → Long-term uptrend still intact.
🔧 Support & Resistance
Support Zone: ~$491 – $497
Resistance Zone: ~$500 – $510
📅 Outlook
Bullish Case: If MSFT climbs above $509–510, momentum could extend toward new highs.
Bearish Case: A break below $491 may lead to a pullback toward $480–485.
Overall Bias: Neutral to slightly bearish in the short term, but long-term bullish trend remains intact above the 200-day MA.

NVDA 2HourTime frameNVDA 2-Hour Snapshot
Current Price: $170.76 USD
Previous Close: $168.31 USD
Day Range: $166.74 – $170.97 USD
52-Week Range: $139.34 – $200.00 USD
Volume: 170,370,750
VWAP: $169.67 USD
Market Cap: $1.1 Trillion
🔎 Technical Indicators
Relative Strength Index (RSI): 39.44 — Neutral
Moving Averages:
5-period: $169.68 — Sell
10-period: $174.59 — Sell
20-period: $177.06 — Sell
50-period: $172.58 — Sell
100-period: $150.61 — Buy
200-period: $139.34 — Buy
Moving Average Convergence Divergence (MACD): -0.91 — Buy
Stochastic Oscillator: 20.33 — Neutral
Commodity Channel Index (CCI): -119.52 — Buy
Average True Range (ATR): 4.93
📈 Market Sentiment
Pivot Points:
Resistance: $175.00 USD
Support: $165.00 USD
📅 Outlook
Bullish Scenario: A breakout above $175.00 USD could signal a move toward $185.00 USD.
Bearish Scenario: A drop below $165.00 USD may lead to further downside.
Overall Bias: Neutral, with mixed signals from moving averages and momentum indicators.

ADANIPORTS 2Hour Time frameADANIPORTS 2-Hour Snapshot
Current Price: ₹1,388.90
Previous Close: ₹1,380.90
Day Range: ₹1,385.00 – ₹1,404.90
52-Week Range: ₹995.65 – ₹1,494.00
Volume: 2,553,605
VWAP: ₹1,392.82
Market Cap: ₹300,065 Cr
🔎 Technical Indicators
Relative Strength Index (RSI): Neutral
Moving Averages:
50-period: ₹1,385.28 — Negative
100-period: ₹1,368.32 — Negative
200-period: ₹1,260.96 — Positive
Moving Average Convergence Divergence (MACD): -14.67 — Negative
Stochastic Oscillator: 39.95 — Neutral
📈 Market Sentiment
Pivot Points:
Resistance: ₹1,327.20
Support: ₹1,305.85
📅 Outlook
Bullish Scenario: A breakout above ₹1,327.20 could signal a move toward ₹1,350.00.
Bearish Scenario: A drop below ₹1,305.85 may lead to further downside.
Overall Bias: Neutral, with mixed signals from moving averages and momentum indicators.

BTCUSDT 2Hour Time frameBTC/USDT 2-Hour Snapshot
Current Price: $112,349.00
Change: -0.29% from the previous close
Intraday High: $112,891.00
Intraday Low: $110,812.00
🔎 Technical Indicators
Relative Strength Index (RSI): Neutral
Moving Averages:
7-period MA: $112,376 (short-term support)
25-period MA: $111,484 (medium-term support)
99-period MA: $113,049 (short-term resistance)
📈 Market Sentiment
Pivot Points:
Resistance: $113,650
Support: $108,666
📅 Outlook
Bullish Scenario: A breakout above $113,650 could signal a move toward $120,000.
Bearish Scenario: A drop below $108,666 may lead to further downside.
Overall Bias: Neutral, with mixed signals from moving averages and momentum indicators.

WIPRO 1D Time frame📊 Wipro Daily Snapshot
Current Price: ₹256.50
Change: Up 2.97% from the previous close
Volume: 804,499 shares traded, significantly higher than the 50-day average of 369,496
MarketWatch
🔎 Key Levels
Resistance: ₹253.70 (short-term)
Support: ₹239.55 (short-term)
52-Week High: ₹324.55 (January 23, 2025)
52-Week Low: ₹239.55 (recent support level)
📈 Technical Indicators
RSI (14): Approximately 75 — indicates overbought conditions
MACD: Positive — suggests upward momentum
Moving Averages: Trading above 5-day (₹255.97), 50-day (₹248.47), and 200-day (₹247.12) SMAs — bullish trend
Stochastic Oscillator: Indicates overbought conditions
ADX: Approximately 17.49 — suggests a weak trend strength
Top Stock Research
📌 Market Sentiment
Catalysts: Positive market sentiment, with Wipro outperforming key competitors like HCL Technologies and Tata Consultancy Services in recent sessions
MarketWatch
Sector Performance: IT sector showing strength, with Wipro leading gains among peers
📅 Outlook
Bullish Scenario: Sustained trading above ₹253.70 could lead to a push toward ₹277.65 (long-term resistance)
Bearish Scenario: A drop below ₹239.55 may test support around ₹234.20 (mid-term support)

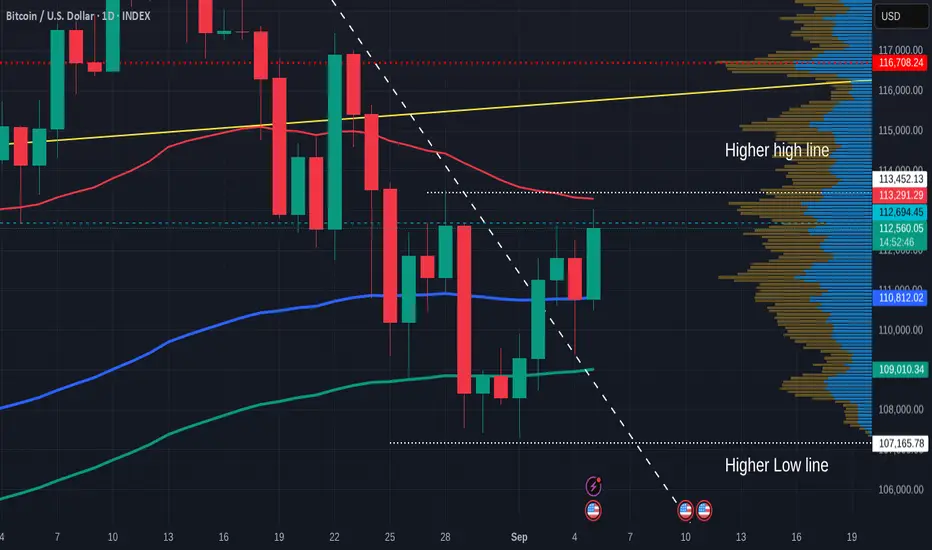
Bitcoin EMA update - Big day today ?This chart uses the EMA, Simple Moving Average
Red = 50, Blue = 100, Green = 128, Yellow = 200
Today, PA is once again up against the 50 EMA that has become resistance.
This is just below the important level that would allow us to make a higher high if PA breaks through.
A Higher High is made if we rise above 113452
We can see that the 100 SMA is also now on a local line of support.
So it is decision time for PA today.
To remain in an ever decreasing area, a squeeze, or Break out above the 50 ( 112967 ) or fall below the 100 ( 110831 ) and the local support.
As you can see, this is a very tight range
This is continued with the 128 SMA at
109134
A Lower low is made if we drop below 107165
Daily MACD still rising Bullish
This is only just and not really showing to many sighs of a "Surge". The Histogram is green but is we look bak, we can see a similar rise in Mid August that failed to continue.
However, It has room to move higher when ready, by a substantial margin.
The 4 Hour PA charts shows ua how the Bulls have been at work
PA continues to besandwiched between the 200 EMA and the 50.
If this pattern continues, we can expect to see PA rejected today by the 200 EMA and return to the 111200 area.
The 4 hour MACD
The Histogram shows us the hesitancy of PA. This is nit such a bad thing PA seems to be waiting, maybe for the FED on 17th.
I am not sure that PA can continue this long and I feel a reaction will be made prior to this date.
This may be a Dip lower, A LONG destroyer just before we see a move higher,, should the FED lower rates.
But trying to predict BTC Moves is foolhardy...............
Today will certainly give us an idea of future direction........

Bitcoin Daiy SMA UPDATEThis chart uses the SMA, Simple Moving Average
Red = 50, Blue = 100, Green = 128, Yellow = 200
The weekend was calm and very low trading.
PA is ranging along the 100 SMA and sitting, waiting.
PA has the potential to move in either direction right now but the Bulls are certainly present, Keeping PA static.
Daily MACD remains Bulish with room to move higher, Histogram is Green
On the shorter term 4 hour, we can see how the 50 SMA is supporting PA while the 100 is currently the line to cross at 111582
PA has support below and is avobe the VRVP POC ( red dots )
Shorter term certainly appears more Bullish
The 4 hour MACD also shows this
The MACD came down and tested neutral line as support and the Histogram here is alo Green.
But understand, this does NOT guarantee a rise further.
The lines of Resistance abive are growing.
Currently, beginning aroun 113K
The Blue line on the Daily chart is the ultimate Goal to be crossed.
This is a LONG Term line of resistance that has rejected EVERY ATH since 2011.
It is the only line that has done this and what is important to know, this is a Calculated Arc, part of a Fibonaccj Spiral ( as explained in a previous post)
This is the Bigger picture, PA from November 2009, the year after Bitcoin Was born
As you can see, PA is being Sqqueezed and HAS to react before January 2026 or face stiff rejection below that Long Term line of support ( dashed line)
What ever happens, this IS the beginning of a New Era, Cycle of Bitcoin.
And this is why we need to pay so much attention to Bitcoin right now.
We MUST rise above that blue Arc of resistance....
And Curently, we are HERE....shown in the chart below.
This is a daily chart from November 2024
PA has been trying to get above this blue Arc since then.
And we are right under it again now,
Target price to get to and hold Above this Blue Arc is around 117K
We may wait till the FED tells us its decision on interest rates this month.

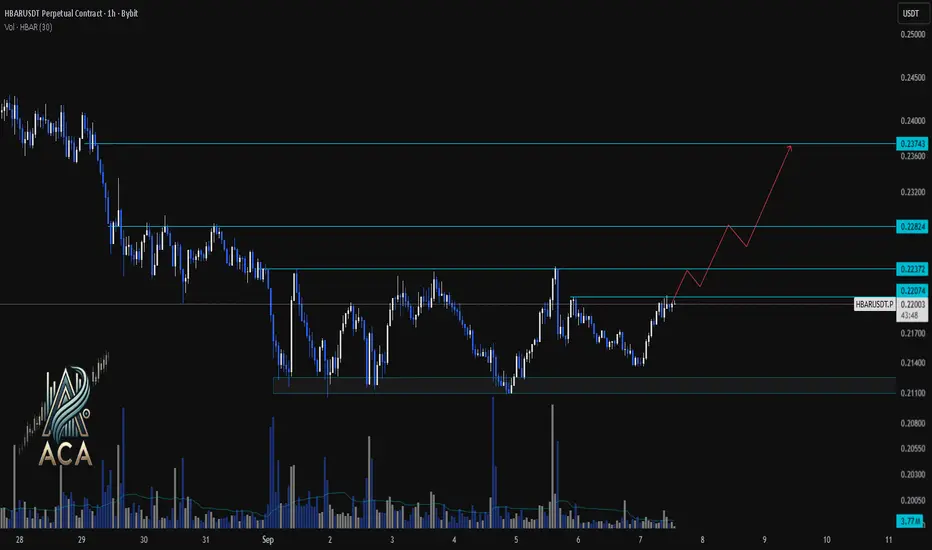
HBARUSDT 1H Chart Analysis | Bullish Structure in PlayHBARUSDT 1H Chart Analysis | Bullish Structure in Play
🔍 Let’s break down the recent price action for the HBAR/USDT perpetual contract and outline the roadmap for potential bullish continuation.
⏳ 1-Hour Overview
The 1-hour chart shows HBAR recovering from a strong demand zone near $0.21100, pushing upward with notable momentum. Price action is now challenging immediate resistance at $0.22372, with higher levels at $0.22824 and $0.23743 presenting the next bullish targets.
🔺 Long Setup:
A decisive close and hold above $0.22372 could fuel further upside, targeting the $0.22824 resistance next. Sustained bullish volume and higher lows may pave the way for an extension up to $0.23743, aligning with the drawn projection path.
📊 Key Highlights:
- Strong defense of the $0.21100 support region led to a sharp rebound.
- Immediate resistance stands at $0.22372, with the bullish path mapped toward $0.22824 and $0.23743.
- Volume spikes on upward candles indicate increasing buyer interest and potential for trend follow-through.
🚨 Conclusion:
HBARUSDT is building a bullish structure above local support, with momentum favoring continued upside if $0.22372 flips into support. Watching volume and reaction at key resistance areas remains crucial for confirming the next leg higher.
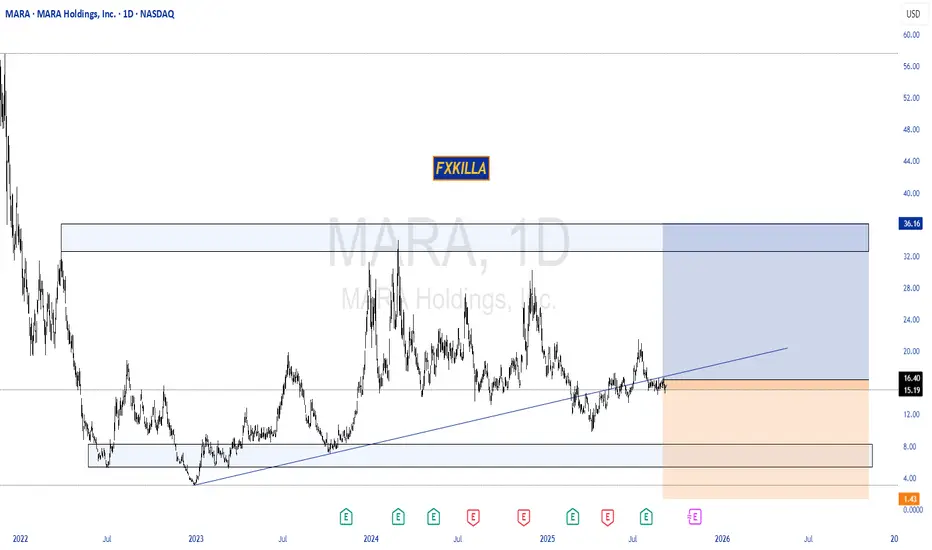
MARA HIGH PROBABILITY SETUP SOON!!!🚨 MARA HIGH PROBABILITY BUY SETUP 🚨
* Here We Can See Clearly The Next Potential Move For MARA Coming Hours/Days.
* Keep Your Eyes Close On Your Trading Positions.
* Happy PIP Hunting Traders.
FXKILLA.
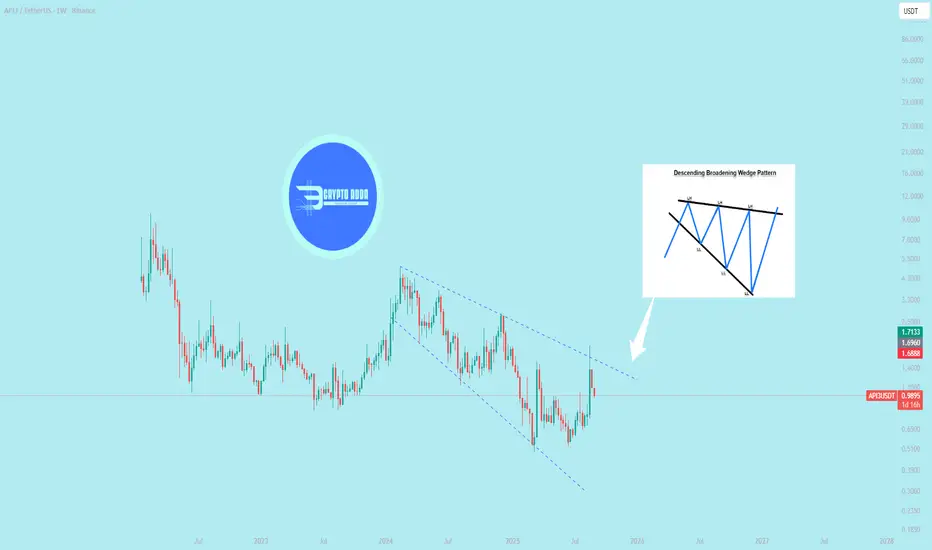
$API3 is encountering resistance **$API3 is encountering resistance at the upper trendline of its descending broadening wedge pattern.**
` Here's a quick refinement for clarity and precision, keeping the structure intact:`
1. **Confirm the Pattern**: Identify the descending broadening wedge on API3’s chart, characterized by lower highs and lower lows with diverging trendlines widening downward.
2. **Await Breakout Confirmation**: Wait for a decisive close above the upper trendline, supported by high trading volume, to validate a bullish breakout.
3. **Plan Entry and Stop-Loss**: Enter a long position post-breakout; set a stop-loss below the lower trendline or recent swing low to protect against reversals.
4. **Define Profit Targets**: Calculate the wedge’s height at its widest point or use nearby resistance levels to establish realistic profit targets.
5. **Control Risk**: Limit risk to 1-2% of your capital per trade, using indicators like RSI or MACD to confirm breakout strength and avoid false signals.
These points provide a clear, actionable framework for trading API3’s descending broadening wedge.
Quick Bitcoin Daily SMa update - PA getting rejected
As you can se, PA is getting rejected off the 50 SMA ( red)
If this rejection is confirmed, this could create a double Top and may push PA back down to create a Lower Low.
Watch this closely, it could turn if the bulls step in.
Just be Very cautious right now.
oshorter term 4 hour MACD is showing us that MACD did cross above the signal line however, this could turn down quickly as it did over on the left of the chart
Caution is advisable
Bitcoin to $500K by 2028–2030Institutional Adoption, Scarcity, and the Devaluation of the Dollar
The question of whether Bitcoin could reach the half‑million mark within the next five to seven years is increasingly debated among investors, economists, and institutions alike. While such projections still carry uncertainty, several converging trends suggest that a $500,000 valuation for Bitcoin by 2028–2030 is within the realm of possibility. These drivers include the rapid pace of institutional adoption, Bitcoin’s fixed supply, its growing narrative as a store of value, the potential role of national reserves, and a macroeconomic backdrop defined by inflation and dollar devaluation. Additionally, the long‑term holding behavior of Bitcoin investors has reduced circulating supply, further amplifying the scarcity effect.
1. Institutional Adoption via ETFs and Beyond
The approval and growth of Bitcoin exchange-traded funds (ETFs) in major financial markets mark a watershed moment in the asset’s mainstream acceptance. These vehicles simplify access for institutional investors that were previously constrained by custody and regulatory hurdles. Pension funds, endowments, and sovereign wealth funds are now able to allocate to Bitcoin through regulated channels.
As demand from professional investors grows, the inflows through ETFs act as a continual buy‑side force. Unlike speculative retail buying sprees of previous cycles, institutional allocations are more structured and long‑term oriented, potentially anchoring a more stable demand floor. This steady absorption of supply is expected to become one of the strongest catalysts for Bitcoin price growth this decade.
2. Fixed Supply: The Scarcity Engine
Bitcoin’s most unique feature is its hard‑coded supply cap: only 21 million coins will ever exist . This mathematical certainty contrasts starkly with fiat currencies, where central banks can expand money supply indefinitely. Halving events, which reduce the block rewards of mining BTC roughly every four years, further accelerate scarcity.
By 2030 , the annual mining of Bitcoin will be minuscule compared to today, limiting fresh supply even as institutional demand scales up. In classical economic terms, a growing demand against a fixed or declining supply can only result in upward price pressure.
3. Store of Value in an Inflationary World
The past decade has demonstrated how inflation and monetary expansion distort asset markets. As governments print more money to finance debt and expenditures, investors increasingly seek hedges against the erosion of purchasing power. Historically, gold has played this role.
Bitcoin, with its transportability, divisibility, verifiability, and digital-native characteristics, is now increasingly seen as a modern alternative or complement to gold. If Bitcoin even partially captures the $13+ trillion gold market as a store of value, valuations well above $500,000 per coin become mathematically plausible.
4. Bitcoin as a Component of National Reserves
While still early, several nations are exploring or experimenting with holding Bitcoin in their reserves. For countries facing dollar dependency or geopolitical pressures, Bitcoin provides a neutral, censorship‑resistant reserve asset that reduces reliance on the U.S. financial system.
Should more governments follow El Salvador’s lead or allocate even a small percentage of their foreign reserves to Bitcoin, global reserve demand could represent a massive new buyer base. Even marginal allocations at a sovereign level would create outsized effects due to Bitcoin’s relatively small market capitalization compared to global reserves.
5. The Dollar, Inflation, and Asset Price Revaluation
The U.S. dollar, while still dominant, faces structural challenges: ballooning government debt, persistent fiscal deficits, and the need for monetary expansion to sustain growth. Increased money supply historically leads to currency debasement. As purchasing power erodes, asset prices, from equities to real estate to scarce stores of value like Bitcoin, tend to reprice higher in nominal dollar terms.
Thus, Bitcoin’s potential ascent to $500,000 is not solely about Bitcoin “going up,” but also about the dollar “going down.” In this sense, the milestone is as much a reflection of fiat devaluation as it is of Bitcoin adoption.
6. The Supply Dynamics: 80% Already Parked
On‑chain analytics highlight another critical factor: roughly 80% of Bitcoin supply is currently held by long‑term investors in “dormant” wallets, seldom moved or sold. This indicates that a large portion of the supply is illiquid, effectively taken off the market.
When institutions, retail newcomers, or governments try to acquire Bitcoin in size, they will be competing over the thin slice of supply available for trade. This dynamic creates a potential supply squeeze, which historically has been one of the key drivers of Bitcoin’s parabolic price advances.
Conclusion: A Plausible Milestone, But With Volatility Along the Way
Projecting Bitcoin to $500,000 by 2028–2030 is not simply speculation, it is a thesis grounded in identifiable trends: institutional adoption through ETFs, a mathematically capped supply, Bitcoin’s emerging status as digital gold, the potential for sovereign reserve adoption, and macroeconomic tailwinds fueled by dollar debasement.
However, it is important to note that Bitcoin’s journey will not be linear. Volatility, regulatory battles, and shifts in global macro conditions will shape the trajectory. Yet, the combination of structural scarcity and rising global demand makes the possibility of half‑a‑million per coin a credible long‑term scenario.
#crypto #bitcoin #finance #defi #economy #portfolio #digital #blockchain #trading #asset

$MSTR – Bear Flag Breakdown SetupNASDAQ:MSTR – Bear Flag Triggering Despite Crypto Strength
MicroStrategy ( NASDAQ:MSTR ) has been drifting lower even as crypto has ripped the last few months — a clear sign of relative weakness. Every rally attempt has been faded, and now the chart is setting up a clean bear flag breakdown.
🔹 The Setup:
Price is pressing the $326 trigger level on a bear flag structure.
A breakdown here opens the door to $300 for the first cover zone.
Weak price action despite a strong sector = bearish divergence.
🔹 Market Context:
The NASDAQ:QQQ is flashing distribution signals — failed breakouts in momentum names and heavy selling under the surface.
If indexes continue to weaken, NASDAQ:MSTR could accelerate to the downside as speculative money comes out.
🔹 My Trade Plan:
1️⃣ Entry: Short on breakdown through $326.
2️⃣ Target: First covers into $300.
3️⃣ Stop: Above the flag highs — no need to fight if it reverses.
Why I Like This Setup:
Relative weakness vs. crypto = red flag for bulls.
Bear flag structure + clear trigger + defined target.
Broader market weakness adds conviction.
Bitcoin Daily SMA UPDATE This daily chart uses the SMA, Simple Moving Average
Red = 50, Blue = 100, Green = 128, Yellow = 200
PA got rejected yesterday from its rise over the 100 SMA and is currently testing that as support on a Daily chart.
If that fails, we could see PA retreat down to around 108900, where we have the 128 SMA and the descending line of resistance.
This line has not been tested as support yet.
As we can see on the chart, if this rejection continues down past 107165, we will have printed a Lower high, pointing towards continued price drops. with the 200 SMA at 104348
The Daily MACD has reached up to its Signal line
This could also be a point of rejection, keep your eye on this
The 4 Hour BTC PA chart shows us more near term detail
PA is currently testing the 50 as support after getting rejected from the 128 and falling through the 100.
If this fails, we can see PA will bump into the trend line, around 108900 - 108500.
To many extents, this would be a good move providing we then found support and bounced higher as it would create a Higher Low.
The 4 hour MACD
MACD has turned down and heading towards its signal line.
This may offer support but it will continue down Bearish if PA does reach down to the trend line.
Note how the Histogram has descending sharply.
Today we must sit and wait
For me, I think we could see the 109k - 108k area tested at some point over the next few days.
Maybe sooner than later

ETH/USD: Will ETH Soar to $8,000 or Crash Below $4,000?As of September 3, 2025, Ethereum (ETH) is trading around $4,466 USD. The market is currently experiencing heightened volatility, influenced by both technical factors and broader macroeconomic developments. Ethereum reached a high of $4,954 in August before retracing to its current levels, suggesting a consolidation phase with key support around $4,200 and resistance near $4,650.
Technically, short-term trends suggest a bullish bias, but caution is advised due to recent fluctuations. The Relative Strength Index (RSI) is showing bearish divergence, indicating potential weakening momentum. A decisive breakout above $4,650 could push ETH toward $5,000, while a drop below $4,200 may lead to retesting the $4,000 support zone.
Investor sentiment is cautiously optimistic. Anticipation of potential Federal Reserve rate cuts in September has increased demand for risk assets like Ethereum. Additionally, the upcoming Fusaka upgrade is expected to enhance Ethereum's scalability and reduce transaction costs, further bolstering its appeal.
In the near term, Ethereum is likely to experience continued volatility. Traders should monitor the $4,200 support and $4,650 resistance levels closely. Looking ahead, Ethereum's long-term prospects remain strong. Analysts project that with sustained institutional interest and successful implementation of scalability upgrades, ETH could reach between $6,000 and $8,000 by the end of 2025.
Despite the optimistic outlook, Ethereum's price remains susceptible to broader market dynamics, including Bitcoin’s performance and macroeconomic factors. Investors should be prepared for potential fluctuations and consider these risks when making investment decisions. Overall, Ethereum’s market is at a pivotal point, and key technical levels and upcoming events will play a crucial role in determining its short-term trajectory.

96K --- 152K --- 76K
In a bull market Fibonacci extensions usually target the 2.618 level which is around 152,000$.
The target of the 4th internal wave of the 5th wave, which is the last upward wave, is 96,000$.
When the 5th and last upward wave ends, I expect this rising parallel channel to break down and head towards the lower Fibonacci channels.
I think Bitcoin will enter a long-term uptrend again, especially after 70,000$ levels.
* The purpose of my graphic drawings is purely educational.
* What i write here is not an investment advice. Please do your own research before investing in any asset.
* Never take my personal opinions as investment advice, you may lose your money.

BTC correction august/septemberBTC has reached overbought territory, there is also bearisch divergence. It also didnt go above 123k anymore. i expect a correction in august/september.
dont chase FOMO, be prepared. Nothing goes in a straight line. there are always corrections.
CRYPTO:BTCUSD BINANCE:BTCUSD CME:BTC1! BINANCE:BTCUSDU2025


Bitcoin Monthly Candle Colour closes since 2013 - August Close
August closed RED and so now we have 10 red closes to 5 Green.
This has closed the possibility of continuing the pattern we had been following.
The Dashed line Boxes show us The only 2 occasions where we have had a Green December, Red January, Red February, Green March, Green April.
Then we had a Green May 2012 and a Red May 2020
Then both repeated a Green June, Green July.
They both also had had Green August but we just closed Red.
This breaks this sequence for me but I will keep the boxes in place for now just incase we revert back to Sequence.
The horizontal arrows are pointing to the previous 9 Red August Closes.
Where you see 2 Arrows is where this was followed by a Green September. This happened 4 times.
Note those double arrows on the left are in the 2016 build up to 2017 ATH and the ones on the right are in the Current cycle.
September Candle close count is currently is 5 Green to 9 Red, the same as August was.
Of those 5 Green September closes, 4 were after a Red August.
The other Green September was in the 2020 run up to the March 2021 ATH ( Middle dashed box)
Odds are on for a Red September as we see Bitcoin falling below some serious support levels but we should also note how PA is remaining above the 100k line for now.
August and September are traditionally months of Holidays and so trading slows, hence the majority of Red candles
Q4 is the ones to wait for and as you can see from the colour counts, Q4 is usually Bullish
We wait - we Hold and if PA Drops to the possible 104K line where the 200 day SMA sits, I will Buy More.
Scale in

Ethereum’s Epic Climb: $10,000+ by Year-End 2025!New data and discoveries have come in, so my prediction for ETH has changed.
Back in March 2025, I saw this ETH pattern forming:
So far, everything is playing out as expected, but I believe the timeline has shifted to sometime at the end of December 2025.
We have one major liquidation event to play out before this happens in September, and I would not be surprised if we get a pullback to $3,500 before liftoff.
Bitcoin will most likely go down to $92,000 to close the CME gap:
You can check that out above, and when that happens, ETH should bottom out somewhere around $3,500.
The next major time Fibonacci will be on October 10th, 2025; this is most likely when we get the breakout. Until then, a massive trap is forming.
Ascending triangles are the name of the game in a bull market, especially with ETH:
As long as we keep putting in lower highs into ascending triangles, we are good to go higher; anything else is noise.
Invalidation for this thesis is simple: we close a weekly candle under the orange support, and chances are very high that we are done.
All I think is happening here is preparation for a massive bear trap, flushing out all the late leverage, as they always do. This is just a rite of passage before a major rally ensues.


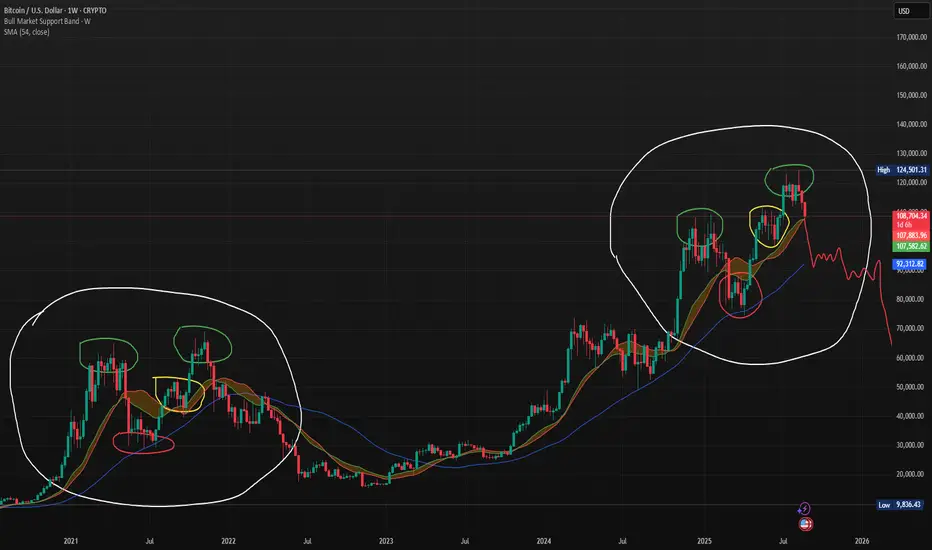
Bitcoin Weekly Chart – Is the 4 Year Cycle Over?This chart compares Bitcoin’s current weekly price action to its 2021 market structure. Both periods show striking similarities: double-top patterns (green circles), mid-cycle consolidations (yellow highlights), and support retests (red circles) within the bull market support band. The projection in red outlines a potential bearish scenario, where BTC could follow a similar path to the last cycle—breaking below support and entering a prolonged corrective phase. Traders should watch the $92K SMA and bull market support band closely as critical levels for trend confirmation.