SOLANA to $600Solana held $123 as support on the monthly timeframe, with the next resistance at approximately $640 in November.
Cryptos

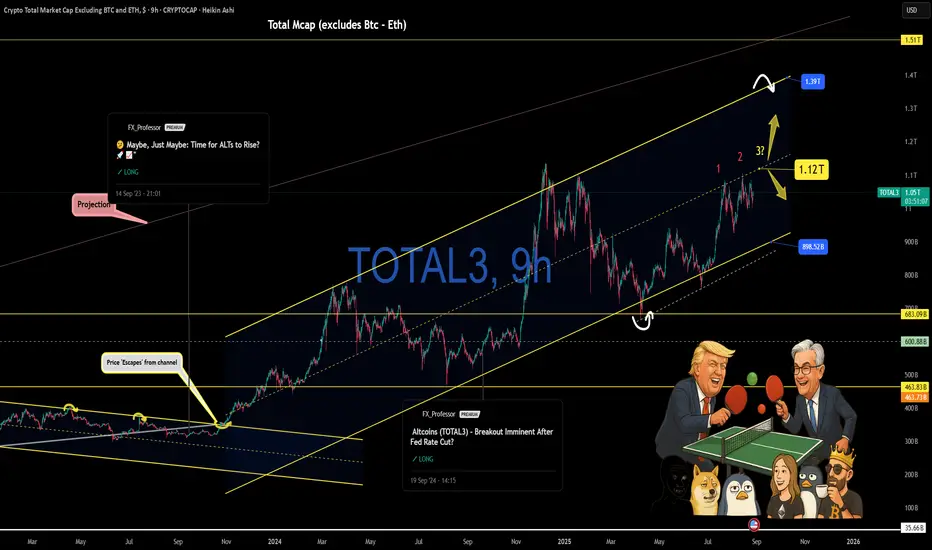
Altcoin Market (TOTAL3) Gearing Up for a Major Test at $1.12T🔥 Altcoin Market (TOTAL3) Gearing Up for a Major Test at $1.12T 📊
Hey guys, Kiri here – the FX Professor.
If you haven’t seen my latest video post, go check it out — I broke down the full story behind Powell, Trump, and the ping-pong match they’re playing with this market. But today, let’s zoom in on what really matters: the Total Crypto Market Cap excluding Bitcoin and Ethereum — TOTAL3 .
🔍 What’s happening?
TOTAL3 is still trading inside its large ascending channel. What we’re watching now is the setup for the third and most decisive test at the $1.12T level.
Why does this matter? Because this level has already caused two strong rejections. A third test here could either confirm the breakout … or become the market’s trapdoor.
🧠 Context:
• S&P 500 is holding above major resistance ✅
• Rate cut decisions expected in September (Powell’s words) 🗓️
• Bitcoin & Ethereum still acting strong — ETH especially outperforming 👑
🎯 What’s the expectation?
I’m leaning more bullish right now. With the macro picture improving and equities pushing higher, I believe we’ll see another test of that 1.12T level soon .
From there, it’s all about the breakout or the rejection.
🚀 If we break out:
Target zones open up at 1.39T and 1.51T — the upper bounds of this long-term channel.
📉 If we reject:
Expect a return to the lower boundary near 898B , adjusting slightly over time since it’s an ascending level.
🧭 Final thoughts:
Markets don’t lie — levels do.
The narrative, the noise, the ping-pong politics… they’re all part of the distraction.
But price? It’s still playing within the structure.
Keep your eyes on 1.12T. That’s the battlefield.
One Love,
The FXPROFESSOR 💙 🌟🤝📈
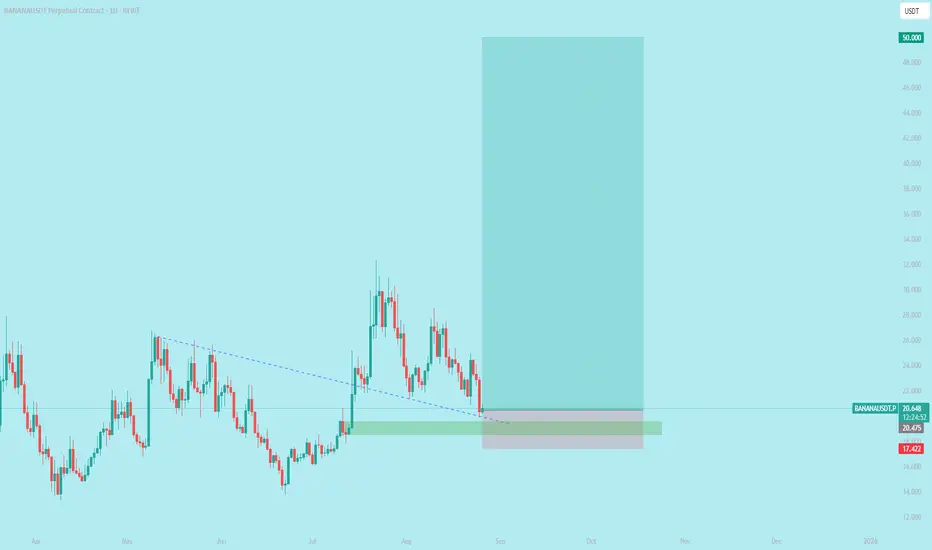
BANANA soars past to $50$BANANA 🍌 Soars past $50
How Trendline Support Trading Works Identify the Trend: Look at the price chart of a cryptocurrency (e.g., Bitcoin or Ethereum) on platforms like Trading View.
In an uptrend, draw a trendline by connecting at least two higher lows (points where the price dipped but didn’t break lower).
Use charting tools to ensure accuracy, as eyeballing can lead to errors.
Confirm the Support: A valid trendline should be touched by the price at least three times to confirm it’s a reliable support level.
The more times the price respects the trendline (bounces off it), the stronger the support.
Trading the Trendline Support: Entry Point: When the price approaches or touches the trendline in an uptrend, it’s a potential buy signal, as the price is likely to bounce upward.
Stop-Loss: Place a stop-loss just below the trendline to protect against a breakout (when the price breaks below the trendline, indicating a potential trend reversal).
Take-Profit: Set a target at a previous high (resistance) or use indicators like Fibonacci extensions to estimate where the price might go.
Validate with Other Indicators: Use additional tools like volume (high buying volume near the trendline confirms support), RSI (to check if the asset is oversold), or candlestick patterns (like bullish engulfing) to increase confidence in the trade.
For example, if Bitcoin’s price touches a rising trendline at $60,000 with high volume and an RSI below 30, it’s a stronger buy signal.
Monitor for Breakouts: If the price breaks below the trendline with strong volume, it may signal a trend reversal or a new downtrend. This could be a signal to exit or consider a short position (betting on price decline).
ETHUSDT: Trade 15 min FractalsThe Ethereum chart is growing up to the specified point and a small long trade can be taken, after which the downward trend will continue until the observed area, of course, it remains to be seen how it will close in that area.

SUSDT 4H Chart Analysis | Channel Breakdown LoomsSUSDT 4H Chart Analysis | Channel Breakdown Looms
🔍 Let’s break down the recent price action on the S/USDT 4-hour chart, focusing on the pivotal ascending channel structure and its implications for the next move.
⏳ 4-Hour Overview
S/USDT has been moving within a well-defined ascending channel, marked by higher highs and higher lows. Price is now testing the lower boundary of this channel, making the 0.3127 support a crucial level. The recent uptick in volume during the downward leg hints at mounting bearish pressure.
🔻 Short Setup:
A confirmed breakdown (BO) below 0.3127 would signal an exit from the ascending channel, opening the door to accelerated downside. With channel support breached, the next key target sits at 0.2710, in line with historical liquidity and the channel’s projected lower range.
📊 Key Highlights:
- Price action is currently at the channel’s lower boundary, with a breakdown below 0.3127 required to confirm bearish momentum.
- Volume has increased on the recent downward move, supporting the idea of a channel exit and follow-through selling.
- Downside target stands at 0.2710 if the channel fails, providing a clear roadmap for action.
🚨 Conclusion:
Bulls must defend the ascending channel at 0.3127, or risk seeing S/USDT cascade toward 0.2710. Watch for volume confirmation—an exit below channel support could shift sentiment quickly.

ZKUSDT - your capital will be doubled on thisIf you want to double your capital in a short period, then ZK is the coin to focus on.
-It’s still at the bottom.
-It formed a symmetrical triangle and already broke out, now doing a retest.
-There’s also an inverse head & shoulders pattern in play.
-Currently sitting right on the 25 EMA support on the daily timeframe.
Buy it spot, and you’ll thank me later.
Best Regards:
Ceciliones🎯

BTC CAN TURN MONDAY IN A GREEN DAY..📊 Market Update
On the lower time frame, BTC is still in a downtrend. However, there is a possibility of a green day if BTC targets the first level at 113.8K, with a 1-hour time frame confirmation.
The main confirmation for BTC will be at 115.4K. A move from 113.8K could provide an opportunity to consider new day trades.

SPX 6900 looking weak , big drop coming?SPX has been a monster for most of 2025 but now showing signs of weakness , weekly lower high trend was the first warning.
Now formed massive rising wedge would be careful with this for now wait until its under one dollar to pick up some more.
This trendline is very important , see how the monthly closes on this one.

ETH/USD: Could $ETH Hit $7,000 by Year-End?As of August 25, 2025, Ethereum (ETH) is trading at approximately $4,795.60, showing a steady upward trajectory since early August. This bullish momentum is supported by several key factors, including institutional interest, ETF inflows, and the ongoing strength of decentralized finance (DeFi) applications.
ETH has recently surpassed the $4,750 resistance level, indicating a potential move towards the $5,000–$5,200 range. The next significant resistance is around $5,000, which, if broken, could pave the way for a retest of the all-time high near $5,200. Conversely, support levels are found at $4,700 and $4,600–$4,400. A drop below $4,600 could signal a short-term pullback.
Ethereum's recent price surge is attributed to increased institutional demand, particularly following the launch of Ethereum ETFs, which have attracted significant capital inflows. Additionally, the Ethereum network's upgrades and the growing adoption of Layer 2 solutions have enhanced scalability and reduced transaction costs, further bolstering investor confidence.
Outlook for Q4 2025
Looking ahead, if ETH maintains its current trajectory and breaks through the $5,200 resistance, it could target the $6,000–$7,000 range by the end of the year. However, market volatility remains a factor, and investors should be prepared for potential fluctuations.
*Ethereum's current bullish trend is supported by strong technical indicators and positive fundamental developments. While the path to new all-time highs appears promising, it's crucial for investors to monitor key support and resistance levels and remain cautious of market volatility.

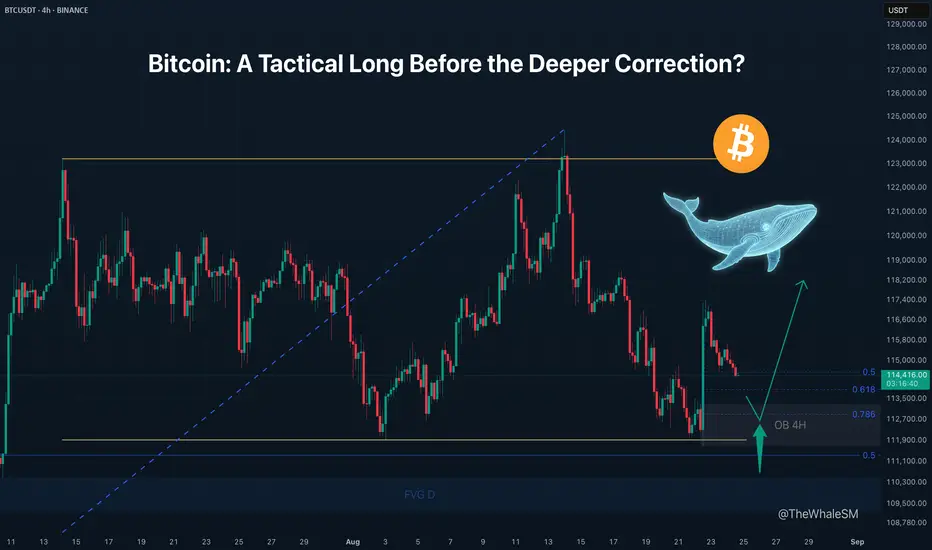
Bitcoin: A Tactical Long Before the Deeper Correction?After the "fake" update of its ATH, the price of Bitcoin confirmed the formation of a range on the weekly/daily timeframe, as it became clear that the new ATH was just a liquidity sweep of the previous one and a deviation at the top of this range.
Before a new, legitimate ATH is formed, I was expecting a correction on the higher timeframe to the levels I described in my previous global Bitcoin analysis: " Bitcoin's Tumble: How Deep Does the Rabbit Hole Go? ". However, Powell's unexpected statement last Friday about a possible interest rate cut in September led to an intensive weakening of the Dollar Index by 1%, pausing Bitcoin's deeper corrective dive and causing its return inside the range.
Just before this news event, the price managed to sweep the external liquidity from the lower boundary of the range (which was essentially a deviation below) and formed a 4H order block in the process. This order block, in conjunction with the 61.8% or 78.6% local retracement levels , can be considered as an intermediate long scenario , with targets at the midline of the range or its upper boundary. I consider the formation of a new ATH from this local POI (the 4H order block) a less probable scenario compared to the instrument still needing a deeper correction first.
The conditions for this local setup to form will be the mitigation of the 4H order block with a concurrent reach of the 61.8% or 78.6% local retracement levels, price finding acceptance above one of them, and the beginning of a bullish order flow on the LTF.
► Invalidation: The invalidation of the long scenario would be a break of the 78.6% level.
► Risk Factor: An important context that could affect the probability of the setup is that liquidity in the form of the Previous Week's Low (PWL) will be formed just below the order block. If the price gets too close to it when reaching the 78.6% level, this liquidity could act as a magnet and pull the price out of the range to the downside, towards the corrective levels from my global analysis.
~~~~~~~~~~~~~~~~~~~~~~~~~~~~~~~~~~~~~~~~~~~~~~~~~~~~~~~~~~~~~~~~~
The principles and conditions for forming the manipulation zones I show in this trade idea are detailed in my educational publication, which was chosen by TradingView for the "Editor's Picks" category and received a huge amount of positive feedback from this insightful trading community. To better understand the logic I've used here and the general principles of price movement in most markets from the perspective of institutional capital, I highly recommend checking out this guide if you haven't already. 👇
P.S. This is not a prediction of the exact price direction. It is a description of high-probability setups that become valid only if specific conditions are met when the price reaches the marked POI. If the conditions are not met, the setups are invalid. No setup has a 100% success rate, so if you decide to use this trade idea, always apply a stop-loss and proper risk management. Trade smart.
~~~~~~~~~~~~~~~~~~~~~~~~~~~~~~~~~~~~~~~~~~~~~~~~~~~~~~~~~~~~~~~~~
If you found this analysis helpful, support it with a Boost! 🚀
Have a question or your own view on this idea? Share it in the comments. 💬
► Follow me on TradingView for timely updates on THIS idea (entry, targets & live trade management) and not to miss my next detailed breakdown.
~~~~~~~~~~~~~~~~~~~~~~~~~~~~~~~~~~~~~~~~~~~~~~~~~~~~~~~~~~~~~~~~~
SUIUSDT: Price Action AnalysisGiven that we had an accelerated move upwards, so it needs a break and correction. It seems that liquidity has not yet been filled at low prices, so it is expected that the trend will start to decline after reaching the 3.75 point and correct to the 3.4 point and continue its growth again.

No Doubt... Bitcoin Pull BackBitcoin is making it's move down for a massive explosion in 2026. watch this and let's see if it plays out perfectly. Follow for more!

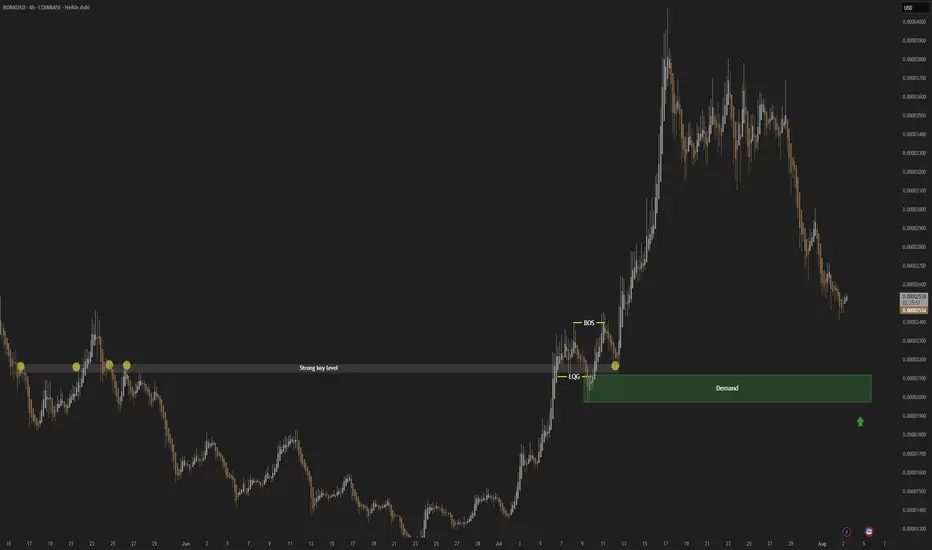
BONK; Heikin Ashi Trade Idea📈 Hey Traders!
Here’s a fresh outlook from my trading desk. If you’ve been following me for a while, you already know my approach:
🧩 I trade Supply & Demand zones using Heikin Ashi chart on the 4H timeframe.
🧠 I keep it mechanical and clean — no messy charts, no guessing games.
❌ No trendlines, no fixed sessions, no patterns, no indicator overload.
❌ No overanalyzing market structure or imbalances.
❌ No scalping, and no need to be glued to the screen.
✅ I trade exclusively with limit orders, so it’s more of a set-and-forget style.
✅ This means more freedom, less screen time, and a focus on quality setups.
✅ Just a simplified, structured plan and a calm mindset.
💬 Let’s Talk:
💡Do you trade supply & demand too ?
💡What’s your go-to timeframe ?
💡Ever tried Heikin Ashi ?
📩 Got questions about my strategy or setup? Drop them below — ask me anything, I’m here to share.
Let’s grow together and keep it simple. 👊
XRPUSDT: Trade 15 minHello, I opened a trade on Ripple, the points where the price is likely to reverse are marked, so in the lower timeframe there is a short-term trend towards gain. Be profitable.

ETH/USD: Could ETH Surge Past $5,000 This Week?Over the next seven days, Ethereum (ETH) is projected to experience moderate bullish momentum, potentially reaching a price range between $4,800 and $5,000.
Currently, ETH is trading at approximately $4,852.49, reflecting a recent uptick of 14.33%. This positive movement is attributed to favorable macroeconomic indicators, including expectations of an interest rate cut by the U.S. Federal Reserve, which has historically supported risk assets like cryptocurrencies.
Technical analysis suggests that ETH is trading above key support levels and is approaching resistance zones. If the price breaks through these resistance levels, it could pave the way for further gains. Conversely, a failure to maintain upward momentum may lead to a consolidation phase or a slight pullback.
Market sentiment remains cautiously optimistic, with institutional interest continuing to grow. However, investors should remain vigilant, as the cryptocurrency market is known for its volatility and susceptibility to sudden shifts in sentiment.
In summary, ETH is poised for potential gains over the next week, but market participants should stay informed and prepared for any unforeseen developments that could impact price movements.

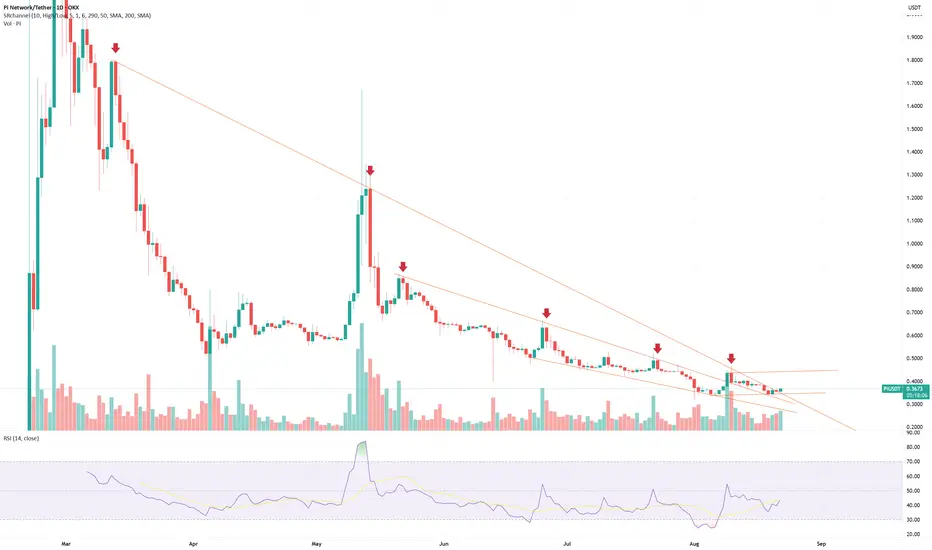
PI/USDT - Daily - BreakoutThe PI/USDT pair on the Daily timeframe presents a Potential Buying Opportunity.
Target Levels:
1st Resistance – 0.4430
2nd Resistance - 0.5850
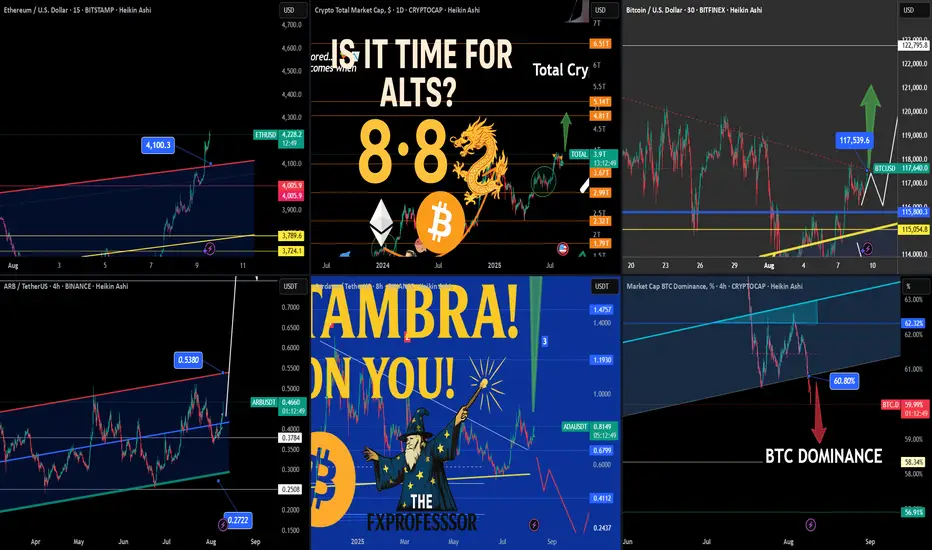
Today’s Crypto Market – From Ethereum Strength to ALTS Setup📅🔥 Today’s Crypto Market – From Ethereum Strength to ALTS Setup 🚀💡
In today’s market update video, we broke down what could be the critical handoff from Ethereum’s dominance to a broader ALT season.
The sequence is clear:
1️⃣ Bitcoin led the way.
2️⃣ Ethereum took control, smashing through $4,100.
3️⃣ Altcoins now have the setup to run, with BTC dominance breaking lower.
🎯 Key Levels from Today’s Charts:
Ethereum (ETH/USD) – $4,222 with breakout above $4,100.3; upside targets $4,420 – $4,800; supports at $4,005.9 and $3,789.6.
Bitcoin (BTC/USD) – Breaking out from wedge at $117,500; supports $115,803 & $115,054; upside potential to $120K+ and $122,795.8.
ARB/USDT – Rebound from $0.3784 aiming for $0.5380; key support $0.3500 and $0.2722.
Cardano (ADA/USDT) – At $0.8131; resistance $1.1930, then $1.4757; support $0.6799, $0.4112.
BTC Dominance – Breakdown under 60.80%, supports 58.34% & 56.91% — historically a strong trigger for ALT rallies.
📽️ Full breakdown and reasoning are in today’s video — we looked at why BTC dominance losing support is the green light for possible sector rotation, and which alts are primed.
One Love,
The FXPROFESSOR 💙
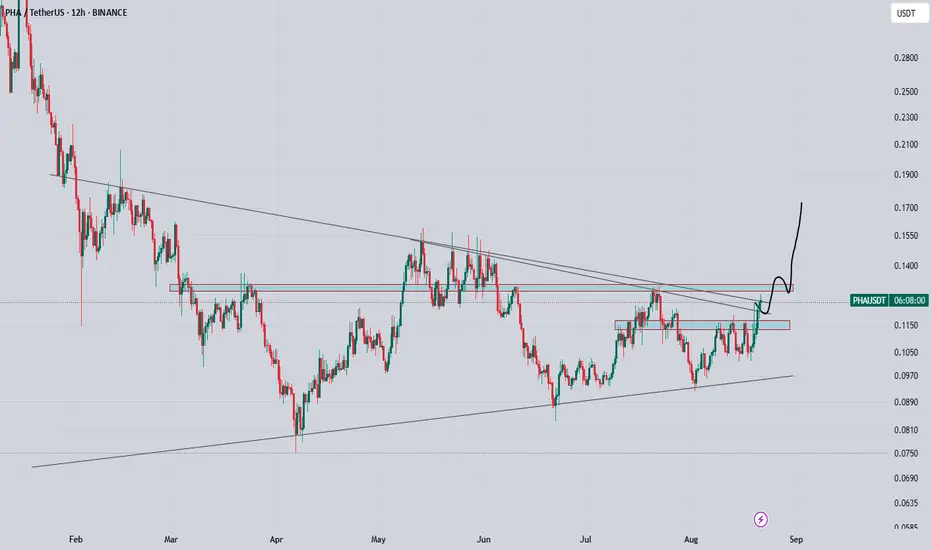
Pha finally on verge of breakout consolidating within symmetrical triangle from long time, now trying to clear these multiple lines, as long as its holding 0.11 area. i will remain bullish and after breakout it can give solid rally, expecting 2x in coming days
Is ALT-season coming soon?Bitcoin’s supply schedule is punctuated by four-year “ halvings ,” where miner issuance is cut in half. Historically, the post‑halving window has coincided with the strongest phase of the cycle as tightening new supply meets rising demand. Liquidity first concentrates in Bitcoin, pushing dominance higher and volatility lower relative to alts. ALT‑season tends to appear later—often after a Bitcoin top or during a prolonged consolidation—when risk appetite broadens, profits rotate into higher‑beta assets, and narratives fragment across sectors. The featured chart compares prior cycles and frames where we might be within the current one.
Where we are in the 2024 halving cycle
At this stage, Bitcoin may be close to a cyclical high—or may already have set it—but confirmation is lacking. Altcoins have rallied meaningfully, yet at a top‑down level there isn’t decisive evidence of a new, durable alt‑season. Key confirmations I’m watching:
• CRYPTOCAP:TOTAL2 breaking out of large cup-and-handle formation.
• 1/ CRYPTOCAP:BTC.D CRYPTOCAP:OTHERS trending up together (alts outperforming BTC both broadly and at the margin).
TOTAL2 — Cup & Handle setup
The weekly structure in CRYPTOCAP:TOTAL2 (crypto market cap excluding BTC) resembles a maturing cup‑and‑handle. What I’ll need to see:
A weekly close above the cup’s rim with follow‑through the next week. Moreover, we need to see a weekly close above the prior 2 highs, which currently could be a double top.
Momentum has been on the decline since the rally on alts started in earnest earlier this year...
OTHERS/BTC — rotation breadth check
This ratio (total market cap excluding the top‑10, divided by BTC) gauges whether capital is rotating into the long‑tail (more speculative / smaller ALTs).
It looks like this could have fallen below long term support which suggests the lower quality ALTs may have permanently lost value against BTC during this cycle. That would be reasonable considering there are so many coins now, many of which will likely fade into dust.
1/BTC.D — macro rotation proxy
The inverse of Bitcoin dominance (1 divided by BTC.D) visualizes altcoin outperformance over the longest available history. Here we can see a recent breakout from a downward trend channel, which is definitely auspicious!
Altcoin spotlights (examples & placeholders)
Replace with your chosen set; keep a mix of large‑caps, infra, and high‑beta to illustrate breadth.
• BINANCE:ETHBTC — let's see a new ATH! There's been a blistering rally, tripling from a rough patch earlier in 2025, but momentum still needs to improve. Also concerning is a major drop off in volume in recent years.
• BINANCE:SOLBTC — Solana had an insane 10x rally early in the cycle, but looks like it could be cooling off with the makings of a head & shoulders amidst declining volume.
• BINANCE:LINKBTC — Chainlink has seen a strong price pump in recent weeks, but like Solana appears to have fading momentum. Unless something changes, it's hard to see it moving materially higher during this cycle.
• BINANCE:XRPBTC — put up a mind blowing vertical 5x rally in late 2024 / early 2025. Like Solana and LINK, it shows declining momentum, so it could very well have peaked for the cycle.
• BINANCE:DOGEBTC — ostensibly the original meme coin, unlike the more practical ALTs we've reviewed DOGE looks to have gas in the tank. Strangely it looks best poised for a breakout given historical pricing and momentum.
Analysis recap
Unfortunately there are both bullish and bearish signals making it hard to lean one way or another right now. In summary:
BITSTAMP:BTCUSD - 2024 halving cycle
• looks close to complete, we may have already seen the top for the cycle
• prior cycles have been a few weeks longer since the halving so there could be a bit further to go
• during the past 2 cycles ALTs have topped once before (2016 cycle), and once after (2020 cycle) the Bitcoin top, which doesn't help us in predicting the outcome of the third (current) cycle.
High-level analysis
CRYPTOCAP:TOTAL2 - cup & handle -- bullish
CRYPTOCAP:OTHERS - break below long term support -- bearish
1/ CRYPTOCAP:BTC.D - breakout of downward trend channel -- bullish
Individual coin analysis
BITSTAMP:ETHUSD COINBASE:SOLUSD COINBASE:LINKUSD BITSTAMP:XRPUSD - all of these coins are technically neutral to bearish in my view, and they are heavyweights.
COINBASE:DOGEUSD - shockingly bullish! Given that this is the epitome of a meme coin, maybe it means animal spirits are lurking in the shadows. It's hard to imagine DOGE pumping without the other coins we've looked at joining the party.
Personal thoughts
I decided to take a hard look at the prospects of an ALT-season to form my own opinion, mainly because I heard someone make a dismissive statement that "ALT-season always follows a Bitcoin top", or something to that effect. I think you can see it's not nearly that simple. Personally I think the market is pretty frothy, and risk assets could take a beating in the coming months. Just in case though, I've still got the XRP moon bag!

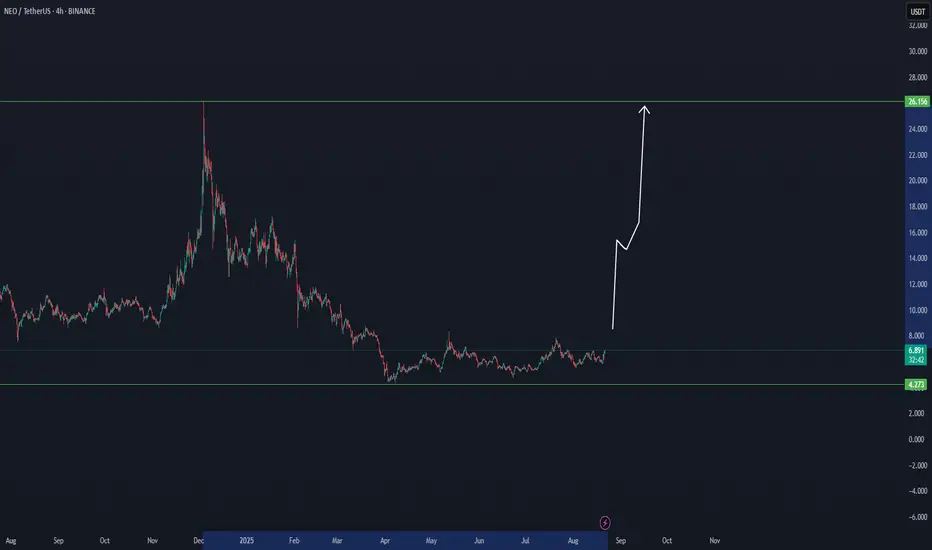
NEO IS COMING BACK FROM 262 DAYS FOR NEW INCREASENEW looks depending low time frame, interesting for day trade, which allows it same time to become a follow coin.
NEO is one of the best coins at this moment to follow for confirmations.
BTC Game PlanBTC Game Plan
📊 Market Sentiment
Overall sentiment remains bullish, supported by expectations of a 0.25% rate cut in the upcoming FOMC meeting. A weakening USD and increasing global risk appetite are creating favorable conditions for further upside in crypto assets.
📈 Technical Analysis
Price is currently retracing lower after printing new all-time highs.
It is moving toward the 112,000$ level, which contains significant liquidity. Therefore, I expect a strong bounce from that zone.
Additionally, price is approaching the equilibrium level (0.5 Fibonacci), which represents a discount for me.
📌 Game Plan
I expect price to retrace to the 111,316$ level and bounce from there.
🎯 Setup Trigger
I will be watching the 4H market structure for confirmation before initiating a position.
📋 Trade Management
Stoploss: 4H swing low confirming the BOS
Targets:
TP1: 118,446$
TP2: 124,351$
💬 Like, follow, and comment if you find this setup valuable!
⚠️ Disclaimer: This content is for informational and educational purposes only and does not constitute financial, investment, or trading advice. Always do your own research before making any financial decisions.

“Bitcoin (BTC/USD) – Ascending Support Holding,Eyes Set on $119KChart Analysis
Price Structure & Pattern
The chart shows Bitcoin (BTC/USD) on a 30-minute timeframe, revealing a rising support trendline—price has rebounded from this upward-sloping base.
Previously, price formed a rising green channel, climbed toward the resistance zone near $119K, but was drawn back—creating a consolidation beneath that key level.
A horizontal resistance line at $119,582.80 marks a crucial ceiling. The drawn blue arrow suggests a potential bounce from trendline support aiming to test that resistance again.
Key Technical Levels
Support: The ascending trendline acts as dynamic support—if it holds, it may support another test of resistance.
Resistance: The $119K area remains a key barrier. Breaking above this level could be a strong bullish trigger.
Broader Technical Context & Market Sentiment
From recent technical insights and market commentary:
Resistance at $119K and Beyond
Analysts note Bitcoin is testing long-term resistance near $119K, a level tying back to major peaks. A breakout could catalyze a renewed bullish momentum
AInvest
+1
Brave New Coin
.
Described by some as a descending wedge or consolidation, this structure suggests a potential breakout toward $123K–$125K if $119K is breached with conviction
AInvest
Brave New Coin
.
Support & Consolidation
BTC has been channeling between roughly $116K support and $119K resistance, setting up a tightening range ripe for breakout
Brave New Coin
TradingView
+1
.
Short-term support zones near $115K–$116K align with buyers stepping in, and a hold above these levels supports bullish continuation
TradingView
Mitrade
.
Technical Sentiment & Momentum
Key resistance around $118.6K–$119K is underscored by moving averages and trendlines, with MACD and RSI metrics still nudging upward on hopes of a breakout
Mitrade
.
Some analysts highlight a cup-and-handle pattern and potential for a 14% rally toward $134.5K if price breaks through and sustains above current highs
Business Insider
.
Summary Table
Zone Description Potential Impact
Ascending Trendline Support Price recently bounced here Offers a base for bullish continuation
$119K Resistance Established ceiling of current range Breakout could fuel a rally to $123K–$125K
$115K–$116K Support Lower bound of consolidation Holds the structure—break below could trigger deeper pullback
Final Thoughts
Your chart beautifully captures BTC’s moment of decision—riding support and potentially preparing for another rally attempt at $119K. Watch for:
Bullish scenario: A bounce off the ascending support trendline, followed by clear volume-backed break above $119K—opening a path to $123K+.
Bearish scenario: A failure at resistance leads to trendline breach, risking a slide back toward the $115K or lower support zones.

LinkUSDT: Elliot Waves AnalysisHello friends, I have opened such a trade on the LINK currency. The strategy is based on Elliott waves and price action. I hope you can be profitable.
