ADAUSDT – Daily Chart. ADAUSDT – Daily Chart.
Macro downtrend intact (descending channel)
The price is sitting at a major HTF demand level after a prolonged sell-off.
Selling momentum is exhausting near channel support
Price is compressing → base formation possible
This zone often leads to sideways accumulation before expansion
Support: 0.35 – 0.32 (critical demand zone)
Invalidation: Below 0.30
First Resistance: 0.48 – 0.52
Major Supply: 0.70 – 0.82 (previous value area)
In Extreme Fear, strong coins usually move sideways at support to absorb sell pressure before trend reversal.
No blind longs. Wait for structure shift + volume confirmation.
DYOR | NFA
Cryptosanders

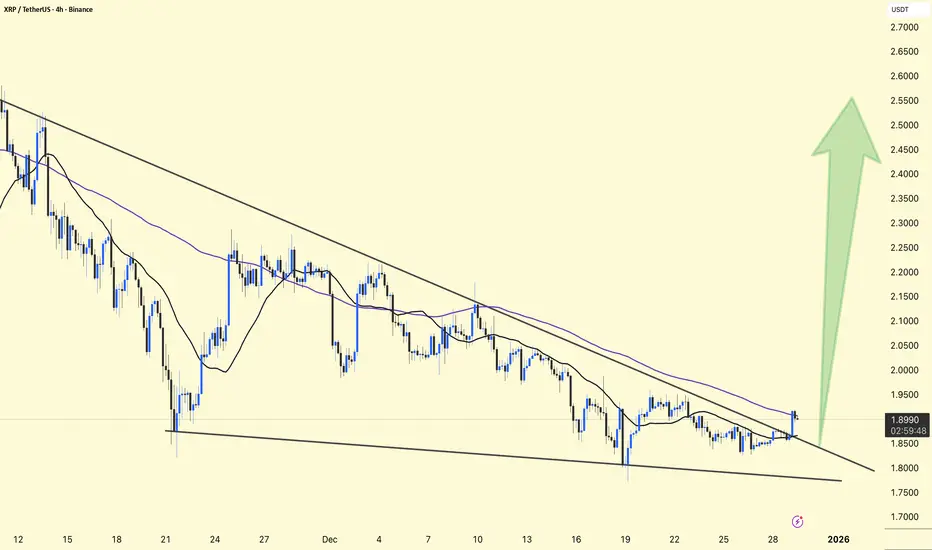
XRPUSDT – 4H Chart UpdateXRPUSDT – 4H Chart Update
XRP remains within a descending channel, but the price is pressing against the upper trendline, indicating compression near resistance.
Price just tested the 100 MA; momentum is trying to shift short-term.
Support: 1.88 – 1.85
Major Support: 1.78 – 1.75
Resistance: 1.95 – 2.00
Breakout Zone: 2.10 → 2.40+
Lower selling pressure and a tight range near the trendline create a decision zone.
A 4H close above $2.00 can trigger a fast upside move. Rejection keeps range-bound action.
⚠️ Wait for confirmation, no blind entries.
DYOR | NFA
USDT Dominance – Chart Update and Analysis. USDT Dominance – Chart Update and Analysis (Weekly)
Current Level: ~6.32%
Structure: Rising Wedge / Long-Term Compression
USDT dominance is trading within a contracting wedge.
The price is approaching the upper trendline resistance (Zone 3).
Previous tops (1 → 2 → 3) show lower highs → upward momentum is weakening.
Rejection near the upper trendline would be bullish for BTC and Altcoins.
Clean breakout + hold above resistance = temporary risk-off / market pullback.
Resistance: 6.4% – 6.7%
Support: 4.8% – 5.0%
Rejection from resistance → relief for Altcoins.
Invalidation: Strong weekly close above the wedge → caution on long positions.
⚠️ Use USDT dominance in conjunction with the BTC chart + TOTAL market cap for confirmation.
This is not financial advice | Manage your risk.

DOGEUSDT – 4H Chart UpdateDOGEUSDT – 4H Chart Update
Still bearish, but momentum is weakening
The price is holding a strong demand zone (0.120 – 0.115) after a prolonged downtrend.
Descending trendline is being tested
Volatility compression near support → decision zone
Repeated rejections from lower levels show selling pressure exhaustion
Support: 0.120 – 0.115 (critical)
Invalidation: Below 0.112
Resistance: 0.135 – 0.150
Breakout zone: 0.160+ → opens room toward 0.20
⚠️ Extreme fear environment = patience > prediction
DYOR | NFA

BNBUSDT – 4H Chart Update. BNBUSDT – 4H Chart Update.
Price is moving inside a descending channel, but holding the rising demand zone.
Short-term MA curling up; price trying to reclaim the 100 MA.
Support: 820 – 800 (major demand)
Immediate Support: 840 – 830
Resistance: 880 – 900 (trendline zone)
Breakout Zone: 920 – 1,000+
Higher low formed from demand + compression = potential base building.
A clean 4H close above 880–900 can open room for upside expansion.
⚠️ Wait for confirmation, avoid chasing.
DYOR | NFA

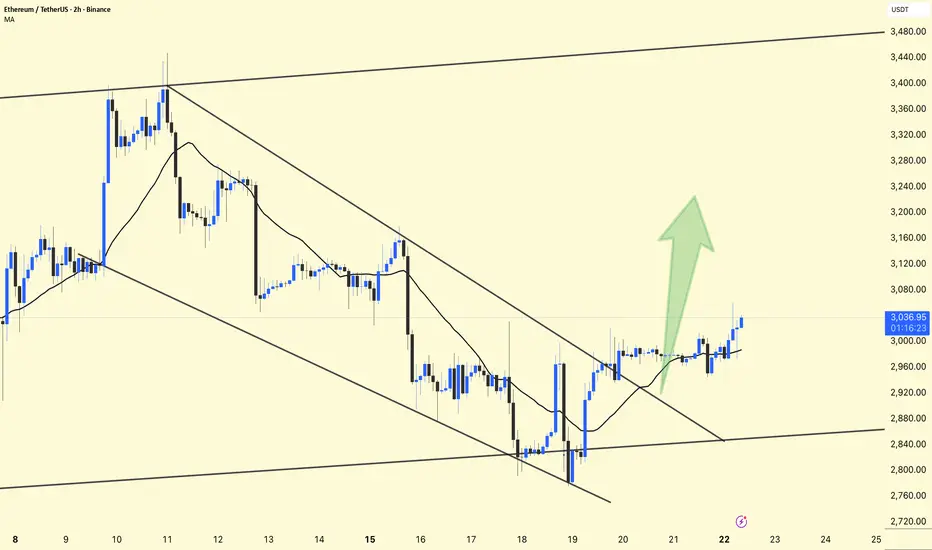
ETHUSDT – 4H Chart Update. ETHUSDT – 4H Chart Update.
Structure: Price is compressing inside a descending wedge, trading near the lower trendline → selling pressure is weakening.
Price reclaimed the short-term 21MA and is testing the 100 MA area — a key decision zone.
Support: 2,900 – 2,880
Resistance: 3,080 – 3,120
Breakout Zone: 3,250 – 3,350+
Sideways grind near support + compression = energy building.
Wait for a clear 4H close above the descending trendline for continuation.
This is a confirmation zone, not a blind entry area.
DYOR | NFA

BTCUSDT – 4H | Chart Update. BTCUSDT – 4H | Chart Update.
BTC is compressing inside a symmetrical triangle (lower highs + higher lows). This is a classic volatility squeeze before expansion.
Strong buyer reaction seen multiple times near 85.8k – 84.6k (green circles)
Rising trendline support is still respected.
93.5k – 94k remains a heavy rejection area
Price needs a clean breakout to unlock upside
Price is trying to reclaim short-term MA
Sustained hold above trendline + MA = bullish confirmation
Above 89–90k → breakout attempt toward 93k+
Below 85.8k → deeper pullback toward 82.2k
This is a decision zone. Structure favors upside only after confirmation.
Small update • Big move loading
DYOR | NFA

BTC Dominance (BTC.D) – Weekly Chart BTC Dominance (BTC.D) – Weekly Chart | Full Details (with 25MA and 100 MA)
BTC.D is trading within a long-term descending channel. After a strong recovery from the 2022 lows, the dominance is now stalling near the mid-range resistance (~59–60%).
25 MA: Tracks short-term momentum
BTC.D is hovering around/slightly below the 25 MA.
100 MA: The price is still above the 100 MA, meaning the overall BTC dominance trend has not yet broken down.
A break below the 100 MA would signal a significant shift towards altcoin strength.
This is a decision zone.
BTC dominance is not yet bearish, but the strength of the uptrend is weakening.
Keep a close eye on the MA — they will guide the next move.
DYOR | NFA

SOLUSDT – 4H Chart Analysis. SOLUSDT – 4H Chart Analysis.
SOL is trading inside a descending wedge/compression zone
Price is hugging the lower trendline, indicating that selling pressure is losing strength
Volatility has contracted, hinting at a decision move soon
Support:-
120 – 118 → Immediate support
112 – 110 → Major demand/breakdown level
108 → Last HTF support if panic expands
Resistance:-
126 – 128 → First resistance
132 – 135 → Trendline resistance
140+ → Breakout continuation zone
During Extreme Fear, assets often move sideways near support to absorb sell pressure before direction expansion.
This is a wait-for-confirmation zone, not a blind entry area.
DYOR | NFA

ETHUSDT – 4H Chart UpdateETHUSDT – 4H Chart Update
ETH is compressing near the lower trendline of a rising channel, showing loss of momentum but no breakdown yet.
Price holding ~2,900 support
Trading below short-term MA → consolidation phase
Structure suggests base building rather than distribution
Support: 2,900 – 2,850
Strong Support: 2,700 – 2,750
Major Support: 2,500
Resistance: 3,000 – 3,050
Supply: 3,300 – 3,400
If 3,050 breaks: momentum can expand toward 3,300+
If 2,850 fails, the price may revisit 2,700
Extreme Fear + channel support often hints at quiet accumulation.
DYOR | NFA

BTCUSDT –Chart Analysis (4H)BTCUSDT –Chart Analysis (4H)
BTC is coiling inside a tightening range — lower highs vs higher lows. This type of compression usually leads to a sharp directional move.
Price is respecting the rising base around 85k
Every dip into the green zones shows buyer absorption
Sellers are active below 89k, keeping pressure from above
Support: 85,800 – 84,600
Major Support: 82,200
Resistance: 88,800 – 89,500
Supply Zone: 93,500 – 94,000
When price holds support during Extreme Fear, it often means weak hands are exiting while stronger players accumulate quietly.
DYOR | NFA

BTC/USDT – 4H Chart Update. BTC/USDT – 4H Chart Update.
Price swept liquidity near 84.5K and bounced → classic fake breakdown.
Still moving inside a descending channel.
84.5K = key support (holding keeps bounce valid).
82.2K = invalidation level if support fails.
Resistance: 88K → 92K–94K supply zone.
Neutral to slightly bullish as long as 84.5K holds.
Reclaim above 88K = upside continuation possible.
Below 84.5K = deeper pullback risk.
Not financial advice. Manage risk.

FET/USDT – Long Trade Setup (Daily)FET/USDT – Long Trade Setup (Daily)
Price forming a base after a strong downtrend
Falling wedge/compression near support
Price below cloud, but selling pressure weakening
Long Plan
Entry Zone: 0.19 – 0.205
Stop Loss: 0.1840
Targets:
T1: 0.26
T2: 0.32
T3: 0.37+
DYOR | NFA

MANTA/USDT – Long Trade Setup (4H)MANTA/USDT – Long Trade Setup (4H)
Structure: Descending wedge/trendline compression
Ichimoku: Price pushing back into the cloud → momentum stabilizing
MA acting as dynamic support
Long Idea
Entry Zone: 0.0725 – 0.0730
Stop Loss: 0.070
Targets:
T1: 0.0760
T2: 0.0790 – 0.0800
DYOR | NFA

BTCUSDT – 4HChart AnalysisBTCUSDT – 4HChart Analysis
Structure: Price is still following a descending channel
Ichimoku: Price is hovering around the cloud → Range and uncertainty
Strong Demand Zone: 84,600 (Multiple reactions → Buyers active)
Dynamic Resistance: Falling trendline near 88,800 – 89,300
Lower Highs → Sellers are capping rallies
Bullish Relief: Sustaining above 84,600 + Breaking 89K → Move towards 91K – 92K
Bearish Continuation: Loss of 84,600 → Next target 82,200
Consolidation phase within a downtrend. Be patient — only trade on breakouts or support confirmations.
⚠️ No FOMO. Risk management first.

ETHUSDT – 4H Chart Update. ETHUSDT – 4H Chart Update.
Lower highs, descending trendline still active
ETH rejected from the trendline near 3,350–3,400
Price below cloud → bearish / consolidation phase
Holding around 2,930
Immediate Support: 2,880 – 2,900
Major Support: 2,700 – 2,750
Resistance: 3,050 – 3,120
Major Resistance: 3,350 – 3,400
Above 3,120 → short-term bullish relief toward 3,300+
Below 2,880 → risk of move toward 2,750
Until the breakout, range & patience are best
⚠️ Trend is still weak — trade only with confirmation & strict risk management.

BTCUSDT – 4H Chart Update. BTCUSDT – 4H Chart Update.
Price is still inside a descending channel
Strong sell-off again from trendline + Ichimoku cloud Current Price: ~87,200
Strong Support: 84,600
Next Support: 82,200 if 84.6k breaks
Resistance: 88,800 – 89,500
Major Supply: 93,500 – 94,000
Hold above 84,600 → range bounce possible
Break below 84,600 → bearish continuation risk
Trend flips bullish only above descending trendline + cloud
⚠️ Market still corrective. Wait for confirmation — no FOMO.

ETHUSDT – 4H Chart ETHUSDT – 4H Chart
Structure: Falling channel intact
Trend: Range-bound with mild bearish pressure
Ichimoku: Price inside/below cloud → trend still weak
MA: Price is struggling around the moving average
Support: 2,880 – 2,900
Major Support: 2,780 – 2,800
Resistance: 3,050 – 3,120 zone
A clear break & hold above 3,120 can open upside toward 3,300+.
Below 2,900, downside retest of 2,800 remains possible.
⚠️ Wait for confirmation — ETH is still consolidating. Manage risk.

BTCUSDT – 4H Chart Update. BTCUSDT – 4H Chart Update.
Falling channel breakout confirmed
Short-term bullish while holding above channel & MA Ichimoku: Price pushing into/above cloud → momentum improving
Support: 87,800 – 88,200
Major Support: 84,600
Resistance / Target: 93,500 – 94,000 zone
As long as BTC holds above 88k, upside continuation is likely toward the 94k supply zone. Any pullback above support can be a healthy retest.
⚠️ Break below 87.5k may delay bullish move. Manage risk.

ETHUSDT – Chart Update ETHUSDT – Chart Update
ETH was moving inside a descending channel, now showing signs of reversal.
Price has broken the channel trendline and is holding above the short-term MA.
Momentum is slowly shifting bullish.
Support: 2,980 – 2,950
Major Support: 2,880
Resistance / Targets: 3,120 → 3,200 → 3,280
Bullish above 2,980 with confirmation.
⚠️ A pullback retest is healthy; avoid chasing.
Not financial advice. Trade with risk management.
BTCUSDT (4H) —Chart Update BTCUSDT (4H) —Chart Update
The price is still moving within a descending channel. The recent bounce came from the lower support zone (~84.6K).
Current Price: ~$ 88,100, trading below the upper trendline; the trendline is acting as resistance.
Support: 87.0K – 86.5K, main 84.6K
Resistance / Breakout Zone: 88.8K – 89.5K
Main Supply: 93.5K – 94.0K
Bullish Scenario:
A clear 4H close above the upper trendline + 89K could open up a move towards 91K → 93–94K.
Bearish Scenario:
Rejection from the trendline could lead to a pullback towards 86.5K, and if broken → a further move down to 84.6K is possible.

BTCUSDT (4H) — Chart UpdateBTCUSDT (4H) — Chart Update
Price is still inside a descending channel, but momentum is improving.
Support: 84.5K (strong reaction zone, buyers defended well)
Current: ~88.2K, testing the upper trendline
Break & hold above trendline: Opens path toward 92K – 94K (major supply zone)
Rejection from trendline: Pullback possible toward 86K → 84.5K again
This is a decision zone. Confirmation is needed — don’t front-run.
Trade with confirmation & proper risk management.

#BNBUSDT (4H) — Chart Update#BNBUSDT (4H) — Chart Update
Current Price: ~852 USDT
Major Support: 820–830 (rising trendline + demand zone)
Immediate Resistance: 860–880
Major Resistance Levels:
919 USDT
1,014 USDT
1,060 USDT
Price respected the ascending base and printed a bounce from demand.
Short-term structure is recovering, but still below key resistances.
The projected path suggests a higher-low formation if support holds.
Bullish: Hold above 820–830 → push toward 880 → 919.
Strong Breakout: Acceptance above 919 opens 1,014 → 1,060 zone.
Bearish: Lose 820 → structure weakens, deeper pullback risk.
⚠️ Note: Wait for confirmation above 880 / 919 for safer longs.
Risk management is key.
