Will #XRP Finally Recover or Is This Just Another Trap? Yello Paradisers! Are you keeping your eyes on #XRP? While most traders are zoning out, the next move might catch the crowd sleeping. Let's view #Ripple trading setup:
💎Over the past few weeks, #XRPUSDT has been trading inside a textbook falling wedge pattern on the 4H chart. Just recently, we saw a liquidity sweep below the descending support trendline, an early signal that smart money could be accumulating before a breakout move.
💎The price is currently hovering just above a strong demand zone around $1.73, with a clear descending resistance capping price action. A clean breakout above that resistance, especially if followed by a successful retest and the 50EMA flipping into support, would significantly boost the probability of a bullish move.
💎If this scenario plays out, the first minor resistance for #XRPUSD stands near $1.95, which could act as an initial profit-taking zone. Beyond that, momentum could accelerate toward $2.1951, marked as moderate resistance. But the ultimate upside target is at $2.4175, a strong resistance level with a high volume node, where aggressive sellers are likely to show up.
💎However, caution is key here. If #XRP fails to hold above the current support zone and closes below $1.7366, the bullish setup would be invalidated. That would likely trigger more downside toward $1.70 and possibly lower, especially as weak hands start exiting the market.
Trade smart, Paradisers. This setup will reward only the disciplined.
MyCryptoParadise
iFeel the success🌴
Cryptosignals

XLM Is Breaking Out...Are You Ready Before the Real Move Starts?Yello Paradisers! Are you paying close attention to this one? Because #XLM just made a critical structural shift and if you're not watching it closely, you might miss one of the cleanest breakout setups we’ve seen lately. #XLM has officially broken out of its descending resistance, and that same line is now acting as new support a classic confirmation that the market dynamic has shifted. What makes this move more significant? The breakout of selling climax occurred with a momentum candle, which increases the probability that institutional buyers are stepping in. This is the phase where smart money prepares for the next leg.
💎#XLM broke above the upper trigger line of the selling climax with a momentum candle a high-probability setup that big players are entering during the retracement phase. This type of breakout pattern often precedes strong upside continuation. The current probability for upside target sits at 2530, a major resistance level and potential reaction zone. If momentum sustains, this is where price could be heading next.
💎#XLM descending resistance was broken, and it’s now acting as new support, also there is a major structural shift and momentum shift that often precedes sharp upside moves when we look at price action.
💎#XLM holds momentum within the demand zone, the setup remains high probability targeting an initial upside move toward 2325, a key moderate resistance and structural level.
💎If #XLM fails to hold bullish momentum and a momentum candle closes below 1960, the current bullish probability becomes invalid. In that case, we could see further downside pressure.
That is why Paradisers, we are playing it safe right now. If you want to be consistently profitable, you need to be extremely patient and always wait only for the best, highest probability trading opportunities only on confirmations.
MyCryptoParadise
iFeel the success🌴

CTK Prepping for a Monster Move? Breakdown or Breakout Yello Paradisers! Are you about to catch one of the cleanest reversals of the month, or will you watch CTK take off without you?
💎#CTKUSDT is currently forming a textbook falling wedge pattern. The price has now reached the bottom of this wedge and is sitting directly inside the major support zone between 0.2300 and 0.2400. This is the same area where previous reactions triggered strong upside momentum, and once again, buyers seem to be defending it.
💎What makes this setup more interesting is the clear bullish divergence forming on the MACD. While the price has been making lower lows, the indicator is printing higher lows, which shows that bearish momentum is fading. This divergence, combined with the falling wedge support, gives us a strong probability of an upside breakout in the short term.
💎If the wedge breaks to the upside, the next target is the minor resistance level at 0.2813. That’s the first area where profit-taking might occur. But if bulls manage to reclaim that zone, the strong resistance cluster around 0.3673 to 0.3765 becomes the next magnet for price. This area aligns with previous supply zones and volume profile resistance, so it won't be easy to break, but if momentum carries, it could be a major move.
💎On the flip side, if CTK closes below 0.2124, the entire bullish setup is invalidated, and a deeper correction becomes likely. That’s our invalidation zone, lean, clear, and non-negotiable.
Strive for consistency, not quick profits. Treat the market as a businessman, not as a gambler.
MyCryptoParadise
iFeel the success🌴

#BNB at the Edge: Breakdown Confirmed with RSI Divergence
Yello Paradisers! Have you seen what just happened with #BNB? After weeks of upward momentum, BNB has broken down from its ascending channel — and this move might just be the start of a much bigger shift in trend.
💎#BNB clean break of the trendline connecting wave 2 and wave 4 in the Elliott Wave structure — a textbook sign that the motive wave sequence may have completed. Adding to this, there’s a clear bearish divergence between wave 3 and wave 5 within the ascending channel, signaling fading momentum. This move is also part of a much larger ascending structure on the higher timeframes, making the breakdown even more meaningful. Importantly, it was accompanied by a clear structure shift (CHoCH), confirmed by strong volume and a bearish RSI divergence — all pointing toward high-probability trend reversal conditions.
💎Right now, minor support is being tested near the larger ascending channel’s trendline at $850. Below that, major support sits around $820 — the previous swing low from which the last bullish leg began. This is a key zone, and a breakdown below it could accelerate the selloff and firmly shift sentiment to the bearish side.
💎On the upside, major resistance remains around $960. In addition, the Fibonacci resistance zone between 0.618 and 0.786 will act as a critical battleground. We expect this area to be a key decision point, where bulls and bears will fight for short-term control of the trend.
We are playing it safe right now, Paradisers. If you want to be consistently profitable, you need to be extremely patient and always wait only for the best, highest probability trading opportunities — only on confirmations.
MyCryptoParadise
iFeel the success🌴

ETH — Higher Lows Building Above 3K. Dip or Breakdown Signal?Since the low near 2600 in late November last year, Ethereum printed a strong initial leg higher toward 3500. More importantly, the market established a very solid floor just under the psychological 3000 level.
Since the end of last year, ETH has been gradually forming:
✅ higher lows
✅ higher highs
…a structure that supports the idea of further upside continuation.
🔎 Today’s Move: Drop, But No Technical Damage
Today’s Asian session opened with a downside move. However, this drop has not violated:
- the recent trendline support
- the key horizontal support zone
For now, this looks more like a pullback within an emerging bullish structure, not the start of a new bearish leg.
📌 Outlook & Levels
In my view, this pullback may provide a decent opportunity to position for another leg higher, potentially targeting:
➡️ 3500
➡️ and even 3700 in the next period
That said, one level must remain intact.
⚠️ Negation Level
If ETH loses the 3050–3100 zone, then the probability shifts toward:
❗ resumption of the longer-term bearish trend
✅ Conclusion
Until that breakdown happens, my idea is simple:
👉 Buy dips, as long as structure holds. 🚀

OKB Traders Are Being Set Up Is This the Final Trap Before DropYello Paradisers! Are you watching what’s happening with #OKB right now? Because this move might be the last warning before a much deeper drop. We’ve spotted a series of red flags, and the chart is speaking loud and clear smart money is positioning, and it’s not on the bullish side, Even more importantly, #OKB swept the upper trigger line of buying climax. The price action on higher time frames shows a clear bearish structure there is a major probability for the downside move.
💎#OKB respected the descending resistance and failed to break above it, which confirms ongoing weakness. #OKB momentum has now clearly shifted to the downside and mitigate the fair value gap, as long momentum sustained within the supply zone, we can expect a further move down toward the minor support level of 109.
💎#OKB swept the upper trigger line liquidity of the buying climax, strongly suggesting that institutional players are offloading and preparing for more downside move according to volume spread analysis (VSA).
💎#OKB swept buy side liquidity with upthrust test which confirmed the weakness, if momentum holds, the next major target sits around 106 that could be tested soon.
💎If #OKB manages to break above the key resistance at 120.6 with a strong momentum candle, this whole bearish probability would be invalidated, and we could instead see a bullish continuation. As always, we let price confirm our bias.
Discipline is key, Paradisers! The charts may look volatile, but this is where professionals thrive and amateurs panic. Don’t let emotions guide your trades. Wait for clear confirmation and manage risk like a pro. Strive for consistency, not quick profits. Treat the market as a businessman, not as a gambler.
MyCryptoParadise
iFeel the success🌴

NEAR Traders Are Being Set Up Is This the Final Trap Before DropYello Paradisers! Are you watching what’s happening with #NEAR right now? Because this move might be the last warning before a much deeper drop. We’ve spotted a series of red flags, and the chart is speaking loud and clear smart money is positioning, and it’s not on the bullish side.
💎#NEAR respected the descending resistance and failed to break above it, which confirms ongoing weakness. The price action on higher time frames shows a probable bearish structure there is a major probability for the downside move., further we have seen a clean divergence as well, as long momentum sustained within the supply zone, we can expect a further move down toward the support level of 1.616, which aligns both as a structure level and a moderate demand zone.
💎#NEAR broke lower trigger line of the buying climax (climactic action bar) with a strong momentum candle after swept the upper trigger line of buying climax. strongly suggesting that institutional players are offloading and preparing for more downside move according to volume spread analysis (VSA). We’ve seen a buying climax on the retracement, followed by a climactic action candle with ultra-high volume a textbook probability of smart money distribution.
💎If momentum holds, the probability of next major level sits around 1.49, which is a major support level that could be tested soon.
💎If #NEAR manages to break above the key resistance at 1.91 with a strong momentum candle, this whole bearish probability would be invalidated, and we could instead see a bullish continuation. As always, we let price confirm our bias.
Discipline is key, Paradisers! The charts may look volatile, but this is where professionals thrive and amateurs panic. Don’t let emotions guide your trades. Wait for clear confirmation and manage risk like a pro. Strive for consistency, not quick profits. Treat the market as a businessman, not as a gambler.
MyCryptoParadise
iFeel the success🌴

FARTCOIN/USDT Forming a Bullish Pattern, Rebound or Broke here!#FARTCOIN is currently holding a major support zone after a long downtrend. Price is now forming an ascending triangle, showing higher lows while facing a clear horizontal resistance above
This tells us one thing: pressure is building. Buyers are stepping in earlier each time, but sellers are still defending the same area
If price can break and hold above this resistance, the structure shifts bullish and opens room for a strong expansion move 🚀
However, if the ascending support fails, price could dip back into the major support zone for another test

DAM/USDT: Analyzing the Accumulation Floor & Asymmetric UpsideThe Macro Context After a prolonged correction phase (-69% YTD), DAM (Datamine) appears to be establishing a definitive "Market Bottom" structure on the Daily timeframe. The aggressive selling pressure has subsided, leading to a period of stabilization and quiet accumulation.
Why this setup is on our radar:
Seller Exhaustion: The chart shows a classic "rounding bottom" formation. The lack of lower lows suggests that the capitulation phase is over.
Asymmetric Risk-to-Reward: Entering near historical lows offers a unique advantage. The distance to the invalidation level (zero or recent low) is minimal compared to the upside potential of returning to previous valuations.
Market Cycle : With altcoins showing signs of life (+21% in the last month), rotation into undervalued, bottomed-out assets often follows.
Technical Levels & Plan:
Buy Zone: We are looking to accumulate positions in the 0.027 - 0.028 region.
Invalidation Level: A weekly close below the swing low (~0.015) would compromise the structure. ( Note: Due to volatility, manage position size carefully).
Structural Resistance (Targets):
Short Term: 0.030 - 0.034 (Local Supply)
Mid Term: 0.052 - 0.067 (Break of structure)
Macro / Moonbag: If price discovery kicks in, we look towards 0.17 and higher (0.50+) as widely spaced psychological targets.
Risological Note: This is a "Position Trade," not a scalp. The thesis relies on the market pricing this asset as "oversold." Patience is the strategy here.
Disclaimer: This analysis is for educational purposes only. Crypto assets are highly volatile. This is not financial advice.

GOLD LONG, B SetupXAUUSD on the 1H timeframe shows a bullish continuation structure after reacting strongly from the bullish order block zone around 4580–4590. Price has respected this demand area and printed higher lows, indicating renewed buying interest. A break of structure has already occurred, supporting further upside momentum. As long as price holds above the 4610 support zone, bullish bias remains intact. Upside targets are positioned near 4645 as the first resistance and 4670 as the extended target.
Only for educational purpose only

Is #ETC About to Collapse or Explode? One Side Will Get Wrecked Yello Paradisers! Are you watching #ETC closely enough? While the crowd has been ignoring it due to the boring chop, a textbook falling wedge just completed, and the market might be about to catch them completely off guard.
💎For several weeks, #ETCUSDT has been trading within a clear falling wedge pattern. The price has now reached a critical point, hovering just above a strong demand zone between $12.00 and $12.50, where previous accumulation took place.
💎At the same time, MACD is flashing a strong bullish divergence, while price action continued making lower lows, momentum has been climbing quietly behind the scenes. Just recently, we saw a bullish crossover on MACD, reinforcing that momentum is shifting. This is exactly the type of setup we love: structure + demand + momentum convergence.
💎If this wedge breaks to the upside with conviction, we’ll be targeting $14.00 as minor resistance for #EthereumClassic. It will be followed by a potential move toward the $16.06 zone, which marks moderate resistance. Should the bulls sustain pressure above that, the next big magnet will be the strong resistance at $21.56, where sellers are likely to show up in force.
💎However, if #ETCUSD breaks below the support zone at $12.00, and especially if it closes under $9.17, the bullish thesis will be invalidated. That would open the door for a deeper move, as demand dries up and panic sellers take control.
Trade smart, Paradisers. This setup will reward only the disciplined.
MyCryptoParadise
iFeel the success🌴

SOLUSDT M30 HTF FVG Rejection and Bearish Continuation Setup📝 Description
BINANCE:SOLUSDT has reacted into a clear M30 HTF FVG zone and failed to sustain upside momentum. The recent bounce appears corrective after a strong selloff, with price now stalling below imbalance resistance.
________________________________________
📈 Signal / Analysis
Primary Bias: Bearish while price remains capped below the M30 FVG
Preferred Setup:
• Entry: 144.50
• Stop Loss: Above 145.10
• TP1: 143.90
• TP2: 143.20
• TP3: 142.40 (lower HTF FVG / liquidity)
________________________________________
🎯 ICT & SMC Notes
• Rejection from M30 FVG indicates weak bullish follow-through
• Move up classified as pullback, not structural shift
• Bearish continuation favored toward stacked imbalances below
________________________________________
🧩 Summary
As long as CRYPTOCAP:SOL trades below the highlighted M30 FVG, downside continuation toward lower liquidity pools remains the higher-probability scenario.
________________________________________
🌍 Fundamental Notes / Sentiment
No immediate bullish catalyst is present, keeping sentiment neutral-to-bearish and aligned with technical downside pressure.
________________________________________
⚠️ Risk Disclosure
Trading involves substantial risk and may result in capital loss. This analysis is for educational purposes only and does not constitute financial advice. Always apply proper risk management, predefined stop-loss levels, and disciplined position sizing aligned with your trading plan.

BITCOIN: Huge Bear-Flag-Formation, Confirmation Incoming!Hello There,
welcome to my new analysis about Bitcoin from a more local timeframe perspective. Recently the price of Bitcoin has been forming a crucial formational structure that will be highly determining for the future outcome. Therefore, I spotted all the important levels and indications to consider in this pivotal determination. Also, this whole setup is corresponding to the bearish Wyckoff distribution I have spotted previously.
As it is seen in the chart, Bitcoin is trading within this massive descending channel formation. In this channel there is a strong resistance formed by the upper boundary of the channel. The fact that Bitcoin already bounced several times to the downside from there makes it a resistance zone, which should not be underestimated in any case. As Bitcoin is approaching this zone again, a pullback from there is highly likely.
There are also further indicators and formations that make the range between $100,000 and $105,000 a major resistance zone. The fact that there is also horizontal resistance from where Bitcoin bounced several times to the downside already in the past makes this an additional resistance. Also, the 100-EMA crossed already below the 50-EMA. This bearish crossover is, in most cases, a sure sign that the trend moves forward to the downside.
Considering all of these crucial levels and indications, we can watch now that Bitcoin is building this pivotal resistance cluster from where a pullback to the downside is highly likely. Several resistance factors come together within this resistance cluster: the upper resistance boundary of the descending channel, the horizontal resistance, and the EMA resistance. All of these levels confirm the bearishness of the cluster.
For the whole bear flag formation, this now means that the formation will be confirmed once the breakout below the lower boundary of the formation happens. As it is marked within my chart, this will provide the final bearish bear flag setup from where Bitcoin is going to continue to the downside. The main target zones of this formation are marked in my chart. Once they are reached, further considerations need to be made.
With this being said, it is great to consider the important trades upcoming.
We will watch out for the main market evolutions.
Thank you very much for watching!

ICP/USDT – This Accumulation Breakout! Get Ready to FLY!ICP has finished its accumulation phase and is now reclaiming a major structural level after a prolonged downtrend. This is not a random move — this is a clear shift in positioning.
Price is holding above the reclaimed zone, signaling acceptance and intent to expand higher. As long as this level holds, upside continuation remains the dominant scenario.
This is where early positioning matters — not after expansion starts.
Entry: 3.78 - 3.3
Stop Loss: 3.05
Target 1: 5.70
Target 2: 7.24
Final Target: 9.37
Bias: Bullish continuation
Invalidation: Daily close back below 3.05

SOL/USDT – This Reclaimed Level Could Send SOL Flying Again#SOL has finally reclaimed a major resistance zone, now acting as strong support. This level previously rejected price hard, and the successful reclaim signals a potential trend continuation.
Momentum is clearly shifting bullish, and as long as price holds above this reclaimed zone, the upside scenario remains highly favored. This is the type of structure that often leads to fast expansions once liquidity above gets targeted.
Bias: Bullish continuation
Invalidation: Loss of the reclaimed support zone
📊 Risk/Reward: 1:2
⚠️ DYOR (Do Your Own Research)

HNT Bull Trap… or the Start of a Massive Move?Yello Paradisers, did you notice what just happened with HNT? While most crypto traders were panicking due to the lower lows, we spotted a hidden bullish divergence forming, and it appears the market is now waking up to it.
💎 After weeks of trending inside a clean descending channel, #HNTUSDT just gave us the first real sign of a potential reversal. The move began with a sharp liquidity sweep below the descending support, trapping late sellers and triggering fresh demand exactly inside the major support zone between $1.307 and $1.363.
💎Zooming in, the MACD is showing a clear bullish divergence, price making lower lows while the MACD formed higher lows. Right after that, we got a bullish crossover, confirming momentum is shifting back in favor of the bulls. These are the exact kind of high-probability signals we wait for, and they’re not common.
💎Now that the price has broken above the descending structure, all eyes are on the next key levels. If HNT can maintain this momentum, we expect a test of the $1.445 area as minor resistance, where a temporary pullback could happen. However, if that level is claimed with strength, the next zone to watch is $1.539, followed by the strong resistance range between $1.730 and $1.74. This is where we'll reassess everything and prepare for either a continuation or rejection.
💎On the flip side, if #HNT breaks down and closes below $1.258, this whole bullish scenario will be invalidated. At that point, we’ll consider this a failed breakout and prepare for downside continuation. Until then, the structure looks strong and healthy.
Discipline, patience, and strategy always win.
MyCryptoParadise
iFeel the success🌴

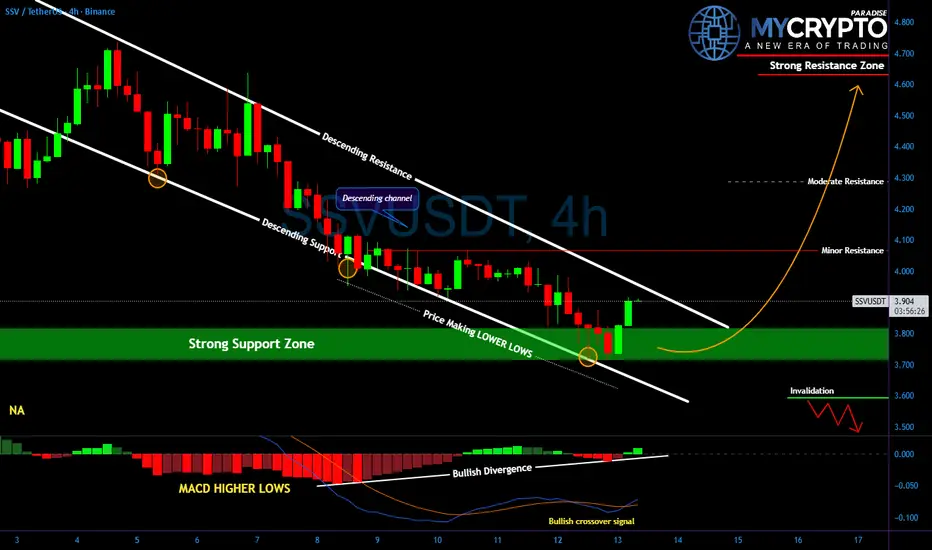
Traders Will Miss This SSV/USDT Reversal Until It's Too LateYello, did you catch that move off support on #SSVUSD? Because what just happened could be the beginning of a major shift, and latecomers might not get a second chance.
💎#SSVUSDT has been moving inside a clean descending channel, forming lower lows with each leg down, but now the price is bouncing right from the strong support zone that's held firm before. The reaction is already showing strength, and it's happening alongside a bullish divergence on the MACD, with higher lows forming while the price was making new lows. That’s a key early signal that momentum is shifting.
💎This type of confluence doesn’t happen by accident. The market is telling us that the sellers are exhausted, and smart money may already be loading up.
💎The structure is clear: if price breaks above the descending resistance, the next logical targets sit around 4.05, then 4.30, and ultimately 4.70 if momentum really kicks in. On the flip side, a clean break below 3.70–3.60 invalidates this reversal scenario and opens the path back toward 3.50.
Be patient, wait for structure to confirm, and stick to your plan. That’s what keeps you consistent while others chase.
MyCryptoParadise
iFeel the success🌴
BITCOIN (BTCUSD): Road to 100k
Bitcoin finally completed a bullish accumulation within
a huge ascending triangle pattern on a daily..
There is a high probability that the market will continue
rising now.
The next strong resistance cluster is 98800 - 101200 area.
I think that it will be reached soon.
❤️Please, support my work with like, thank you!❤️
I am part of Trade Nation's Influencer program and receive a monthly fee for using their TradingView charts in my analysis.

#VET Ready for a Major Bullish Move | Key Levels to Watch Yello, Paradiser! Is #VeChain about to trap all the late bears, or are we about to witness one more brutal shakeout? Let's view the #VETUSDT trading setup:
💎#VET is currently trading around $0.0116 on the 1D timeframe, and just completed a breakout from a textbook Falling Wedge, one of the most reliable bullish reversal patterns when combined with confirmation signals.
💎The breakout has already occurred, and most importantly, it is now retesting the descending resistance to validate this breakout. This is often a critical validation of strength and suggests the move is likely not a fakeout. In addition, we’ve already seen a bullish crossover on the momentum oscillator, which adds further confirmation to this bullish setup.
💎The Strong Demand Zone between $0.0094 and $0.010 is now acting as the base of this bullish structure. Holding above this level is essential. If bulls continue to defend this zone, we anticipate a potential push toward the first major resistance at $0.0138, followed by the strong resistance area between $0.019 and $0.020, where sellers are likely to step in more aggressively.
💎Below the structure, we’ve clearly marked Key Support at $0.0078 for #VETUSD. If price closes below this zone, it would invalidate the bullish scenario and open the door for further downside, potentially into illiquid areas where volatility could spike.
Be patient, wait for structure to confirm, and stick to your plan. That’s what keeps you consistent while others chase.
MyCryptoParadise
iFeel the success🌴

Monero (XMR) Just Woke Up: Structural Breakout AnalysisWhile the market is distracted by the majors, Monero ( CRYPTOCAP:XMR ) has quietly engineered a massive structural shift on the daily timeframe.
Monero just broke its multi-month resistance with impulsive volume. The "Roof" has officially become the "Floor."
No wicks.
Pure demand.
Structure shift.
Is this the start of a new macro run? Let's wait and watch.

ZKP/USDT – This Accumulation Could Be the Next Big BouncePrice has been bleeding inside a clear downtrend, but the momentum is now slowing down. We are seeing strong accumulation at the base, right after price tapped the demand zone and reacted sharply.
The descending trendline is being pressured, and any sustained hold above this area increases the probability of a trend reversal rally. This is the type of zone where smart money typically builds positions before expansion.
If price continues to respect the accumulation base, the path toward higher liquidity becomes very clear.
Entry Zone: Current price area
Stop Loss: 0.1272
Target 1: 0.15427
Target 2: 0.17220
As long as the base holds, the bullish scenario remains valid.
Failure to hold the base invalidates the setup.

Is #IOTA Ready For a Major Bullish Wave or Will it Fall Further?Yello, Paradiser! Are you ready for what could be a brutal shakeout for bears or a golden entry for bulls on #IOTAUSDT? This falling wedge might not stay quiet for long. Let’s break down the #IOTA Setup:
💎#IOTAUSD is currently trading around $0.084 on the 4H timeframe and has just broken out of a textbook falling wedge pattern. This pattern typically signals a bullish reversal, but only when confirmed by proper retest and strength.
💎We’ve already seen a breakout followed by a retest of the descending resistance, which is a key early sign that momentum might be shifting. Adding to that, the 50 EMA is now attempting to turn into support, and if it holds, it significantly increases the probability of a strong bullish follow-through.
💎The demand zone between $0.080 and $0.084 is now acting as the make-or-break level for bulls. Holding above this zone keeps the bullish setup alive. If price continues to build structure above this area, we could see acceleration toward the first major resistance at $0.100, followed by a strong resistance near $0.120, where we expect sellers to become more aggressive.
💎However, as always, risk management comes first. The bullish thesis is invalidated if price breaks below the key support at $0.0717, where the structure would be compromised, and a bearish continuation toward lower liquidity zones could begin.
Trade smart, Paradisers. This setup will reward only the disciplined.
MyCryptoParadise
iFeel the success🌴

Bitcoin — Bearish Bias Intact as Price Pressures Interim SupportAs explained in my previous analyses, my medium-term bias on Bitcoin remains bearish, with 75k as the minimum zone I expect to be reached before any meaningful and sustainable bullish reversal can take place.
Looking at the chart:
- After the drop to November lows toward 80k, BTC once again entered a consolidation phase
- This range has been capped by a clear resistance zone around 95k
- Following the latest rejection from that resistance, price rolled over and is now trading just above the interim support area at 89,500–90,000
This puts the market at an important decision point.
⚖️ Two Medium-Term Bearish Scenarios
At this stage, I am working with two possible paths, both ultimately pointing toward the same downside objective.
1️⃣ Support Holds — Final Push Before Deeper Drop
- Bulls manage to defend the 89.5k–90k support
- A corrective rebound follows
- Price could even push above 100k
- This move would, in my view, represent a final distribution phase
➡️ followed by a broader decline toward the 75k target zone
2️⃣ Support Breaks — Direct Continuation Lower
A clean break below the interim support
This would significantly increase the probability of
➡️ a direct move lower toward 75k, without another major upside attempt
📌 Bottom Line
Until price proves otherwise, I remain bearish on BTC.
The market is currently sitting at a level where structure, not opinion, will decide the next move. Whichever scenario plays out, risk management and patience remain key. 🚀
