BITCOIN SIGNAL: SELL EVERYTHING NOW!!!!!!!? (big)Yello Paradisers! Enjoy the video!
And Paradisers! Keep in mind to trade only with a proper professional trading strategy. Wait for confirmations. Play with tactics. This is the only way you can be long-term profitable.
Remember, don’t trade without confirmations. Wait for them before creating a trade. Be disciplined, patient, and emotionally controlled. Only trade the highest probability setups with the greatest risk to reward ratio. This will ensure that you become a long-term profitable professional trader.
Don't be a gambler. Don't try to get rich quick. Make sure that your trading is professionally based on proper strategies and trade tactics.
Cryptosignals

SOL/USDT: Bearish Structure Intact Below 155 Confluence ZoneSOL/USDT is approaching the 150–155 resistance cluster, where key technical levels—including the descending trendline, horizontal supply, and local upward trendline—converge. Despite a sharp rebound, the overall trend remains bearish, with lower highs dominating the structure. Recent price action appears corrective, not impulsive, suggesting this move may be a retracement rather than a true reversal.
If price gets rejected from this confluence zone, the bearish continuation toward 133 becomes the base case. Deeper downside could follow toward the mid-channel support unless bulls reclaim ground decisively.
➡️ Primary scenario: Rejection from 150–155 → drop toward 133
❗️ Risk scenario: Break and close above 155 would flip bias short-term bullish.

BITCOIN (BTCUSD): Bullish Reversal is Coming?!
On our yesterday's live stream, we discussed Bitcoin.
It looks like the market found a bottom and preparing for a bullish reversal.
To confirm a start of an uptrend, I suggest focus on
92000 - 94100 Order Block zone.
Its breakout and a daily candle close above will confirm a bullish reversal.
A formation of a Higher Low after the last retracement from that leaves
some clues of a weakening bearish momentum.
A breakout will be our final confirmation.
❤️Please, support my work with like, thank you!❤️
I am part of Trade Nation's Influencer program and receive a monthly fee for using their TradingView charts in my analysis.

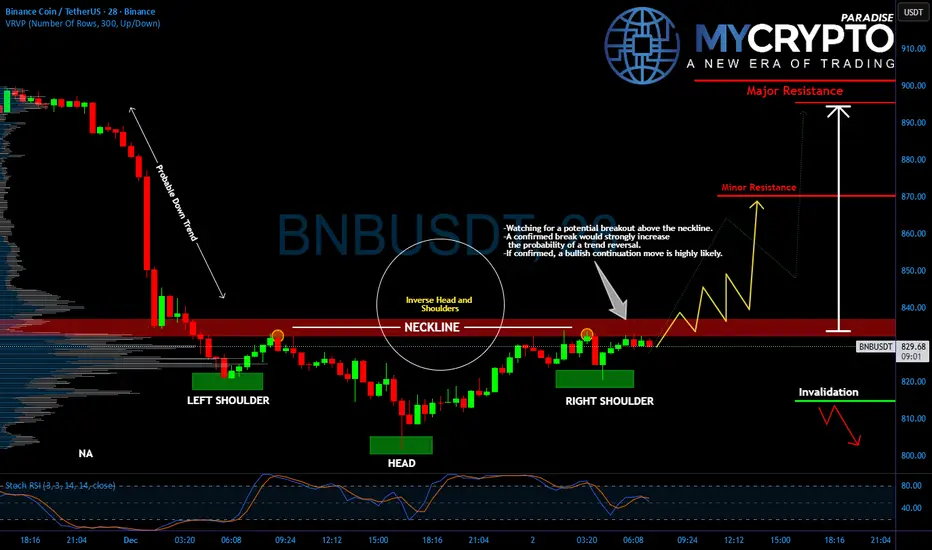
BNB Bulls Near Breakout: Reversal Pattern Emerges
Yello, Paradisers, is this the turning point for BNB? After the recent brutal drop, signs of a powerful reversal are emerging, and what we’re seeing now could trap late sellers in a dangerous spot.
💎#BNBUSDT has formed a textbook inverse head and shoulders pattern, signaling a potential bullish reversal after a steep downtrend. The neckline around the $834–$836 level has become a critical zone to watch. Price is currently testing this area, and a confirmed breakout above it could trigger a strong continuation move.
💎This structure forms after a sharp downtrend and often acts as a springboard for upside momentum when confirmed. If #BNB manages to break and hold above the neckline with volume, the next target lies near $870, minor resistance, with the $890–$900 zone acting as major resistance.
💎However, if bulls fail to break out and the price gets rejected from the neckline again, we could see a retracement back toward the $810 invalidation level, which would weaken the reversal setup and put short-term downside back in play.
💎The Stochastic RSI is also approaching overbought territory, suggesting bulls need to act quickly before momentum fades. Volume confirmation remains key here.
Stay sharp, the setup is clean, but it’s also a classic trap zone.
MyCryptoParadise
iFeel the success🌴
ETH : SELL MARKET!!!Hello friends
Well, as you can see, we are in a very strong downtrend and the sellers have full control.
Now, any price increase can be a selling opportunity, until the buyers show strength, we cannot say that the trend has changed...
Of course, we are also at important support and we need to see whether buyers support the price or not. Until then, we will not trade on guesswork and predictions.
This analysis is purely technical and is not a buy or sell recommendation, so please exercise your risk and capital management.
*Trade safely with us*

DOGE/USDT : BUY MARKETHello friends
Well, considering the decline we had, you can see that the price has been well supported by buyers, which has caused the price to increase slightly.
Now it seems that given the good fundamental news on the Dodge and the ascending channel it has created, it can grow.
There is also an important resistance ahead, which if broken, could see the number 19 cents.
This analysis is purely from a technical perspective and is not a buy or sell recommendation. Avoid emotional behavior.
Trade safely with us

TON : SELL LIMIT
Hello friends
considering the downtrend we are in, the power of sellers is quite clear and it is logical that we also move to the strong side, and in this downtrend, any price increase can be a selling opportunity.
So now, considering the buyers' support of the support area identified with Fibonacci, we need to see whether the sellers will enter again in the identified resistance area or not?
If the buyers weaken again in the resistance area, the price can fall to the specified targets.
This analysis is purely technically reviewed and is not a buy or sell recommendation, so do not act emotionally and observe risk and capital management.
*Trade safely with us*

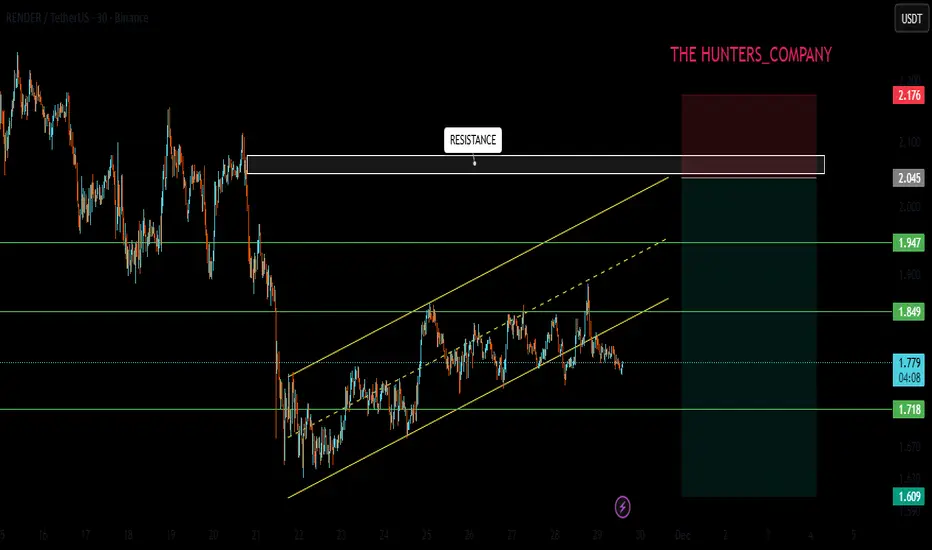
RENDER/USDT : SELL LIMITHello friends
Given the downward trend we are having, you can see that the power is in the hands of the sellers.
Now, if the price reaches the resistance areas, it is a good opportunity to sell. Be careful that if the structure breaks, it is no longer logical to sell.
So we should see the power of the buyers in the resistance area, but most likely we will see a price correction.
This analysis is purely technically reviewed and is not a buy or sell recommendation, so do not act emotionally and observe capital management.
*Trade safely with us*
SUI/USDT : SELL LIMIT
Hello friends
you can see that the price is moving in a range with a slight upward slope, and every time it hits the specified support, the power of buyers decreases, and now, in the last hit that we have identified, it seems that the price will not be able to record a higher ceiling and we will witness a price drop.
This analysis is purely technically reviewed and is not a buy or sell recommendation, so do not act emotionally and observe capital management.
*Trade safely with us*

STETH Bulls About to Get Trapped? Yello Paradisers, can you feel it? This breakout looks clean… but the trap might be even cleaner.
💎#STETHUSDT is currently pressing into a critical supply zone, and while the recent breakout from the channel looks solid on the surface, we’re watching closely for signs of bullish exhaustion. Price has been climbing steadily within a tight ascending channel, respecting both support and resistance levels precisely.
💎However, it has now entered a key supply area, aligning with strong historical rejection levels and pushing right into a zone where sellers previously took control.
💎Despite the aggressive move upward, the structure shows potential for a fakeout breakout, the kind that grabs late longs, sweeps liquidity, and then collapses.
💎A confirmed rejection from this supply zone around $2,940–$2,980 would be the first signal of a likely reversal toward minor support at $2,700, and potentially even deeper into the major support zone at $2,536.
💎Invalidation of the bearish bias comes only with a sustained breakout and daily close above $3,148.80, which would reintroduce bullish continuation targets.
Stay sharp, the setup is clean, but it’s also a classic trap zone.
MyCryptoParadise
iFeel the success🌴

$ETH, $4.7K+ Before End of 2027? Retracement Potential?Ethereum is one of those that I am neutral on but invested for long term holds. They have a monopoly on tokenization, yet at the same time, the whole purpose of Ethereum has changed dramatically.
The PoS transition when Ethereum Classic was the original Ethereum and Ethereum PoW is currently the "decentralized newer Ethereum" have left various technologist confused along with the removal of the Ropsten testnet. This has shown Ethereum to be much more centralized than promised and it is entering muddy waters in that sense.
Likewise, can Ethereum differentiate itself from Namecoin, Peercoin and these original PoS forks who got outpaced? Ethereum's technical transition also emphasizes the need for subnets, rollups and speed. Currently they are competing against Solana as well as other players including Z-Cash or minimal small players like Celo and Cardano. The technical differentiation needs to be expanded however in order to allow for scalability. Likewise, Ethereum is still prime in terms of PoS and name-brand but may not be prime in terms of technology.
That said, the long-term potential is still there and Ethereum has a hard to replace developer ecosystem. The patterns when considering fib retracement along with the past cipher and PnL setup showcase the potential of a $4.7K price point by October 2027. As always, none of this is investment or financial advice. Please do your own due diligence and research.

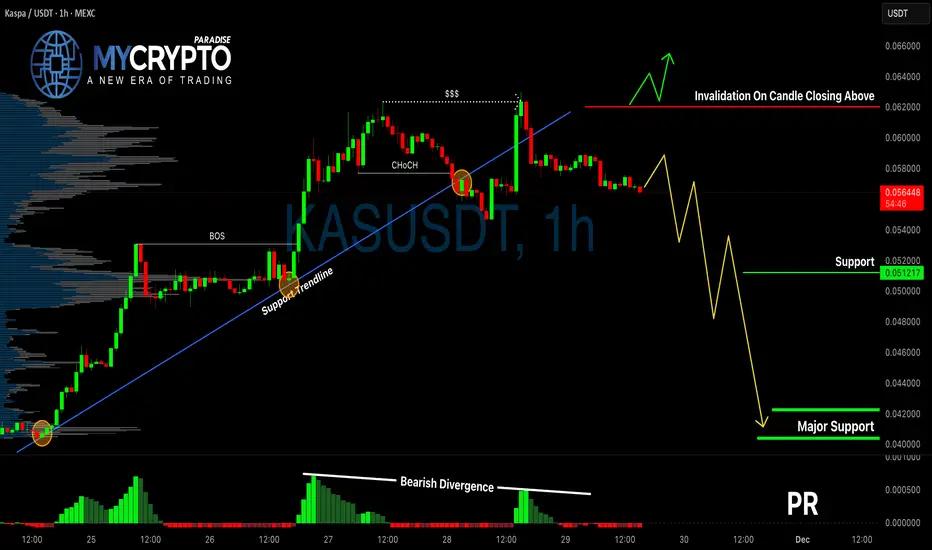
KASUSDT Breakdown Confirmed?Yello Paradisers, have you already positioned yourself on KASUSDT’s bearish move, or are you about to get trapped by a false bounce? The market just gave us a major clue, and ignoring it could cost you.
💎KASUSDT has officially broken below a critical supportive trendline, which was previously holding the structure intact. This breakdown wasn’t random—it came with a clean bearish CHoCH (Change of Character), and the MACD histogram is flashing a clear bearish divergence. These combined signals significantly increase the probability that this is not just a minor pullback, but the beginning of a more aggressive downside move.
💎From the current market level, there is already a straightforward 1:1 risk-reward opportunity on the table. However, if price pulls back toward the previous support (now resistance), that would offer a much better entry zone with improved risk-reward. But don’t jump in blindly—what we want to see at that level is a bearish candlestick confirmation. Without it, you're only guessing. With it, you’re trading with probability on your side.
💎On the flip side, if KASUSDT breaks out and closes decisively above the invalidation level, that would fully invalidate the current bearish thesis. In that case, it’s smarter to stay on the sidelines and wait for a new high-probability setup to form. This market doesn’t reward impulsive decisions—it rewards patience, discipline, and precision.
🎖Strive for consistency, not quick profits. Treat the market as a businessman, not as a gambler.
MyCryptoParadise
iFeel the success🌴
STRK Analysis (4H)STRK is one of the coins that has performed well during the bear market, but after a bearish CH it has entered a downward phase.
Opening a short position at these levels is meaningless. We should wait for a proper liquidity pool to be collected and for the price to retrace upward, then enter a position at optimal levels.
The optimal zone for entering a position is the LP area. If the price reaches this zone, we expect it to be rejected toward the TP levels.
Do not enter the position without capital management and stop setting
Comment if you have any questions
thank you

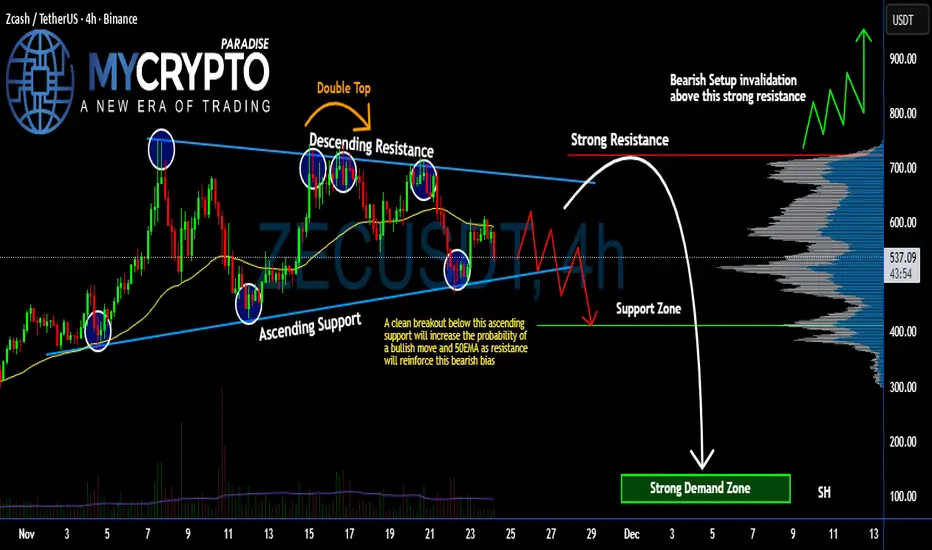
Is #ZEC Showing Signs of Weakness? Bears Ready to take Control Yello Paradisers! #ZECUSDT is flashing some serious structural clues—and if you’re not watching closely, you might miss a textbook bearish setup forming right under your nose. Let’s break down the #Zcash setup:
💎#ZEC has been trading between a clean symmetrical triangle, creating a tightening structure. This squeeze has already produced multiple strong rejections from the descending trendline, including a clear Double Top, which only strengthens the bearish narrative.
💎Current price of #ZECUSD is $536, sitting right above the ascending support. A clean breakdown below this support, especially with the 50 EMA now acting as resistance, would significantly increase the probability of deeper bearish continuation. A bearish retest from below would be the confirmation signal the market is waiting for.
💎If the breakdown plays out, the first target lies at the support zone around $411. But the real liquidity sits much lower, inside the strong demand Zone, where aggressive buyers could re-emerge. A sweep into that zone could fuel a powerful reaction… assuming sellers don’t maintain full control.
💎Bearish setup invalidation kicks in only if #ZEC reclaims the $724 strong resistance level. A breakout and hold above this zone would flip the entire structure and open the gates toward a bullish rally, potentially targeting much higher levels next.
Trade smart, Paradisers. This setup will reward only the disciplined.
MyCryptoParadise
iFeel the success🌴
KGEN Buy/Long Setup (2H)Given the liquidity sweep at the bottom, the shift to a bullish market structure, and the formation of three iBOS signals, we can look for buy/long positions in the support zones.
Note that within the entry area, we have two points of interest, which we have marked.
The targets are also indicated on the chart.
If the stop at 0.16915 is touched, this signal will be stopped out.
Do not enter the position without capital management and stop setting
Comment if you have any questions
thank you

LINK/USDT: Bearish Bias Holds Below 14.00 Resistance ConfluenceLINK/USDT respected prior analysis, advancing into the 14.00 resistance zone, where the descending trendline and former structure highs intersect. Price is forming a corrective pullback after a recent lower low, while momentum fades. The broader downward channel remains intact, reinforcing the bearish outlook.
As long as sellers defend 14.00, the pair is likely to extend toward the 11.75 liquidity pocket, aligning with the established trend of rejections and lower lows.
➡️ Primary view: Rejection from 14.00 → move toward 11.75
❗️ Risk: Breakout above the channel would invalidate bearish structure.

What IsThe Rebuy Range For The COAI ? (4H)⚠️ First of all, note that this coin is highly volatile and risky, so don’t forget to manage your position size, leverage, and risk.
⚠️ Considering the number of wave extensions and irregular candling, this coin doesn’t have a single scenario, but the scenario on the chart is the most probable one.
⚠️ This setup is not a sell/short; it is a buy/long.
It seems a double correction on COAI is completing, and we are currently in the second part of the correction, which is a diametric. We appear to be in wave D of this diametric, which is nearing completion.
We are only buyers of COAI in the green zone.
Targets are marked on the chart. Take profit step by step at the targets, and after reaching the first target, move your stop-loss to the entry zone.
A daily candle closing below the invalidation level will invalidate this analysis.
For risk management, please don't forget stop loss and capital management
When we reach the first target, save some profit and then change the stop to entry
Comment if you have any questions
Thank You

SQD New Update (2D)Based on the data we have from SQD, we can analyze this coin.
It seems that we are currently in the Diametric/Symmetrical pattern, wave D — specifically inside wave F of this structure.
In the red zone, you can look for sell/short positions.
In the green entry zones, we can look for buy/long positions.
Let’s see what will happen next.
For risk management, please don't forget stop loss and capital management
When we reach the first target, save some profit and then change the stop to entry
Comment if you have any questions
Thank You

TURBO/USDT : SELLHello friends
Given the good pump we had, this currency was unable to stabilize the price above the specified resistance, which means that buyers were unable to decisively break the resistance and when this happens, the price can correct.
This analysis is purely from a technical perspective and is not a buy or sell recommendation.
*Trade safely with us*

YALA Analysis (8H)The YALA coin appears to be forming a diametric/symmetrical pattern on the hourly timeframes.
It seems we are currently in Wave F. The red zone is an appropriate area for Wave F to complete. In the red zone, we will look for sell/short positions.
The targets for Wave G are marked on the chart.
A daily candle closing above the invalidation level will invalidate this analysis and outlook
For risk management, please don't forget stop loss and capital management
When we reach the first target, save some profit and then change the stop to entry
Comment if you have any questions
Thank You

SQD Analysis (1D)First of all, pay attention to the timeframe | this is the daily timeframe.
For sell/short positions in higher timeframes and in a swing style, entries should only be taken within the red zone. However, for scalp short positions, you may enter after confirmation, but you must manage your expectations regarding scalp trades.
On the chart, it seems that wave C has completed and the price has entered wave D. Within the green support zone, wave D may still be incomplete, and the price could enter a corrective phase of wave D, which in this case means an upward move.
The targets are marked on the chart. A daily candle close below the invalidation level will invalidate this analysis.
For risk management, please don't forget stop loss and capital management
When we reach the first target, save some profit and then change the stop to entry
Comment if you have any questions
Thank You

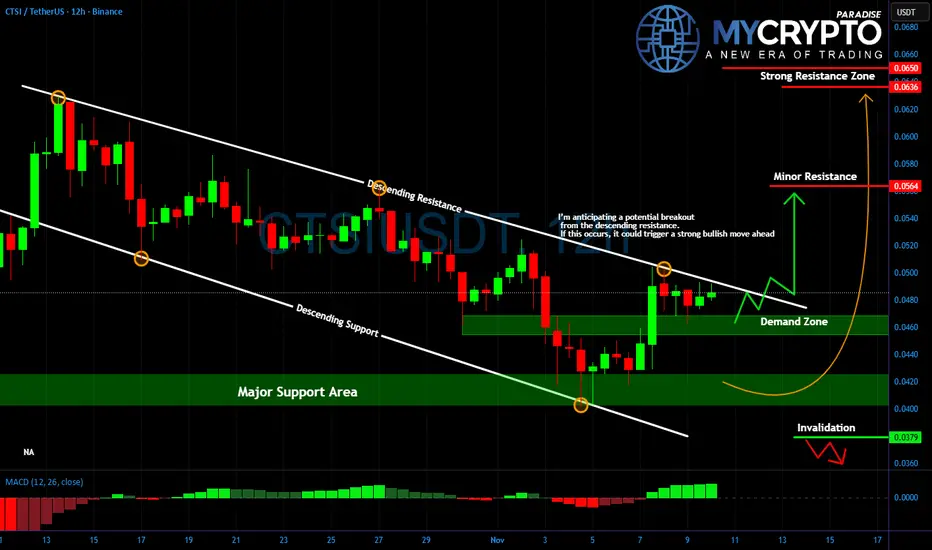
CTSI About to Explode or Fakeout Incoming?Yello Paradisers is CTSI finally ready to break out, or are we looking at another trap to wipe out emotional traders?
💎#CTSIUSDT has been moving inside a clean descending channel, respecting both support and resistance levels. The price recently bounced strongly from the key demand zone around $0.041 to $0.044, showing clear signs of accumulation. Now, price is approaching the descending resistance, where a confirmed breakout could change the game entirely.
💎A clean break and daily close above the $0.050 level would likely trigger bullish momentum, with short-term upside toward the 0.056 area. If this level gets cleared, the real target lies at 0.063 to 0.065, which marks a strong resistance zone and a likely exit area for smart money.
💎However, it's important to stay focused. Until the breakout is confirmed, this move remains unverified. Many traders get caught in fakeouts by rushing in too early. A move below $0.0379 would invalidate the bullish setup entirely, and at that point, the bias shifts back to the downside.
Discipline, patience, robust strategies, and trading tactics are the only ways you can make it long-term in this market.
MyCryptoParadise
iFeel the success🌴
PEPE/USDT : BUY LIMITHello friends
Well, you can see that after the price fell, it was able to rise by buyers. Now we have an important area where this resistance needs to be broken for the trend to change and the price to rise.
This analysis is purely technically reviewed and is not a buy or sell recommendation, so avoid emotional behavior.
*Trade safely with us*
