STRATEGY The collapse continues..Strategy (MSTR) completely lost its 1W MA200 (orange trend-line) last week, making its losses at more than -80% from its November 2024 All Time High (ATH), continuing to outperform even Bitcoin in losses. Given that the Bear Cycle on stocks hasn't started yet, this can only get (much) worse, something we've been calling out for since last year.
The last two major market bottoms have both been made after (marginally) breaching the 1M MA200 (red trend-line) in 2022 and 2020. This was close to the Higher Lows trend-line that started on the November 2008 bottom of the U.S. Housing Crisis. The stocks recent Highs since 2021 of course represent its strategic shift to Bitcoin reserves.
In any case, this shows that as long as Bitcoin continues to fall (should do so up until September 2026 at least), Strategy should target its 1M MA200 again and based on its current trajectory has high probabilities of making contact at $50.00.
A highly likely Bear Cycle on the stock market however, has the potential to accelerate the correction inside the Higher Lows Zone even.
---
** Please LIKE 👍, FOLLOW ✅, SHARE 🙌 and COMMENT ✍ if you enjoy this idea! Also share your ideas and charts in the comments section below! This is best way to keep it relevant, support us, keep the content here free and allow the idea to reach as many people as possible. **
---
💸💸💸💸💸💸
👇 👇 👇 👇 👇 👇
Cryptostocks

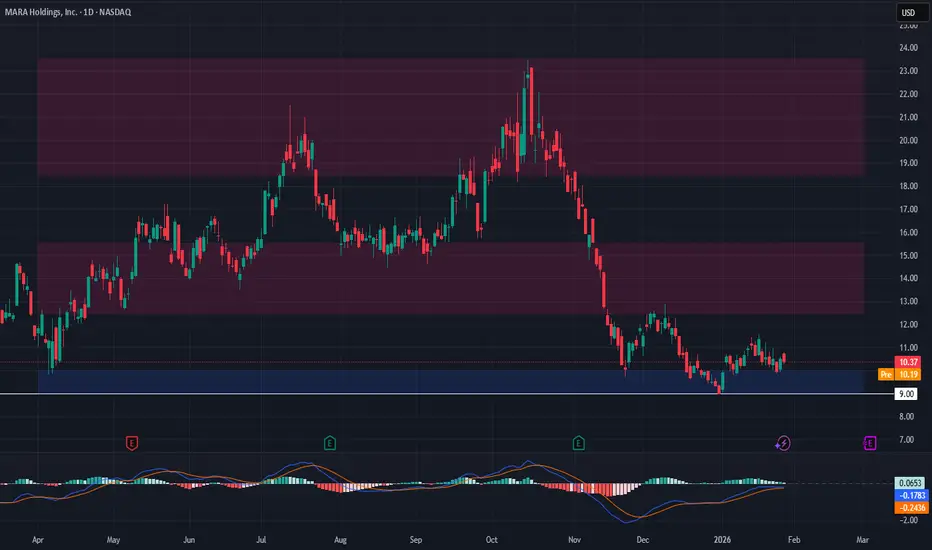
MARA – Support Retest Offering Swing OpportunityMarathon Digital Holdings NASDAQ:MARA has pulled back to retest the previous breakout level, which is now holding as support. This kind of price behavior often signals strength, especially when old resistance flips into support. We're seeing price action stabilize in the $9.00–$10.00 zone—an area that previously acted as a barrier, now forming a solid base.
📌 Trade Setup:
Entry Zone: $9.00 – $10.00
Take Profit Targets:
$12.50 – $15.50
$18.50 – $23.50
Stop Loss: Just below $9.00
This setup aligns with classic support/resistance trading principles. If volume increases on the next leg up, MARA could revisit mid-to-high teens. Keep in mind, MARA is closely tied to Bitcoin’s movement, so broader crypto market direction will play a key role.
🔒 Risk Management First – Always protect your capital.
COINBASE Channel Down continuation targeting $170.Coinbase (COIN) has been trading within a Channel Down since the October 10 2025 High. The recent rejection exactly on its 1W MA50 (blue trend-line) has made the Bearish Leg resume its course, which could technically complete a -42.36% decline in total, similar to the pattern's first one.
If the 1D RSI Higher Lows trend-line breaks, it will add extremely heavy bearish pressure on the market. Our short-term Target on this Leg is $170, which would make direct contact with the 1W MA200 (red trend-line) while also hold the 143.00 Support of the April 07 2025 Low.
---
** Please LIKE 👍, FOLLOW ✅, SHARE 🙌 and COMMENT ✍ if you enjoy this idea! Also share your ideas and charts in the comments section below! This is best way to keep it relevant, support us, keep the content here free and allow the idea to reach as many people as possible. **
---
💸💸💸💸💸💸
👇 👇 👇 👇 👇 👇

Update: IREN Limited (IREN) - structure beats emotionsIREN Limited operates in Bitcoin mining and AI cloud infrastructure, focused on renewable energy and scalable data centers. Mining is the core revenue driver, AI services are still small but growing fast.
On the daily chart, a falling wedge has been broken to the upside, followed by a clean retest. The structure is holding. Price is now sitting in a strong daily support zone at 36–38, aligned with the 0.618 Fibonacci level.
MACD is turning bullish on higher timeframes, and short- to mid-term moving averages are stabilizing. This looks like accumulation after a deep correction, not a random bounce.
By the end of 2025, IREN scaled materially.
Revenue grew from $184M in 2024 to roughly $485M in 2025.
Bitcoin mining remains the main contributor, while AI Cloud Services added about $16M and continue expanding.
Consensus estimates point to ~$230M revenue in Q2 2026. EPS is still negative, which fits a capital-intensive expansion phase.
As long as price holds 36–38, the market is pricing a move toward 50 → 60 → 70.
This is not a one-day trade. It’s a structural recovery setup.
The chart already did the talking.

STRATEGY Is this a 2000 Dotcom crash all over?Strategy (MSTR) has been on a strong sell-off since its November 2024 All Time High (ATH). A little more than 1 year of downtrend is classified as a Bear Cycle and it may be no coincidence that this ATH was priced marginally above Strategy's previous ATH of March 2000.
That was at the peak of the infamous Dotcom Bubble and its subsequent collapse. So are we having a 2000 crash all over again? Well, with Strategy's core business being exclusively Bitcoin related, we are poised to have a big one (since it follows BTC's Cycle to a certain extent) but not just as enormous as 2000's, which exceeded -99%, dropping the company to the brink of extinction.
Technically, we can have a correction of -90% though, which is the decline that the previous Bear Cycle in 2022 suffered. After all the dominant multi-decade pattern since the Dotcom bottom, has been a Channel Up, with the recent ATH testing its top and the 1M MA200 (orange trend-line) marking its Lows, hence the best buy opportunities in the last 10 years.
As a result, our long-term Target on MSTR remains $60.00, which would be a -90% correction from the Top, while also making direct contact with the 1M MA200. P.S. Notice also the similarities between the 1M RSI sequences.
---
** Please LIKE 👍, FOLLOW ✅, SHARE 🙌 and COMMENT ✍ if you enjoy this idea! Also share your ideas and charts in the comments section below! This is best way to keep it relevant, support us, keep the content here free and allow the idea to reach as many people as possible. **
---
💸💸💸💸💸💸
👇 👇 👇 👇 👇 👇

MicroStrategy – Downtrend Intact📉 NASDAQ:MSTR decline from the 2024 peak remains in progress, with price now approaching the initial target area near $145, where the next daily bounce could develop.
However, that bounce is expected to fail, as the broader downtrend continues to drive price lower toward sub‑$100 levels in the coming months.

Robinhood (HOOD) – Consolidation After Strong Run🔍 Fundamental Highlights:
Cathie Wood’s ARK Invest recently bought 124,427 shares of Robinhood NASDAQ:HOOD , valued at approx. $15.4M, reinforcing her bullish stance despite recent market volatility. This move aligns with ARK's broader rotation into crypto-adjacent and disruptive finance plays — including names like Coinbase, BitMine, and Circle. This kind of conviction buying often precedes major inflection points.
📉 Technical Setup:
After a strong rally, HOOD is now consolidating. Price action is tightening, volume is cooling, and a pullback into the $95–$98 zone offers a compelling risk-reward opportunity. This range has previously acted as demand, and a bounce here could trigger the next leg higher.
📌 Trade Plan (Illustrative Only):
Entry Zone: $95 – $98
Take Profit Targets: $117, then $153
Stop Loss: $85 (invalidates support zone)

COINBASE entering a brutal Bear Cycle. 1st Stop = $150Coinbase (COIN) has been on a strong decline since its July All Time High (ATH) and right now is within the 1W MA50 (blue trend-line) - 1W MA100 (green trend-line) range. This is similar so far to the correction phases since March 2024 that found a bottom on the Support Zone but more importantly looks identical to the start of the 2022 Bear Cycle.
Based on the latter, after the current 3-wek consolidation is over, the stock should decline more, towards the 0.236 and 0.382 Fibonacci levels. The latter is where the Support Zone is, hence our medium-term Target is $150.00 (marginally above).
If the Support Zone breaks and the market keeps mirroring the 2022 Bear Cycle, we are looking at a brutal sell-off that could be as low as $54.00 (Fib 0.786) and $32.00 (Fib 1.0). Notice that in 2022, the most efficient bottom buy signal was given initially by a massively oversold 1W RSI (nearly 20.00) and finally confirmed by a Higher Lows Bullish Divergence of the same indicator. Use that to time the bottom to your advantage regardless of the price and buy for the next long-term Bull Cycle.
---
** Please LIKE 👍, FOLLOW ✅, SHARE 🙌 and COMMENT ✍ if you enjoy this idea! Also share your ideas and charts in the comments section below! This is best way to keep it relevant, support us, keep the content here free and allow the idea to reach as many people as possible. **
---
💸💸💸💸💸💸
👇 👇 👇 👇 👇 👇

STRATEGY Mirror crash with 2022 to $60 has started.Michael Saylor won't like this. But the chart is what it is and that's an objective dynamic.
** The 5-year Channel Up and Bear Cycle **
Strategy (MSTR) has been trading within almost a 5-year Channel Up since the February 2021 Top of its previous Cycle. Within this lines, it has had its latest top (Higher High) on the week of November 18 2024 and since then it has been on a structured strong decline.
This decline has gotten even stronger once the price broke below its 1W MA50 (blue trend-line). So far, the 2025 correction is mirroring the 2021 one, which was the start of a 2-year (2021/21) Bear Cycle.
** The three Stages **
Based on that, we have valid reasons to expect that 2026 will also mirror the past Bear Cycle. What stands out on this analysis is that we have classified the whole Bear Cycle into three Stages. Based on that, we have now already entered Stage 2 as the price has broken below its 1W MA50 (and should stay as the Resistance for the remainder of the Cycle) and almost touched its 1W MA200 (orange trend-line). When that happened in January 2022, the market rebounded towards the 1W MA50 where it was rejected and when it broke below the 1W MA200 as well, Stage 3 started. This Stage made the Bear Cycle bottom on the 1M MA250 (red trend-line) after a -90% decline in total. It was completed when the price broke above the 1W MA50 again, essentially confirming the start of the new Bull Cycle.
** Where is the bottom now? **
As a result, we may now see a short-term rebound, limited by the 1W MA50, which after it gets rejected and breaks below the 1W MA200, Stage 3 may start. If this Bear Cycle also crashes by -90%, we should then be expecting a bottom at $60 (at least), supported by the 1M MA250 again.
Notice also the striking symmetry among the 1W RSI patterns of the two Cycle fractals. The 1W RSI has currently hit the 30.00 oversold barrier (similar to Jan 2022) and it was a second break and then a Higher Lows Bullish Divergence that confirmed the bottom of the Bear Cycle, essentially turning Strategy Inc. into a long-term buy opportunity again.
---
** Please LIKE 👍, FOLLOW ✅, SHARE 🙌 and COMMENT ✍ if you enjoy this idea! Also share your ideas and charts in the comments section below! This is best way to keep it relevant, support us, keep the content here free and allow the idea to reach as many people as possible. **
---
💸💸💸💸💸💸
👇 👇 👇 👇 👇 👇

MSTR – Approaching Major Support as Downtrend ContinuesMicroStrategy remains in a clear higher-timeframe downtrend, and if Bitcoin continues to weaken, NASDAQ:MSTR could slide further toward the next major support level — now sitting roughly 63% below its all-time high. This zone may act as a potential reversal area, especially if market sentiment stabilizes.
Trade Setup:
• Entry Zone: $170 – $180
• Take Profit Targets:
🥇 $280
🥈 $360
• Stop Loss: $122

CRCL: watching for final leg downAnother leg down into the ideal macro support zone at 91–85/75 would be ideal to complete the corrective structure from the June highs.
A confident move above 120 would shift the odds toward the correction being complete, opening the door for at least a larger-degree bounce — or potentially the beginning of a new uptrend.
Chart:

Block (XYZ): Weak Earnings, Bitcoin Exposure, and the Next Move📊 Fundamental Overview
I entered Block (XYZ) about a year ago when the company’s cash flow trends were very strong.
However, right now the picture is becoming more concerning.
EPS growth is not stable.
Previously, EPS was growing rapidly (65%, 38%, 155%), but the last two quarters showed only –10% and +13% growth.
Revenue growth stagnated.
Year-over-year revenue used to grow strongly —
2019: $4M → 2020: $9M → 2021: $17M → 2023: $21M → 2024: $24M — but is now roughly flat (~+1% YoY).
Forward P/E: ~22.7 — not particularly attractive considering the company’s decelerating fundamentals.
Share dilution stopped.
Since 2022, Block has halted share issuance, and total shares outstanding remain stable within ±2%, which is a positive signal compared to other fintech peers.
💥 Q3 Earnings Miss
In the latest earnings report:
Expected EPS: $0.63 → Actual: $0.54
Revenue: $6.11 B (below expectations)
The miss triggered a 15–18% drop after earnings, followed by a partial rebound as dip buyers stepped in.
But fundamentally, the company is clearly losing growth momentum.
₿ Bitcoin Exposure Risk
Block currently holds about 8,700 BTC (~$1 billion) on its balance sheet.
While this gives long-term upside potential, it also adds massive volatility risk.
If Bitcoin enters a –70% correction (which I expect in the next 3–4 months), that could hit Block’s balance sheet hard and accelerate the drawdown.
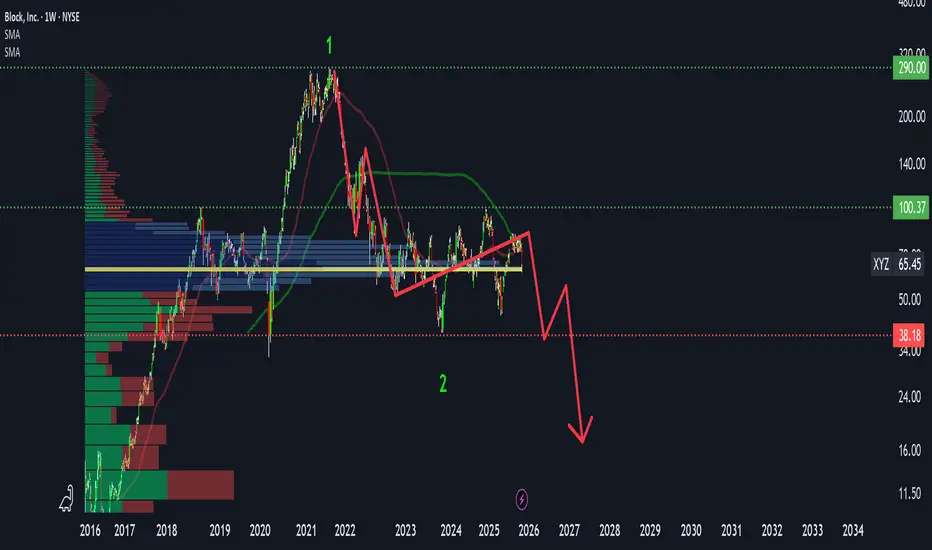
📈 Technical Structure
Technically, the stock has already corrected about –86% from its all-time high.
We’re currently sitting inside a major accumulation cluster between $50–80 — a very strong volume node.
If this cluster breaks down, the next major support zone is $8–15, which would imply a potential –90%+ drawdown, typically a “pre-bankruptcy” level of decline.
After the latest earnings report, XYZ dropped by nearly 18%, forming a noticeable gap down. However, the volume on this sell-off was relatively low compared to the massive volume spikes seen in July 2025.
Typically, such sharp post-earnings drops come with high capitulation volume, signaling panic selling and potential bottom formation, but this time, that confirmation is missing.
This raises the risk that the current decline might not yet be over, and that smart money may still be waiting lower, around the next demand zone.
From a wave-structure perspective, it looks like wave 1 is complete, followed by a sharp corrective move that has already exceeded the typical 38–62% retracement range, falling by about 86%, an unusually deep correction, but not impossible within a prolonged cycle.
The ongoing consolidation phase has lasted significantly longer than previous ones, which increases the probability of a final downward push, forming a classic zigzag pattern (A–B–C), a drop, consolidation, and one more leg down to complete seller capitulation.
Volume patterns in such structures usually peak in the middle of the formation, aligning with current price behavior.
Technically, both outcomes remain open,
we could see a short-term bounce from this zone or a double zigzag (dZ) structure unfolding lower before the true bottom forms.
Upside momentum currently lacks fuel, fundamentals don’t support a strong rally yet.
If price breaks above $100, the next upside target sits around $280, offering roughly 4× potential from current levels.
So the setup remains binary, either accumulation continues before reversal, or we break down further in sync with BTC weakness.
⚠️ Risk View
Fundamental growth has stalled.
Earnings miss raises red flags.
Bitcoin exposure magnifies downside risk.
If price breaks below $32–30, that would confirm a breakdown, potential free-fall to $8–15.
On the positive side, the company stopped share dilution, maintains good liquidity, and still has strong brand power in fintech.
🧩 My Position
I currently hold a protected position (protective puts) till march 2026, limited downside, but I’m considering a full exit.
There’s no visible fuel for strong upside, and with BTC risk rising, the short-term picture remains shaky.
If we see capitulation into the $30–40 range with BTC bottoming, that could be a smart-money accumulation zone again.
🔑 Key Levels
$100 → breakout confirmation, opens path to $280
$50–80 → main accumulation cluster
$32–30 → invalidation / stop-loss zone
$8–15 → next major demand zone if breakdown continues
🧭 Summary
Block’s fundamentals are slowing, its Bitcoin exposure is a double-edged sword, and technically we’re at a critical level.
If BTC corrects sharply, Block could retest the $30–40 area or even lower, but if it holds and reverses above $100, the next bull wave could be massive.
At this stage, risk management and patience are key.
$IREN – First 20 SMA Retest + Flag Breakout SetupIris Energy ( NASDAQ:IREN ) is setting up a powerful flag breakout after its first real pullback of this entire move — and it’s happening right as crypto momentum heats up again.
🔹 The Setup:
After a strong rally from $50 → $75, NASDAQ:IREN pulled back in a controlled, low-volume correction.
Price undercut the 20 SMA, quickly reclaimed it, and now sits back above the 9 EMA — a perfect base reset.
Tight flag pattern forming, primed for expansion once momentum kicks in.
🔹 Crypto Sector Strength:
CRYPTOCAP:BTC and CRYPTOCAP:ETH both popped this weekend — that’s classic risk-on behavior.
The entire crypto stock basket is running hot, with leaders like NASDAQ:CIFR and NASDAQ:IREN showing clean technical setups.
This is the first 20 SMA test of the move — historically the most powerful retest in trending names, as late buyers finally get their chance to enter.
🔹 My Trade Plan:
1️⃣ Entry Zone: Watching dips Monday or Tuesday to build a position near the 9 EMA / 20 SMA zone.
2️⃣ If It Gaps Up: I’ll skip swing entries and just day trade the strength — no chasing.
3️⃣ Stop: Below the 20 SMA — tight, logical risk level.
Why I Like This Setup:
First 20 SMA test after a big run = high probability continuation.
Crypto momentum is back — strong sector correlation.
Technical structure is perfect: shallow pullback, rising EMAs, and a clear trigger.

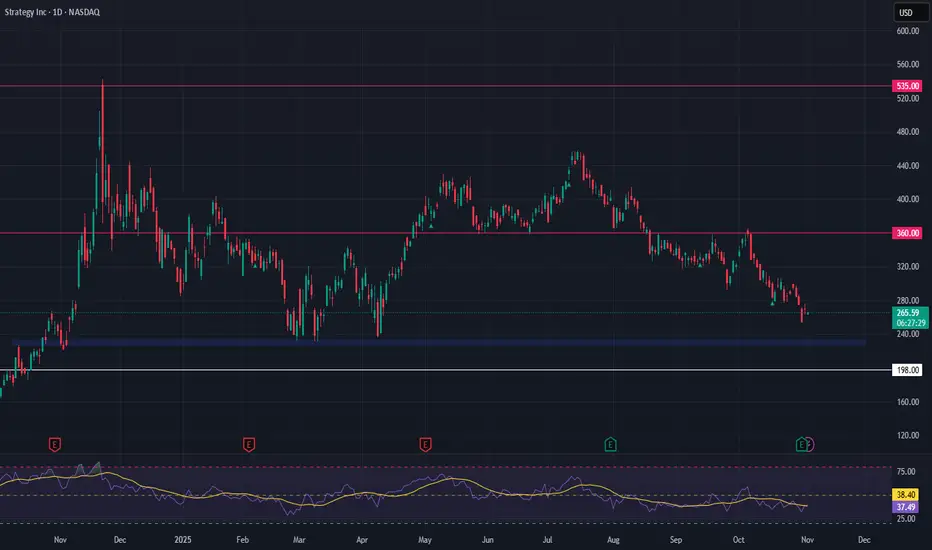
Strategy Inc (MSTR) – High-Beta Bitcoin Proxy at Key SupportStrategy Inc NASDAQ:MSTR has delivered another strong quarterly report, underscoring its continued commitment to aggressive Bitcoin accumulation. With over 158,000 BTC on the books, MSTR has firmly positioned itself as a leveraged proxy for Bitcoin, offering equity traders indirect crypto exposure. This bold balance sheet strategy has also pushed MSTR into alignment with S&P 500 inclusion criteria — a potential catalyst if index inclusion materializes.
Technically, the stock is now retesting a key support zone between $228 and $233. This level has historically held well and may offer a high-conviction entry for those anticipating a BTC rebound. Should Bitcoin aim for new highs, MSTR could respond with outsized upside, though traders must account for the volatility and downside risks that come with crypto-correlated equities.
🎯 Trade Setup:
Entry Zone: $228 – $233
Take Profit Targets: $360 and $535
Stop Loss: $198
This setup offers a high-risk, high-reward opportunity. As always, manage position size carefully and watch BTC price action for confirmation.
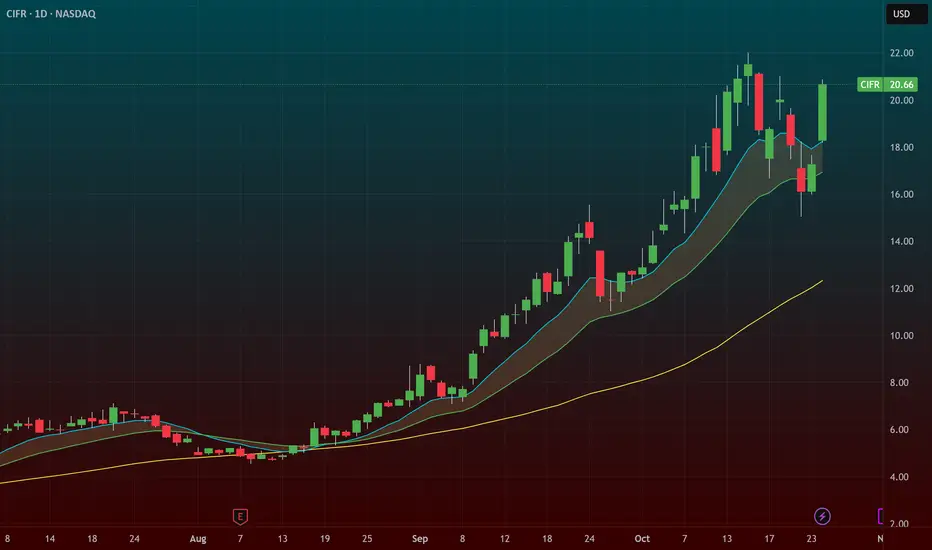
$CIFR – First 20 SMA Test + Flag Breakout SetupCipher Mining ( NASDAQ:CIFR ) is shaping up beautifully here — a flag breakout pattern forming right after a healthy pullback to the 20 SMA, something we haven’t seen during this entire run.
🔹 The Setup:
Pulled back from $22 → $15, finding strong support right at the 20 SMA.
Now back above the 9 EMA, showing buyers are stepping in early.
The chart has a tight flag pattern, ready to expand if crypto momentum holds.
🔹 Crypto Sector Context:
CRYPTOCAP:BTC and CRYPTOCAP:ETH both ripped over the weekend — classic sign of renewed risk appetite.
The entire crypto stock basket looks strong, and NASDAQ:CIFR + NASDAQ:IREN are the leaders.
This is the first real 20 SMA test of the move — often the best risk/reward entry point as dip buyers who missed the run jump in.
🔹 My Trade Plan:
1️⃣ Entry Zone: Watching for dips Monday or Tuesday to build a position near the 9 EMA.
2️⃣ If It Gaps Up: I’ll skip swing entries and just day trade it — avoid chasing strength.
3️⃣ Stop: Under the 20 SMA — clear line of invalidation.
Why I Like This Setup:
First 20 SMA retest = historically powerful spot in trending names.
Tight flag structure with crypto sector tailwinds.
Market psychology favors second-wave momentum plays like this one.
—
BMNR: potential start of a new swing move Still early in development and price has a lot to prove before confirming a sustainable trend shift, but it might be attempting to start a new swing from today’s action.
The key task for bulls is to see closes above the EMAs and the formation of a higher low to confirm stability of upside momentum.
Conversely, a breakdown below the 44–42 support zone would increase odds for further downside and invalidate the potential reversal setup.
Chart:

COIN at Support – Looking for a Year-End RallyWe’re closely watching the crypto market for a potential bottom over the next two weeks, with expectations of a recovery into year-end. This broader momentum could translate into a strong rebound for Coinbase NASDAQ:COIN , which often moves in sync with the crypto space. Price has now reached a key support zone, which could serve as the foundation for a bullish reversal.
Currently, COIN is trading around $310–$320, a zone where previous buying interest has emerged. I'm looking for price to stabilize and confirm support here before entering a long spot trade. If this support holds, it could open the door to a multi-leg rally into the end of the year.
🛠 Trade Setup
Entry: $310–$320
Take Profit Targets: $360–$390 and $415–$440
Stop Loss: Below $303

RIOT – Short-Term Bullish SetupNASDAQ:RIOT completed its wave 4 pullback after attracting buyers at the #BlueBox support zone of $18.34–$17.24, and has already reacted higher from that level.
Currently, the wave ((ii)) correction is unfolding in 3 swings, reaching another equal legs area at $20.49–$19.58, where price is expected to resume the rally if support holds.

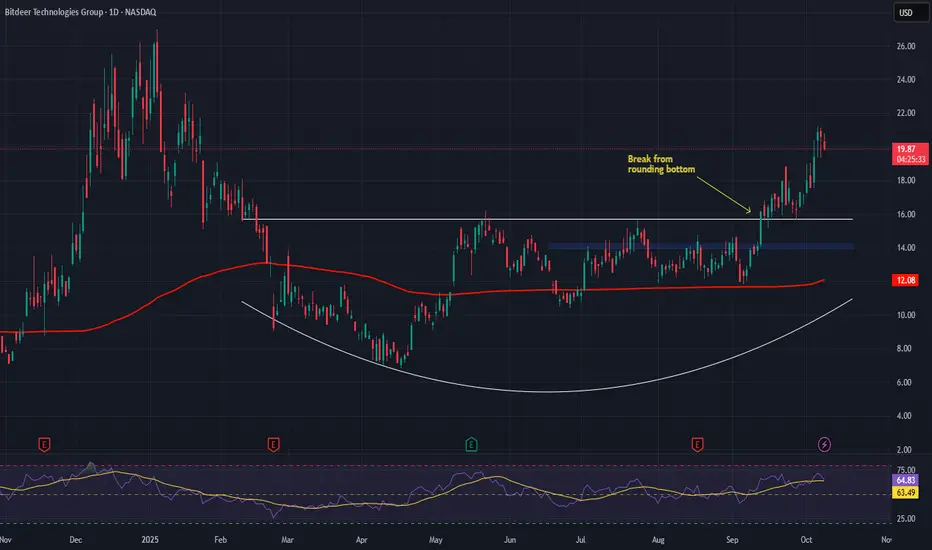
BITDEER – Bullish Outlook as Blockchain Meets AI PowerhouseBitdeer Technologies Group NASDAQ:BTDR is gaining serious traction as a dual-play on blockchain infrastructure and AI-driven compute power. The company operates at the intersection of crypto mining and artificial intelligence cloud services, offering exposure to two of the most dynamic sectors in tech.
🔍 Key Catalysts:
🚀 Revenue Momentum
Q2 2025 revenue surged +56.8% YoY, driven by expanding mining operations and renewed Bitcoin market strength.
📈 Massive Hashrate Growth
Bitdeer targets 40 EH/s of self-mining capacity by October, making it one of the largest global mining operators, well-positioned to ride institutional Bitcoin adoption.
🧠 AI Infrastructure Expansion
Transitioning beyond pure crypto, BTDR is doubling down on high-performance computing (HPC). Its AI Cloud platform, which won the 2025 AI Breakthrough Award, utilizes 1.6 GW of power capacity to run demanding AI workloads—marking a major evolution in the company’s model.
🌍 Global Footprint
A diversified presence across multiple geographies adds scalability and shields against regulatory shifts—a key edge in today’s policy-sensitive environment.
📌 Technical Setup:
We are bullish above the $14.00–$14.25 breakout zone. Sustained price action above this level could pave the way for an upside target of $27.00–$28.00 in the medium term.
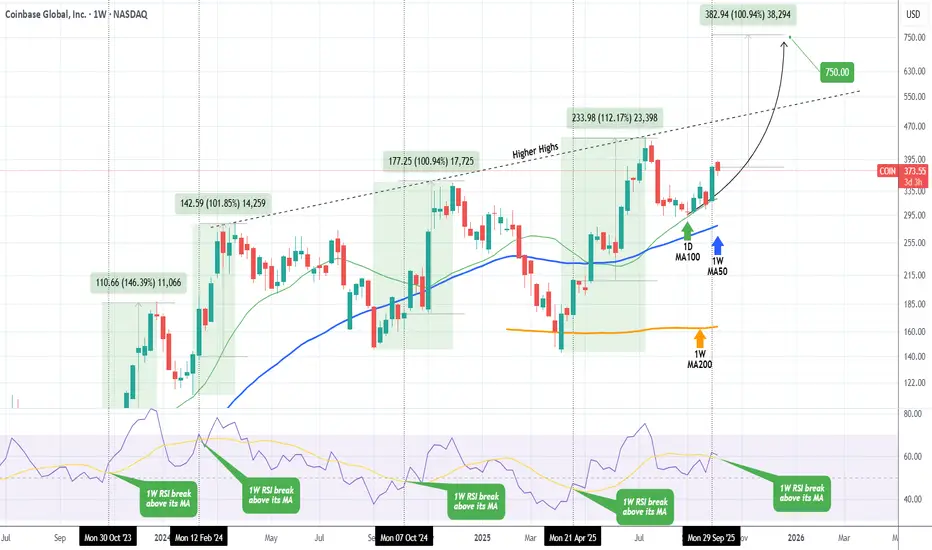
COINBASE Last time it did this, it rallied at least +100%Coinbase (COIN) has set eyes on its Higher Highs trend-line again, the very same structure which we targeted successfully ($400 Target) on our buy signal 5 months ago (May 07, see chart below):
This time we have in our hands perhaps the strongest bullish confirmation signal of this Cycle, the 1W RSI breaking above its MA trend-line. This took place last week and every time Coinbase did this in the past 2 years, it rallied by at least +100%.
If that's repeated, it means the price would target $750, which is however well above the Higher Highs trend-line. A solid strategy would be targeting the Higher Highs trend-line initially and if the price breaks above it and re-tests/ holds it as Support, re-buy and then target $750.
-------------------------------------------------------------------------------
** Please LIKE 👍, FOLLOW ✅, SHARE 🙌 and COMMENT ✍ if you enjoy this idea! Also share your ideas and charts in the comments section below! This is best way to keep it relevant, support us, keep the content here free and allow the idea to reach as many people as possible. **
-------------------------------------------------------------------------------
💸💸💸💸💸💸
👇 👇 👇 👇 👇 👇
COIN Don’t Miss Out: eye-catching$330C
# 🚀 COIN Options Alert 🚀
🎯 **Setup**: Long \$330C
💵 **Entry**: \$6.35 | 📈 **Target**: \$9.53 (+50%) | 🛑 **Stop**: \$3.81
📊 **Confidence**: 60% | ⚡ Low VIX + Bullish Flow | ❗ Weak volume risk
💡 **Key Watch Levels**:
* 🔑 \$325 breakout = strong bullish confirmation
* ⚠️ Below \$291 = bearish trigger zone
⏰ Time-sensitive: 4DTE — manage risk, avoid holding into Friday’s close!
---
📌 **Hashtags **:
\#COIN #CryptoStocks #OptionsTrading #WeeklyOptions #TradingSignals #StocksToWatch #OptionsFlow #CallOptions #TradingView #StockMarket #COINbase #OptionsAlerts

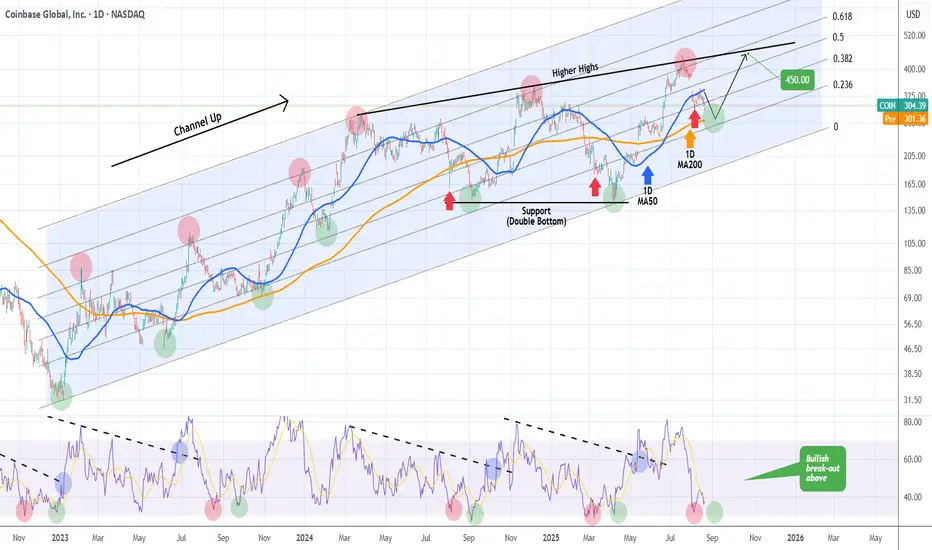
COINBASE about to issue a massive buy signal.Last time we looked at Coinbase (COIN) was more than 3 months ago (May 07, see chart below) where we gave a strong buy signal on its 1D MA50 (blue trend-line), which instantly delivered a rally that eventually hit our $400 long-term Target:
The stock has since dropped off its All Time High (ATH) and is trading right now below its 1D MA50 (blue trend-line). The 1D RSI has given perhaps the most optimal Buy Signal when it double bottoms (red and green circles).
At the moment it has made the first Low and we are anticipating the second, which might very well be on the 1D MA200 (orange trend-line). That would be the signal for maximum gains and our Target will be on the Higher Highs trend-line at $450.
-------------------------------------------------------------------------------
** Please LIKE 👍, FOLLOW ✅, SHARE 🙌 and COMMENT ✍ if you enjoy this idea! Also share your ideas and charts in the comments section below! This is best way to keep it relevant, support us, keep the content here free and allow the idea to reach as many people as possible. **
-------------------------------------------------------------------------------
💸💸💸💸💸💸
👇 👇 👇 👇 👇 👇
Major Coins and Crypto Stocks Pump — Thank Landmark GENIUS BillBitcoin BITSTAMP:BTCUSD making ATHs? Old news. But Coinbase NASDAQ:COIN and Robinhood NASDAQ:HOOD hitting those record-high notes? And XRP BITSTAMP:XRPUSD dangerously close to eclipsing its own peak, while Ethereum keeps chugging along toward $4,000? Now we’re talking.
In a market-friendly twist, President Trump signed the GENIUS Act into law on Friday — a sweeping legislative win for crypto. Short for Guiding and Establishing National Innovation for US Stablecoins, the GENIUS Act marks the first major federal framework for digital assets and, more importantly for traders, triggered a firestorm of price action across the space.
Flanked by crypto executives, Republican lawmakers, and a few NFT bros in suits, Trump called the stablecoin-focused bill “perhaps the greatest revolution in financial technology since the birth of the internet.” Bold claim. But judging by what the market’s doing — he might actually be onto something.
The bill, passed 308 to 122 in the House, lays the groundwork for US banks to issue their own stablecoins and create a regulatory moat that finally separates innovation from legal whack-a-mole.
But wait, that’s not all. The House also passed the CLARITY Act and the Anti-CBDC Surveillance State Act. The first one will help determine if cryptos will be considered securities and the second one bans the Federal Reserve from issuing its own coin.
🚀 Crypto Market Cap Hits $4 Trillion
As the bill cleared Congress and Trump picked up the pen, the entire crypto market cap exploded past $4 trillion for the first time in history with the orange coin holding more than 60% of the market .
It wasn’t just Bitcoin BITSTAMP:BTCUSD making noise (although it did quietly retest $120,000 boasting a $2.4 trillion valuation, or more than that of Google parent Alphabet NASDAQ:GOOGL ).
The real momentum was coming from the stocks and altcoins — especially those with exposure to the suddenly green-lit US regulatory scene.
📈 Coinbase: To the Moon and Beyond
Let’s talk about Coinbase, ticker symbol NASDAQ:COIN , and now also, apparently, ticker symbol 🚀.
Shares surged over 8% on Friday to hit a new record session high of $445, giving the US-based exchange a market cap of over $100 billion. Not bad for a company that spent most of 2022 playing dodgeball with the SEC.
The GENIUS Act (and its siblings) cleared a path for institutional crypto adoption — and no one stands to gain more than Coinbase. It’s the go-to exchange for institutional custody and compliance. And now, with banks dipping their toes into stablecoin waters, guess who gets to facilitate those flows? Exactly.
Coinbase has now rallied over 63% year-to-date, putting it back into market darling territory — and giving early bulls a solid reason to post their PnLs again.
📊 Robinhood: Meme Stock No More?
Wait, what’s that clamor? It’s the “HOOD to $100” crowd dusting off their 2021 hats.
Robinhood NASDAQ:HOOD also saw a serious lift from the legislative push — hitting an all-time session high of $113 on Friday. The shares are up 180% in 2025 alone.
While most remember Robinhood for its meme stock legacy, the app has quietly built a towering crypto trading platform in the US. And now, with Congress cracking open the stablecoin lane and clearing legal fog, it’s suddenly a real contender in the digital asset arms race.
Add to that Trump’s pledge to dismantle crypto-hostile policies from the previous administration (many of which affected Robinhood’s crypto operations), and it’s no wonder the stock is flying.
💰 Stablecoins: Boring Coins Are Now Big Biz
You’d be forgiven for snoozing through most stablecoin headlines. After all, they don’t moonshot or do anything but sit idle.
But make no mistake — this is where the real money’s watching. JPMorgan CEO Jamie Dimon, not known for casual crypto endorsements, said last week his bank will now be “involved in both JPMorgan deposit coin and stablecoins.”
That’s a seismic shift. For years, traditional banks sat on the sidelines while Circle CRYPTOCAP:USDC and Tether CRYPTOCAP:USDT built billion-dollar stablecoin empires. Now, thanks to the GENIUS Act, the door is open for regulated banks to issue digital dollars backed by FDIC-level trust — and potentially eat into the DeFi-native players’ lunch.
Boring’s about to get very profitable.
💥 XRP: Return of the Ripple?
You know it’s a bull market when XRP BITSTAMP:XRPUSD shows up uninvited and still gets the VIP booth.
The one-time courtroom drama token surged over 60% in the past two weeks, hitting $3.50 and inching dangerously close to its all-time high. Ripple’s comeback arc may finally be getting its payoff.
With legal pressure fading and Congress setting new guardrails for digital assets, XRP’s regulatory risks just got a lot less scary. Plus, institutions looking for faster cross-border rails may find XRP’s network a bit more attractive when Washington’s no longer breathing down its neck.
🐂 Ethereum: Quietly Eyeing $4,000
Ethereum BITSTAMP:ETHUSD might not be making headlines like Bitcoin or XRP, but don't let the quiet confidence fool you.
ETH has been rising steadily, gaining almost 50% in the last two weeks, and Monday morning was trading just shy of $3,800. With regulatory uncertainty waning, and the market treating Ether more like an investment than a utility token, it’s slowly reclaiming its 2025 highs.
Factor in the growing number of ETH-based ETFs , tokenized real-world assets (hello, Treasury bills onchain), and the boom in stablecoins running on Ethereum rails… and you’ve got a slow-burn bull case building brick by brick.
🦅 Washington, WAGMI?
So, what’s the takeaway?
For the first time, Congress passed crypto legislation that didn’t come with a hidden poison pill. The GENIUS Act, along with the CLARITY Act, have made more legislative progress in a week than years of courtroom wrangling and ETF lobbying combined.
Trump, with his pro-crypto stance and deep industry ties (after all, he did launch his own coin not too long ago), just turned crypto into a political weapon — and a market darling. Is 2025 shaping up to be the year Washington went full Web3?
Let’s hear it from you : Drop your thoughts in the comments and let’s spin up the discussion.
