Is #IOTA Ready For a Major Bullish Wave or Will it Fall Further?Yello, Paradiser! Are you ready for what could be a brutal shakeout for bears or a golden entry for bulls on #IOTAUSDT? This falling wedge might not stay quiet for long. Let’s break down the #IOTA Setup:
💎#IOTAUSD is currently trading around $0.084 on the 4H timeframe and has just broken out of a textbook falling wedge pattern. This pattern typically signals a bullish reversal, but only when confirmed by proper retest and strength.
💎We’ve already seen a breakout followed by a retest of the descending resistance, which is a key early sign that momentum might be shifting. Adding to that, the 50 EMA is now attempting to turn into support, and if it holds, it significantly increases the probability of a strong bullish follow-through.
💎The demand zone between $0.080 and $0.084 is now acting as the make-or-break level for bulls. Holding above this zone keeps the bullish setup alive. If price continues to build structure above this area, we could see acceleration toward the first major resistance at $0.100, followed by a strong resistance near $0.120, where we expect sellers to become more aggressive.
💎However, as always, risk management comes first. The bullish thesis is invalidated if price breaks below the key support at $0.0717, where the structure would be compromised, and a bearish continuation toward lower liquidity zones could begin.
Trade smart, Paradisers. This setup will reward only the disciplined.
MyCryptoParadise
iFeel the success🌴
Cryptotrader

SOL/USDT – This Reclaimed Level Could Send SOL Flying Again#SOL has finally reclaimed a major resistance zone, now acting as strong support. This level previously rejected price hard, and the successful reclaim signals a potential trend continuation.
Momentum is clearly shifting bullish, and as long as price holds above this reclaimed zone, the upside scenario remains highly favored. This is the type of structure that often leads to fast expansions once liquidity above gets targeted.
Bias: Bullish continuation
Invalidation: Loss of the reclaimed support zone
📊 Risk/Reward: 1:2
⚠️ DYOR (Do Your Own Research)

ZKP/USDT – This Accumulation Could Be the Next Big BouncePrice has been bleeding inside a clear downtrend, but the momentum is now slowing down. We are seeing strong accumulation at the base, right after price tapped the demand zone and reacted sharply.
The descending trendline is being pressured, and any sustained hold above this area increases the probability of a trend reversal rally. This is the type of zone where smart money typically builds positions before expansion.
If price continues to respect the accumulation base, the path toward higher liquidity becomes very clear.
Entry Zone: Current price area
Stop Loss: 0.1272
Target 1: 0.15427
Target 2: 0.17220
As long as the base holds, the bullish scenario remains valid.
Failure to hold the base invalidates the setup.

BREV/USDT Bullish Continuation ready to explode??BREV/USDT – Demand Reclaim Long Setup
Price has reacted strongly from the demand zone and reclaimed the key level above it. Structure is shifting bullish, opening the door for continuation toward higher liquidity.
Entry: 0.3968 – 0.4057
Stop Loss: 0.3648
TP1: 0.4542
Final TP: 0.5205
Bias remains bullish as long as price holds above the reclaimed demand zone

This Breakdown Could Get Ugly for FARTCOIN Holders…Yello Paradisers! Is FARTCOINUSDT about to fall off a cliff? After printing a clean bearish divergence and breaking down of a rising wedge pattern, the warning signs are stacking up fast. If you’ve been following our latest market updates, this setup should feel very familiar and very dangerous.
💎Recent price action developed within a rising wedge, which has now broken to the downside, typically a bearish continuation signal. Before this, price had been grinding higher with weakening momentum, showing signs of exhaustion as it repeatedly tested resistance. Most importantly, we’ve now seen a clean internal Change of Character (I-CHoCH), confirming that bullish momentum is fading. Price also left behind a Fair Value Gap (FVG), which could still be filled before any further drop. This only adds confluence to the bearish scenario we’ve been tracking.
💎Momentum-wise, a strong bearish divergence appeared on the histogram just as price tapped into the key resistance zone. The red zone above 0.32 is acting as a major supply wall. Unless we see a confirmed candle close above it, the current structure favors the downside. That’s the invalidation level, if bulls reclaim it, the short thesis is off the table. Until then, bears are in full control.
💎Looking ahead, the first key support lies at 0.2713. A breakdown below that could quickly open the door toward the major support zone around 0.2300—a potential -20% decline from current levels. The combination of a rising wedge breakdown, bearish divergence, and heavy rejection at resistance gives this setup a high-probability bearish continuation outlook.
🎖But it never is, and never will be a free ride. Make sure you play it smart, Paradisers; the next 6–9 months will be juicy for some and painful for others. Discipline, patience, robust strategies, and trading tactics are the only ways you can make it long-term in this market.
MyCryptoParadise
iFeel the success🌴

MYXUSDT Bounce from Major Demand Zone – Bull Reversal Loading?Traders, eyes on MYXUSDT.P! 📈
After a steep downtrend from highs, price has finally hit the key order block demand zone (green area ~4.80-5.16) on the daily/weekly structure.
We saw a classic liquidity sweep below (red zone ~4.56), trapping sellers, followed by a strong bullish candle reversal – this screams potential trend change!
Bullish setup:
Entry: Current levels or pullback to OB support (~5.00-5.16)
Target 1: $5.80
Target 2: $6.40-6.80
Extension: Back to $7.00+
Invalidation: Close below $4.56 (bear trap fails)
Higher timeframe aligns with accumulation – could be the bottom!
Are you bullish on MYX here or waiting for more confirmation? Share your thoughts below! 👇 🔥
If you like precise, no-hype analyses like this, smash that BOOST 🚀, LIKE 👍, and FOLLOW for more daily crypto setups. Let's catch the next big move together! 💰
#MYX #MYXUSDT #Crypto #PerpTrading #Altcoins

XRPUSD: Important Breakout
XRP violated a significant daily resistance cluster yesterday.
The broken structure turned into an important demand zone now.
With a high probability, the price will go up from there and reach 2.51 level soon.
❤️Please, support my work with like, thank you!❤️
I am part of Trade Nation's Influencer program and receive a monthly fee for using their TradingView charts in my analysis.

XRP Breakdown Loading...Are You on the Right Side of the Market?Yello Paradisers, are you prepared for what could be a brutal XRPUSDT reversal? If you missed the latest fake breakout above $1.96, this might be your last chance to position smartly before the market punishes the late entries.
💎After multiple rejections, XRPUSDT is once again trading within a heavily manipulated resistance zone. Price action shows clear signs of exhaustion after sweeping liquidity above the previous highs. The inducement move was textbook, dragging in breakout traders just before reversing hard. This kind of move typically signals smart money is offloading positions while retail gets trapped.
💎We’ve already seen multiple internal structure shifts, including an internal Change of Character (I-ChoCH) and Break of Structure (I-BOS). These are strong bearish signals on the lower timeframes, especially when combined with a Fair Value Gap (FVG) rejection at the golden pocket between the 0.5 and 0.618 Fibonacci retracement levels. Unless XRP can close a strong candle above the $1.96 resistance, this move looks more like distribution than continuation.
💎From here, the first downside target sits at the $1.8262 support level. However, if that zone fails to hold, we’re eyeing a deeper move towards the major support around $1.7450–1.7500. That’s also where a large pool of liquidity sits, marked on our chart as "$$$" making it a likely magnet for price. This zone could serve as the next point of interest for accumulation, but only if approached with patience and precision.
💎Right now, emotions are your biggest enemy. Don’t get tempted by hype or fear of missing out. Stick to your levels, respect invalidation, and let the market come to you.
🎖But it never is, and never will be a free ride. Make sure you play it smart, Paradisers; The next 6–9 months will be juicy for some and painful for others. Discipline, patience, robust strategies, and trading tactics are the only ways you can make it long-term in this market.
MyCryptoParadise
iFeel the success🌴

XMR keeps failing at 450 resistance, is a major breakdown comingYello Paradisers— how many times can XMRUSDT hit the same wall before it collapses for good? The rejection from the 448 to 450 zone is starting to look like more than just noise.
💎XMRUSDT respected an ascending channel for a while but that structure has now clearly broken. The recent breakdown along with an internal CHoCH signals a shift in short-term momentum. The impulsive rejection has cooled off the buyers and the current consolidation just below the broken channel shows that sellers are gaining control while buyers struggle to hold ground.
💎After the breakdown, price made a corrective attempt but was quickly rejected again around the 0.5 to 0.618 Fibonacci retracement area. This zone has now become a supply region and continues to suppress any bullish attempts. As long as price stays under that structure with no strong bullish displacement the bias remains bearish with a likely push toward lower liquidity zones and key support levels.
💎This view changes only if price closes a strong candle above the 450 resistance. That would reclaim the previous range high, cancel the bearish structure shift and signal renewed bullish strength with potential to target higher liquidity above the current range.
🎖Right now is not the time for emotional moves. Stay calm and stay focused. We are only interested in the cleanest and most high probability setups. That is how you win in this game long-term.
MyCryptoParadise
iFeel the success🌴

BNB About to Crash Hard or Just Faking You Out?Yello Paradisers, is BNB setting up for a major dump, or is this just another trap for impatient traders? This next move could catch a lot of people off guard if they're not paying attention to key levels.
💎BNBUSDT is currently looking bearish, as it's reacting strongly from a key resistance zone. This level is further reinforced by the 200 EMA, making it a significant area of confluence. On top of that, price has recently broken down from an ascending channel, which adds further confirmation to the potential shift in trend direction. When these signals line up like this, the probability of a bearish move increases substantially.
💎Now, ideally, we want to see a pullback into the resistance zone. That would give us a much better risk-to-reward entry for a potential short. However, entering blindly is never the move — we need clear confirmation. Specifically, we’ll be watching for a strong bearish candlestick pattern to form right at the resistance zone. If we get that, we can then expect a move toward the next liquidity zones and support levels below.
💎That said, we must stay objective. If BNB manages to break above the invalidation level and closes a candle beyond that point, it will completely invalidate the current bearish outlook. In that scenario, it's better to stay out and wait patiently for stronger price action to develop. There’s no need to force trades when the setup isn't perfect.
🎖Strive for consistency, not quick profits. Treat the market as a businessman, not as a gambler.
MyCryptoParadise
iFeel the success🌴

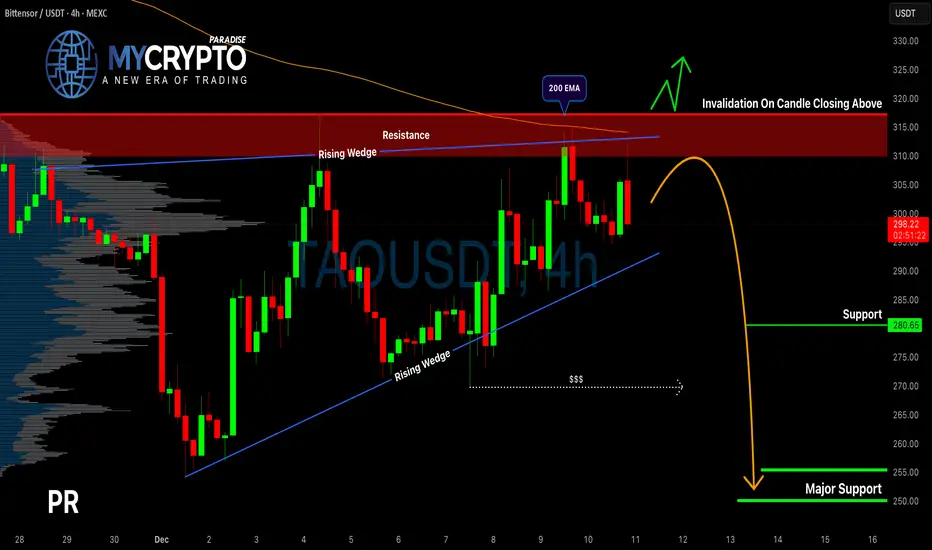
TAO Showing Weakness at Resistance — Is a Breakdown Imminent?Yello Paradisers! Are we about to witness a sharp rejection from resistance… or is this just the calm before the breakout storm?
💎TAOUSDT is currently reacting from a strong resistance zone and what makes things even more interesting is the rising wedge pattern that has formed in this area. This type of structure historically points to a higher probability of a bearish move, and right now, the conditions are lining up for potential downside.
💎But to secure a better risk-to-reward (RR) setup, a small pullback from the current level would be ideal. After that, we’ll look for a clear bearish candlestick formation to confirm entry. The main targets lie below, around the liquidity pools and key support zones, which also align with strong long-term levels.
💎Still, there’s one critical invalidation point:
If the price breaks and closes above the resistance zone, it would invalidate the entire bearish setup. In that case, the smart move is to wait patiently for a cleaner structure and more reliable signals before acting.
🎖This is what trading like a professional looks like, clear setups, no emotional bias, and total commitment to risk management. It's not about predicting every move perfectly, it's about positioning only when the odds are in your favor.
MyCryptoParadise
iFeel the success🌴
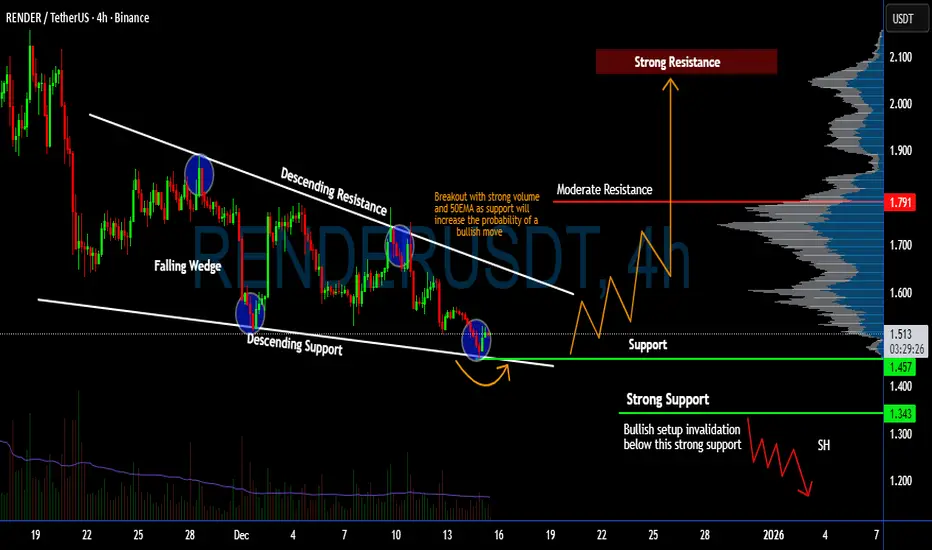
Will #RENDER Recover From Here or Not? Major Signs FlashingYello, Paradiser! Are you watching how #RENDERUSDT is respecting this falling wedge structure? Is a recovery on the horizon? Let's view the #Render setup:
💎#RENDERUSD is currently sitting right at the wedge's descending support after multiple rejections from the upper resistance trendline. Each touch of this support has triggered buyer interest, and if we see a breakout with strong volume, especially reclaiming the 50EMA, it could confirm a bullish shift.
💎This exact price action setup, a falling wedge paired with volume contraction, is a classic pre-breakout scenario. If the price pushes above the descending resistance with strength, it opens the path toward the moderate resistance around $1.79, with a potential continuation toward the strong resistance zone near $2.10.
💎On the downside, the strong support at $1.34 is critical. If we see a clean breakdown below that level with no recovery, it would invalidate this bullish setup and open the door for a deeper retracement into the low $1.20s. So far, however, buyers are stepping in aggressively whenever price dips into this support range — a sign of ongoing accumulation.
💎The next 1-2 candles will be crucial. A breakout above the wedge with volume confirmation could trigger a fast squeeze as short positions unwind and momentum buyers rush in. But patience is key, wait for the breakout and retest for the highest probability setup.
Trade smart, Paradisers. This setup will reward only the disciplined.
MyCryptoParadise
iFeel the success🌴
SIREN Looks Bearish (1D)It appears to be forming a triangle, and we are currently in the final wave, Wave E, of this triangle.
We have identified two entry zones for taking a sell/short position, entering in two stages at each level.
The targets of this triangle are marked on the chart, and we will take partial profits at each stage.
A touch of the invalidation level will nullify this analysis.
For risk management, please don't forget stop loss and capital management
When we reach the first target, save some profit and then change the stop to entry
Comment if you have any questions
Thank You

BCHUSDT Bulls Beware? Price Just Triggered a Classic TrapYello Paradisers! have you noticed how BCHUSDT just tapped into a key resistance right after sweeping liquidity above previous highs? This could be the perfect bull trap, and what comes next might catch many traders off guard if they’re not prepared.
💎BCHUSDT has just taken inducement and is now reacting from a strong resistance zone. Price is currently moving within an ascending channel while also showing clear bearish divergence, a combination that increases the probability of a bearish move. This setup suggests that momentum is weakening despite higher price action, often a red flag for trend continuation.
💎Aggressive traders may already be looking to enter short from current levels. However, the more strategic and safer approach is to wait for another reaction from the resistance zone, ideally accompanied by a clear bearish candlestick pattern. That will give us a much higher probability entry with a more defined invalidation level. If this confirmation comes, we can then look to target the liquidity pools and support zones lying below.
💎That said, if BCHUSDT manages to break and close above the resistance zone with strength, it would completely invalidate our bearish scenario. In that case, it’s best to stay on the sidelines and wait for fresh price action to develop before taking any new trades. Chasing trades without structure is where most traders lose.
🎖Strive for consistency, not quick profits. Treat the market as a businessman, not as a gambler. Stay patient, disciplined, and focused only on high-probability setups, this is the only way you’ll make it long-term in this market.
MyCryptoParadise
iFeel the success🌴

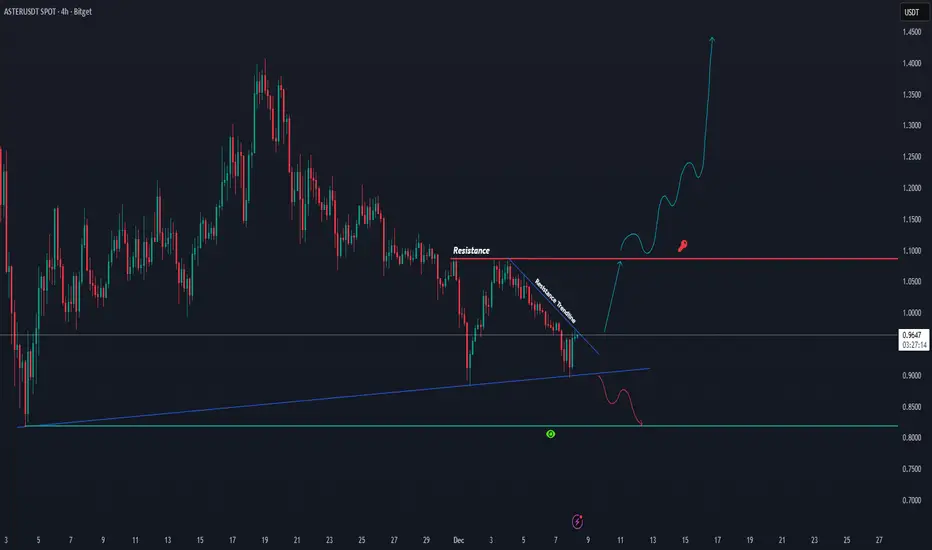
ASTER Squeezing Tight — Breakout Soon?#ASTER
ASTER is currently sitting right on its ascending support while still moving under the short-term resistance trendline. Price is compressing between these two areas, and a breakout in either direction is getting closer
🔥 If ASTER can break above the trendline and push through the resistance zone, momentum could flip bullish quickly and trigger a strong continuation move
🚀 But if it fails to hold the ascending support, a deeper pullback could follow
🔻 Right now, this is a classic “wait and react” setup — the chart is telling us the next big move depends on which side breaks first 👀
#ASTERUSDT
CARDANO (ADAUSD): Bullish Reversal Confirmed?!
There are multiple bullish clues on ADA on a daily time frame
that make me think that the market is ready for a reversal.
First, the price formed a high momentum bullish candle.
Then, the market violated a resistance line of a falling
wedge pattern.
A change of character occurred afterward.
The market has a great potential to rise more
and reach 0.474 resistance soon.
❤️Please, support my work with like, thank you!❤️
I am part of Trade Nation's Influencer program and receive a monthly fee for using their TradingView charts in my analysis.

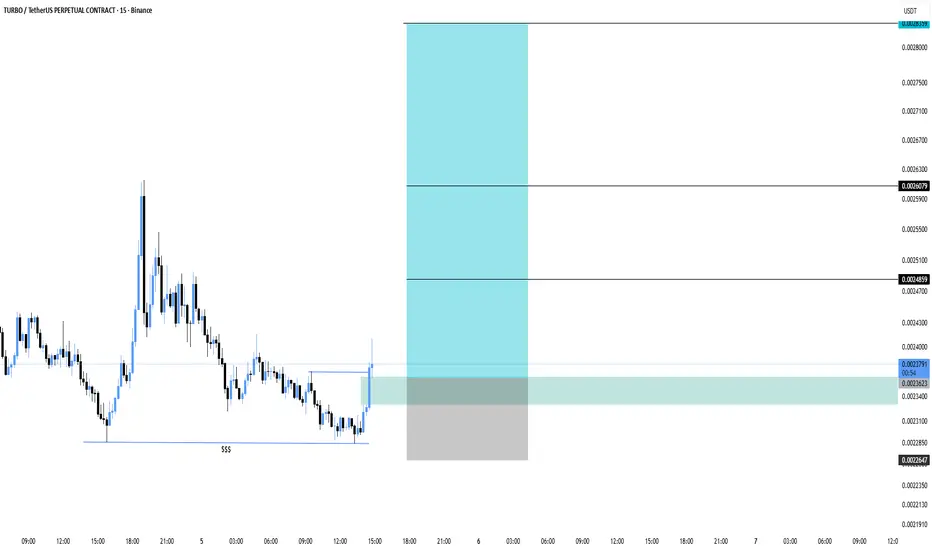
TURBO/USDT – Clean Long Setup After SweepPrice swept the liquidity (SSS) and instantly reacted with a strong bullish push. Structure is shifting short-term, giving a clean long opportunity as price taps the demand zone.
Entry: 0.0023623
Stop Loss: 0.0022647
TP1: 0.0024859
TP2: 0.0026079
Final TP: 0.0028359
#TURBO #TURBOUSDT #TURBOUSDTPERP
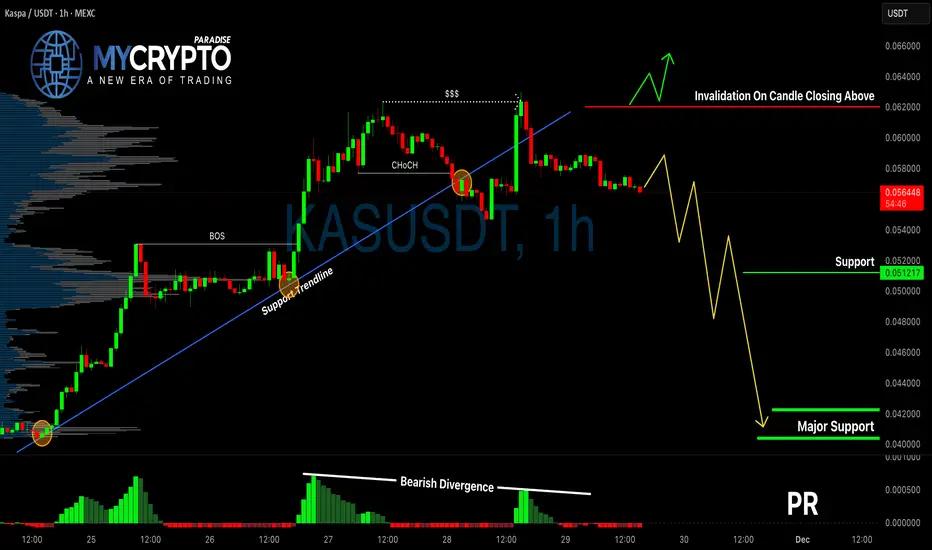
KASUSDT Breakdown Confirmed?Yello Paradisers, have you already positioned yourself on KASUSDT’s bearish move, or are you about to get trapped by a false bounce? The market just gave us a major clue, and ignoring it could cost you.
💎KASUSDT has officially broken below a critical supportive trendline, which was previously holding the structure intact. This breakdown wasn’t random—it came with a clean bearish CHoCH (Change of Character), and the MACD histogram is flashing a clear bearish divergence. These combined signals significantly increase the probability that this is not just a minor pullback, but the beginning of a more aggressive downside move.
💎From the current market level, there is already a straightforward 1:1 risk-reward opportunity on the table. However, if price pulls back toward the previous support (now resistance), that would offer a much better entry zone with improved risk-reward. But don’t jump in blindly—what we want to see at that level is a bearish candlestick confirmation. Without it, you're only guessing. With it, you’re trading with probability on your side.
💎On the flip side, if KASUSDT breaks out and closes decisively above the invalidation level, that would fully invalidate the current bearish thesis. In that case, it’s smarter to stay on the sidelines and wait for a new high-probability setup to form. This market doesn’t reward impulsive decisions—it rewards patience, discipline, and precision.
🎖Strive for consistency, not quick profits. Treat the market as a businessman, not as a gambler.
MyCryptoParadise
iFeel the success🌴
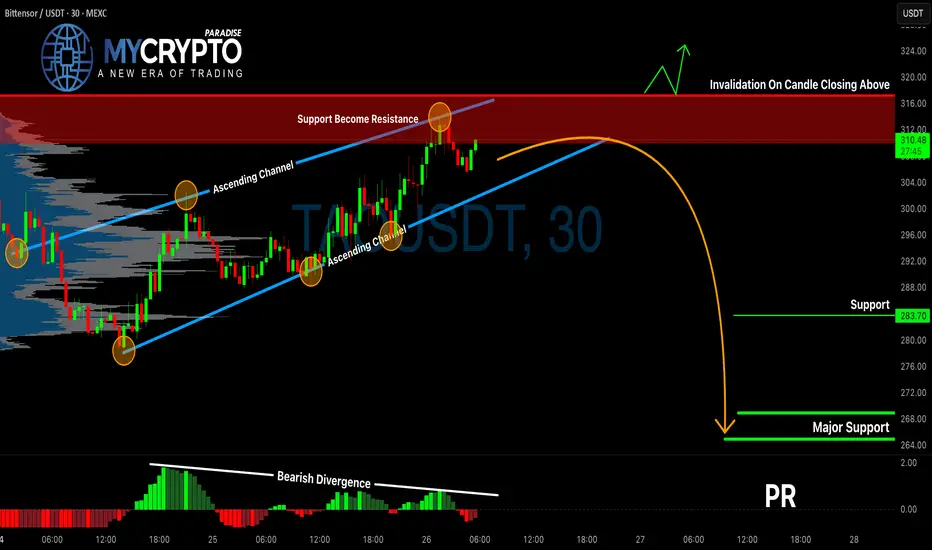
TAOUSDT Is Flashing a Dangerous SignalYello Paradisers, is this the calm before a major move down on TAOUSDT? The current setup is raising multiple red flags, and ignoring them could be a costly mistake.
💎TAOUSDT has formed an ascending channel, but what's critical to note is the bearish divergence on the MACD histogram, aligning perfectly with the previous support-turned-resistance zone. This combination of technical signals often precedes a breakdown, increasing the probability of a bearish move from current levels.
💎If the price pulls back slightly and prints a bearish candlestick pattern near this resistance zone, that would signal a high-probability short opportunity. The confluence of structure and momentum weakness offers a favorable risk-to-reward setup for traders who remain patient and disciplined.
💎However, if TAOUSDT breaks out and closes decisively above the invalidation level, the bearish outlook would no longer be valid. In that case, the best move is to step aside and wait for a stronger, more reliable setup to form before jumping back in.
🎖Strive for consistency, not quick profits. Treat the market as a businessman, not as a gambler. The market rewards patience, discipline, and strategy—never emotion.
MyCryptoParadise
iFeel the success🌴
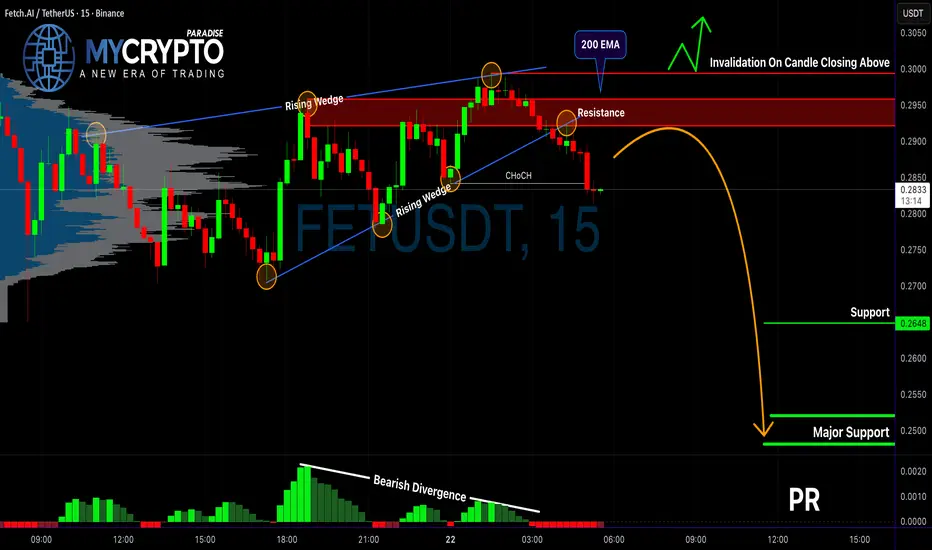
FET Breakdown: Is a Major Dump Just Getting Started?Yello, Paradisers! Have you seen what just happened on FET/USDT? The chart is flashing multiple warning signs, and if you’re not paying close attention, you could get caught on the wrong side of the next big move. Let’s break it down.
💎FETUSDT has officially broken out of a rising wedge pattern—a well-known bearish structure. This breakdown didn’t happen in isolation. It was accompanied by a clear bearish divergence, showing that while the price pushed higher, the underlying momentum was already fading. That’s a red flag for anyone still thinking bullish.
💎More importantly, price action has shown a bearish Change of Character (CHoCH), confirming a potential shift in the trend direction. On top of that, the recent rejection came precisely from the 200 EMA and a known resistance zone, both of which have historically acted as key turning points. When these factors align, they significantly increase the probability of a deeper move to the downside.
💎If the price pulls back from here, the smarter move is to wait for a bearish candlestick pattern to form right at the resistance zone. That would give a cleaner entry with stronger confirmation and a higher reward-to-risk ratio. While aggressive traders may be tempted to enter from current levels—where a 1:1 RR still exists—this is not a sustainable strategy over the long run. Discipline and patience are key if you want to stay consistently profitable.
💎However, if the price breaks out above our invalidation level and closes with conviction, the bearish setup becomes invalid. In that case, it’s best to step aside and wait for more favorable price action to form. There’s no need to rush; missing a trade is always better than forcing one with poor structure.
🎖Strive for consistency, not quick profits. Treat the market as a businessman, not as a gambler.
MyCryptoParadise
iFeel the success🌴
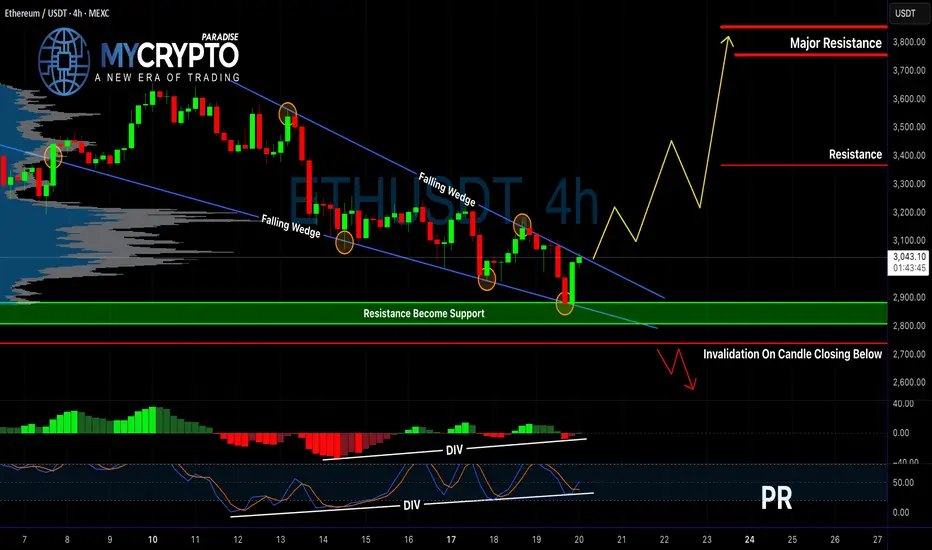
ETH About to Explode or Collapse?Yello Paradisers! Are you prepared for what’s coming next on ETHUSD? Because right now, Ethereum is sitting on the edge of a critical structure that could lead to a major breakout—or trap unsuspecting traders in another fake move. The setup is developing quickly, and what happens next will determine the short-term direction in a big way.
💎ETHUSD is currently forming a textbook falling wedge pattern, a structure often seen at the end of corrective phases and typically followed by strong bullish breakouts. What adds more weight to this scenario is the clear bullish divergence forming on both the MACD histogram and the Stochastic RSI. These indicators suggest that bearish momentum is weakening and bulls may be getting ready to take control.
💎For traders who prefer confirmation, the ideal move is to wait for a decisive breakout above the wedge. That would significantly increase the probability of a sustained bullish move and reduce the risk of being caught in a fakeout. However, for more aggressive traders, there may already be a reason to act. A bullish engulfing candle has formed directly at a key support level—an early signal that buyers are starting to step in with strength.
💎That said, we cannot ignore the invalidation scenario. If the price breaks down and closes candle below the defined invalidation level, the entire bullish outlook will be off the table. In that case, it will be crucial to stay patient and wait for a clearer price action setup to form before considering new positions.
Strive for consistency, not quick profits. Treat the market as a businessman, not as a gambler.
MyCryptoParadise
iFeel the success🌴
Will ARUSDT's Hidden Liquidity Grab Spark a Major Bullish Move?Yello, Paradisers — are you watching ARUSDT closely? Because this setup could develop into one of the cleanest short-term opportunities we’ve seen lately, but only for those who remain patient and calculated. The current structure is showing early signs of a potential bullish shift, and here’s what we’re seeing.
💎ARUSDT has displayed a proper bullish Change of Character (CHoCH) along with a Break of Structure (BOS), both occurring right after a clean sweep of seller-side liquidity. This kind of price action generally signals a potential reversal and significantly increases the probability of a short-term bullish continuation.
💎However, while the bias is clearly tilting bullish, jumping in at current price levels doesn't offer an optimal risk-to-reward setup. Entering now would only give about a 1:1 RR, which isn’t ideal for high-probability trading. The more strategic move would be to wait for a retracement back into the Fair Value Gap (FVG). If price pulls back into that zone and forms a clear bullish candlestick pattern, the probability of a strong move upward increases substantially, and the RR improves in our favor.
💎That said, the setup isn't without its invalidation. If ARUSDT breaks down and we get a candle close below the invalidation level, the entire bullish scenario becomes invalid. In that case, there’s no reason to force a trade. It’s smarter to stay patient and wait for a clearer structure to reappear.
🎖Strive for consistency, not quick profits. Treat the market as a businessman, not as a gambler. There will always be another opportunity, but only if you protect your capital and remain disciplined. Stay focused and let the setup come to you — not the other way around.
MyCryptoParadise
iFeel the success🌴

LINK is Waking Up—But Is This a Bull Trap or the Real Deal?Yello, Paradisers! Did you catch the breakout on LINKUSDT? It looks good at first glance, but there’s a critical detail that could make or break this move—don’t skip this analysis if you’re thinking about jumping in.
💎LINKUSDT has just broken out of a well-defined descending channel, a structure that often marks the end of a downtrend phase. What adds weight to this breakout is the presence of bullish divergence on both the MACD histogram and the Stochastic RSI, two reliable momentum indicators. This confluence significantly increases the probability of a bullish continuation, but that doesn’t mean it’s time to enter blindly.
💎For a higher-probability trade setup, what we want to see next is a small pullback. Ideally, the price should return to the breakout zone, allowing former resistance to flip into solid support. If this area holds, that’s where the opportunity lies—targeting the next major liquidity zones and resistance levels above.
💎However, caution remains essential here. If price breaks back down and closes a candle below the invalidation level, it would invalidate the bullish setup entirely. In that case, it’s far better to remain on the sidelines and wait for a cleaner structure to form, rather than forcing a position during uncertain conditions.
🎖Strive for consistency, not quick profits. This market rewards patience, discipline, and tactical execution. The next big opportunity is always around the corner—but only for those who stay focused and follow the strategy without emotional interference. Be a pro.
MyCryptoParadise
iFeel the success🌴
