Eth - These chart patterns are repeating over & over If we learn to identify common patterns we will note that they are occuring over and over...on every asset (that has a chart)...on every timeframe. When in doubt, zoom out.
I can help you see the matrix.
D-ETH
ETHEREUM highest monthly CANDLEEthereum aims to close its highest monthly candle above $4,635, strongly bullish.

Bearish reversal off 50% Fibonacci resistance?Ethereum (ETH/USD) is reacting off the pivot which is a pullback resistance that aligns with the 50% Fibonacci retracement and could drop to the swing low support.
Pivot: 4,644.35
1st Support: 4,106.00
1st Resistance: 4,948.64
Risk Warning:
Trading Forex and CFDs carries a high level of risk to your capital and you should only trade with money you can afford to lose. Trading Forex and CFDs may not be suitable for all investors, so please ensure that you fully understand the risks involved and seek independent advice if necessary.
Disclaimer:
The above opinions given constitute general market commentary, and do not constitute the opinion or advice of IC Markets or any form of personal or investment advice.
Any opinions, news, research, analyses, prices, other information, or links to third-party sites contained on this website are provided on an "as-is" basis, are intended only to be informative, is not an advice nor a recommendation, nor research, or a record of our trading prices, or an offer of, or solicitation for a transaction in any financial instrument and thus should not be treated as such. The information provided does not involve any specific investment objectives, financial situation and needs of any specific person who may receive it. Please be aware, that past performance is not a reliable indicator of future performance and/or results. Past Performance or Forward-looking scenarios based upon the reasonable beliefs of the third-party provider are not a guarantee of future performance. Actual results may differ materially from those anticipated in forward-looking or past performance statements. IC Markets makes no representation or warranty and assumes no liability as to the accuracy or completeness of the information provided, nor any loss arising from any investment based on a recommendation, forecast or any information supplied by any third-party.

Ethereum · Crash or Higher?I see Ethereum and I look at Ethereum and all I see is rising prices. I can see the potential for a retrace and the bearish signals short-term but still, all I see is rising prices and a rising trend, it will continue.
Here we have a very strong rising trend and it seems Ether is peaking. There was a high 10 days ago and now we are seeing a double-top. Yesterday was a new all-time high and the candle ended with a small real body and large upper wick. This can be read as bearish but also as resistance being challenged.
Trading volume is standard for a continuation. All general signals are bullish. The trend is bullish. The market tendencies are bullish. The sentiment is bullish, etc.
Between May and July we had a period of sideways action, two months. Something similar can happen but instead of two months, two weeks or four weeks. I believe this one will be shorter than the last.
Prices can drop just to recover the next day. Prices can continue rising without a drop. It is hard to predict the very short-term.
Ethereum is bullish on all timeframes and no signals point to a top being present.
The day with high bearish volume 14-August was matched by a day of high bullish volume 22-August. So the market remains positive on the upside. The market bias continues bullish.
Ethereum is bullish long-term, and we expect to continue rising as long as the action is happening above $4,100. If it moves below, we will rethink.
Thank you for reading.
Namaste.

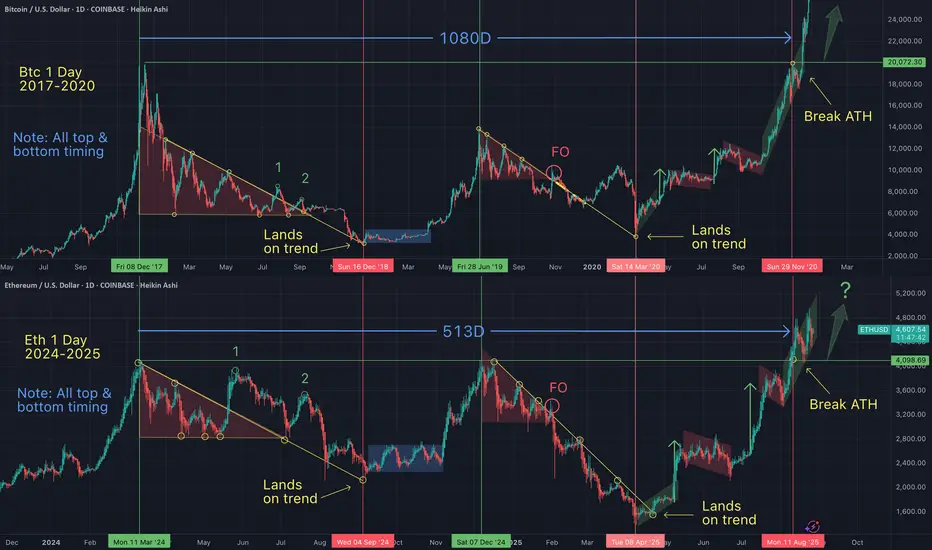
Zoom out Ethereum $ETHEthereum seems to be repeating the process that started the 2016-2017 mega run.

ETH Long Setup 4000$ was a resistance and its now support so he come 1 time back we hit ATH and now we come back for the final Move much conflunce Trendline FiB engulf lets go

Ethereum above the $4400 ┆ HolderStatBINANCE:ETHUSDT on the 1D chart is consolidating after a steep rally from triangle breakouts. Price action is hovering above $4,440, with potential to briefly dip below $4,500 before recovering higher. As long as $4,400 holds as support, the broader bullish channel targets remain at $5,000–5,200.

ETH 4H Analysis – Key Triggers Ahead | Day 3💀 Hey , how's it going ? Come over here — Satoshi got something for you !
⏰ We’re analyzing ETH on the 4-hour timeframe timeframe .
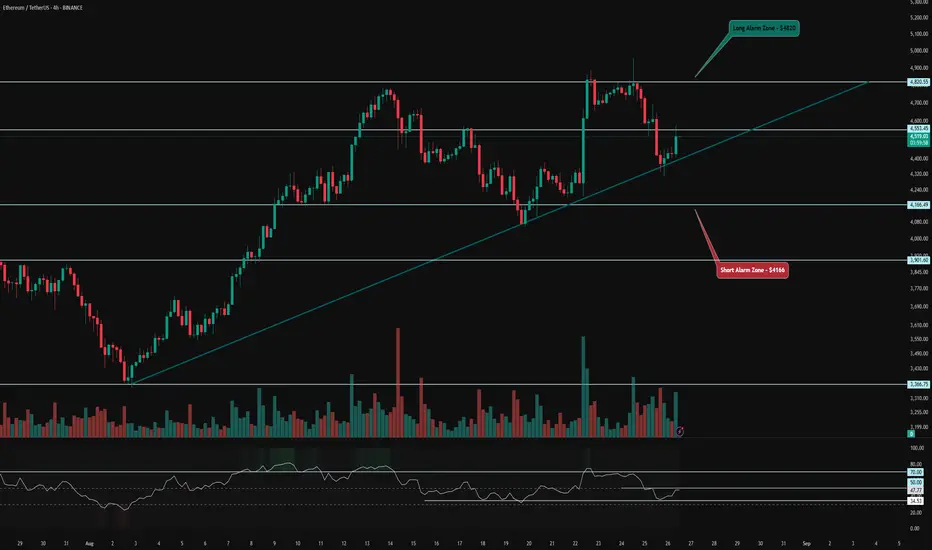
👀 We’re observing the 4-hour Ethereum chart, and ETH is trading within a 4-hour box. The ceiling of this box is at the $4,820 level, and the floor is at $4,166. The floor was once faked out, showing a reaction toward the ceiling but got rejected from this area. Buyer makers have kept the price near the midline of the box. A trendline has been drawn from the box’s lower level, and each time ETH hits this trendline, it has shown an upward reversal. Breaking and holding above the midline of the box could push ETH toward the ceiling, with the midline acting as an early trigger .
⚙️ Key RSI levels are at 50 and 70. With increased volatility, long trades on Ethereum could drive it upward, and crossing the 50 level could push ETH’s price into the upper part of the box, giving it another chance to test breaking the 70 level and setting a new high. If rejected and this scenario fails, ETH could experience a deep correction, as it hasn’t entered oversold territory or seen a deep correction for several days .
🕯 The size and volume of green candles have increased compared to red candles, which prevents a deep correction in ETH. However, yesterday in ETFs, people bought a significant amount of Ethereum, and this weakness in the corrective trend suggests that ETH has a stronger tendency to rise and climb .
🪙 We’re observing the 4-hour ETH/BTC index chart, and ETH has a strong support level against Bitcoin at 0.03972, where increased volume triggered a reversal. There’s also a resistance level at 0.04275, and breaking this level with increased volume and RSI entering overbought territory could confirm a long trade for ETH .
🔔 Our trading alarm zones for ETH positions are at $4,820, where breaking this level could signal a long position. An early trigger for a long trade could be at $4,553, where breaking this level increases the likelihood of breaking the ceiling of the 4-hour box. The short trade alarm zone is at $4,166, where breaking this level could initiate a deep correction for ETH .
❤️ Disclaimer : This analysis is purely based on my personal opinion and I only trade if the stated triggers are activated .
ETHUSDT ETHEthereum has shown bullish strength in recent weeks and has formed several positive patterns. I believe it will target the $8,500 level after breaking the top at $4,900.

HYPE Swing Long IdeaHYPE Swing Long Idea
📊 Market Sentiment
Overall sentiment remains bullish, supported by expectations of a 0.25% rate cut in the upcoming FOMC meeting. A weakening USD and increasing global risk appetite are creating favorable conditions for further upside in crypto assets.
📈 Technical Analysis
HYPE is showing relative strength compared to other crypto assets.
Price bounced from the bullish trendline, forming a 4H demand zone.
It tapped into this 4H demand zone again and found support, confirming buyers’ interest.
📌 Game Plan
I will be watching for a return to the 4H demand zone and a run of the first tap at $42.4 to initiate a potential all-time high move.
I will also be looking for either a tap or deviation from the bullish trendline, followed by a close back above it.
🎯 Setup Trigger
I will be waiting for a 4H–1H market structure shift before entering the trade.
📋 Trade Management
Stoploss: 4H–1H swing low confirming the BOS
Targets:
TP1: $47.4 – Internal High
TP2: $49.8 – All-Time High
💬 Like, follow, and comment if you find this setup valuable!
⚠️ Disclaimer: This content is for informational and educational purposes only and does not constitute financial, investment, or trading advice. Always do your own research before making any financial decisions.

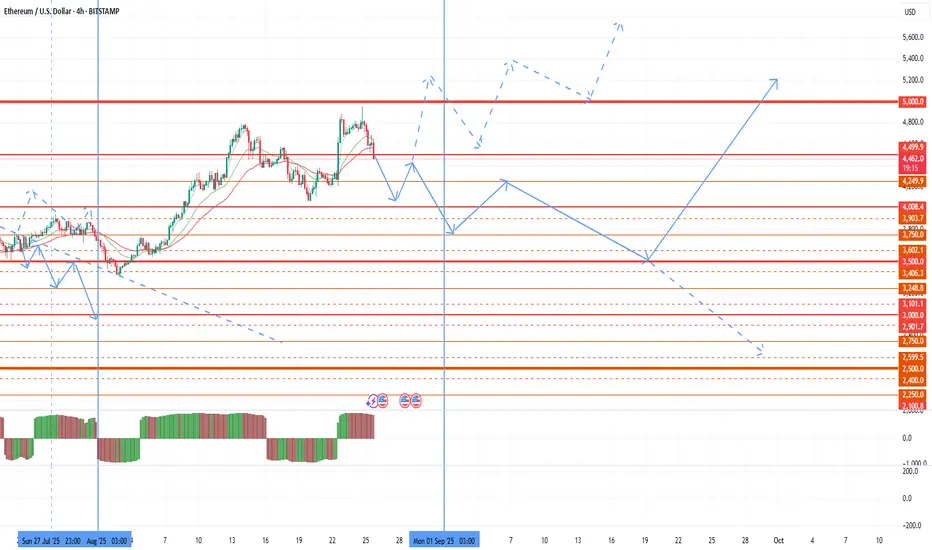
Ethereum New Analaysis (4H)Now, Ethereum may face a serious correction after making one more high. So pay close attention to the $4900–$5000 zone.
For this bearish scenario to play out, the SWAP zone on the 12H or daily timeframe must be broken and price must hold below it.
A daily candle closing above the invalidation level would nullify this analysis.
For risk management, please don't forget stop loss and capital management
When we reach the first target, save some profit and then change the stop to entry
Comment if you have any questions
Thank You


AUSDT bulish This AUSDT currency has reached the oversold area and should experience a growth of at least 8%. In this strategy, I buy spot and wait for the target. The win rate of this strategy is above 80%. If the next stage drops further, I will enter with 2 times the volume, which happens in one out of every 8 transactions. Capital management is the main pillar of trading.

Attention, seasonal sales!Today we have moved on to the seasonal sales period, and I want to review the market situation once again. As I wrote in my last review, in order to continue active trading, I am waiting for another delisting and assignment of the monitoring tag, after which we can identify more reliable and attractive tools for speculators. However, this year binance continues to make the footsteps. After ether's growth was too fast to form a trend, a significant pullback was prevented in July. This prevents further purchases and consolidation above 5k. At the same time, there was no delisting and assignment of the monitoring tag, which preserves the threat of drawdown for altcoins and reduces the activity of buyers. As a result, the seasonal August purchases were repaid.
The next seasonal wave of market growth is from the end of September to the beginning of November. In the next three weeks, it is worth preparing for a bear attack and, hopefully, another assignment of the monitoring tag, after which it will be possible to identify altcoins that are safe for operation.
Before the closing of the current monthly candle, there is still a possibility of the last bull attack in the second half of the week with a possible 5k takeover, however, only with a clear signal, which may be negative data on US GDP or a sharp rise in brent oil above $ 70 followed by a breakout of the last monthly candle for EUR/USD. But for now, for 3-4 weeks, the probability of a retest of 3500 on ether prevails at least, followed by a resumption of growth from the end of September if the bulls hold 3500.
As expected, fan tokens have shown themselves to be the most interesting and confident in such a market picture due to strong oversold conditions, but today I have also finished work with them before the likely seasonal decline.
BNB tuched its TPThe first position reached its target with reward 2
Please go and see the previous analysis.
I am waiting for a new high to be recorded

Ethereum Breaks $4K — Eyes on $5K and BeyondEthereum has been the top-performing asset since the April 7 low, breaking through resistance and solidifying its position as the backbone of the stablecoin ecosystem. The trend remains firmly bullish as long as ETH continues its pattern of higher highs and higher lows.
The breakout above the $4,000–$4,200 zone turned former resistance into new support, giving bulls the upper hand. Momentum now shifts toward retesting the former all-time high region at $4,800–$5,000, with upside potential extending into the next cycle.
📈 Technical Highlights:
✅ Short-term resistance: $4,800–$5,000 (former ATH)
✅ Medium-term target: $7,000 baseline
✅ Extended objective: $8,000 possible
🛡️ Key support: $4,000–$4,200 (new floor)
📣 Takeaway:
Ethereum’s structure remains a textbook bullish setup. As long as it holds above $4,000, the path favors further upside. Breakouts above $5,000 could fuel the next leg higher, while current levels may offer strong opportunities for trend-followers and long-term investors.
#Ethereum #ETH #Crypto #Trading #TechnicalAnalysis #EthereumPrice #Bullish #CryptoTrading #Altcoins #Breakout

Did Eth just bottom? My Eth take profit targets.Did Eth just bottom. My guess is that was a local bottom. But I wouldn't be surpresed if Eth gets a lower low. I hope I wrong, but if we do get another lower low, that would be an ideal entry point for me.
May the trends be with you!

SPX 6900 looking weak , big drop coming?SPX has been a monster for most of 2025 but now showing signs of weakness , weekly lower high trend was the first warning.
Now formed massive rising wedge would be careful with this for now wait until its under one dollar to pick up some more.
This trendline is very important , see how the monthly closes on this one.

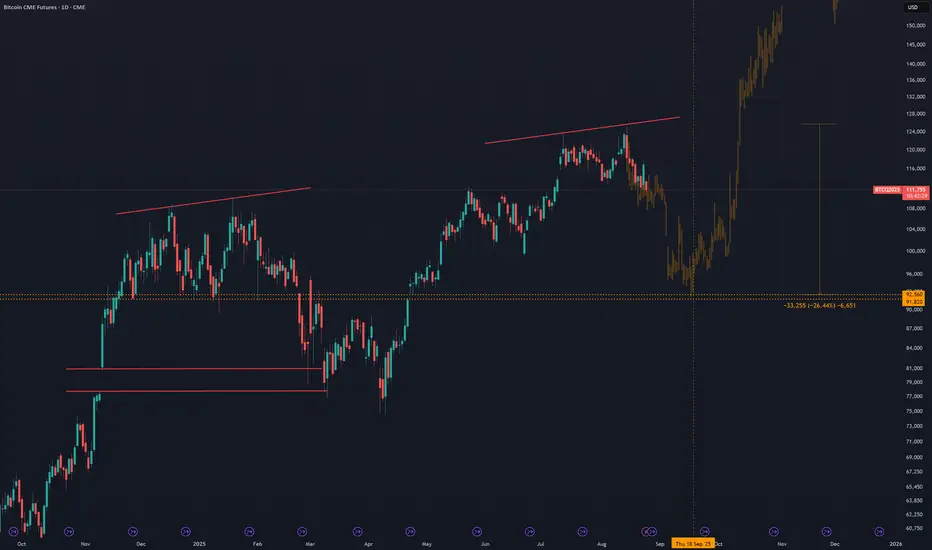
Distribution Pattern Signals Crash Into CME Gap at 92kIt is always the same playbook at this point and it is getting boring to watch. The same double top distribution pattern repeats again and again. This is the game they play, wiping out both shorts and longs before the real rally begins.
The last time we saw this setup Bitcoin pulled back 32 percent into the CME gap at 77k. The next gap sits at 92k and you can bet they will dump it down there too. In reality it is not even that big of a move, just 26 percent, perfectly in line with previous pullbacks.
The real story is the fear it will create. This lines up with September, historically Bitcoin’s worst performing month and a time when blood usually runs in the streets.
DO NOT FALL FOR THIS BEAR TRAP AND SHAKE OUT
ETH 1H Analysis – Key Triggers Ahead | Day 2💀 Hey , how's it going ? Come over here — Satoshi got something for you !
⏰ We’re analyzing BTC on the 4-hour timeframe timeframe .
👀 On the 1-hour Ethereum chart, after last night’s rally, ETH hit a new all-time high but was rejected and is now moving downward while maintaining its uptrend.
⚙️ Key RSI levels are 50 and 30. Breaking these levels with high volatility could trigger ETH’s next move in either direction.
🎮 Fibonacci drawn from the Jackson Hole event to ETH’s all-time high shows the 0.61 level as a key zone. Losing this could lead to a deeper correction. The 0 Fib level at $4,852 acts as a breakout zone for long trades.
🕯 Red candles are relatively large, but ETH’s pullback is milder than Bitcoin’s. It’s currently at a decision-making zone with a new structure forming.
🪙 ETHBTC pair shows whales are undecided after last night’s drop. The alarm zone for the ETH/BTC pair is at 0.04218; a break above could spark a new bullish leg for ETH.
🔔 ETH’s alarm zone for longs is at $4,852.52. A breakout here with increased volatility and volume could push ETH to higher highs.
❤️ Disclaimer : This analysis is purely based on my personal opinion and I only trade if the stated triggers are activated .

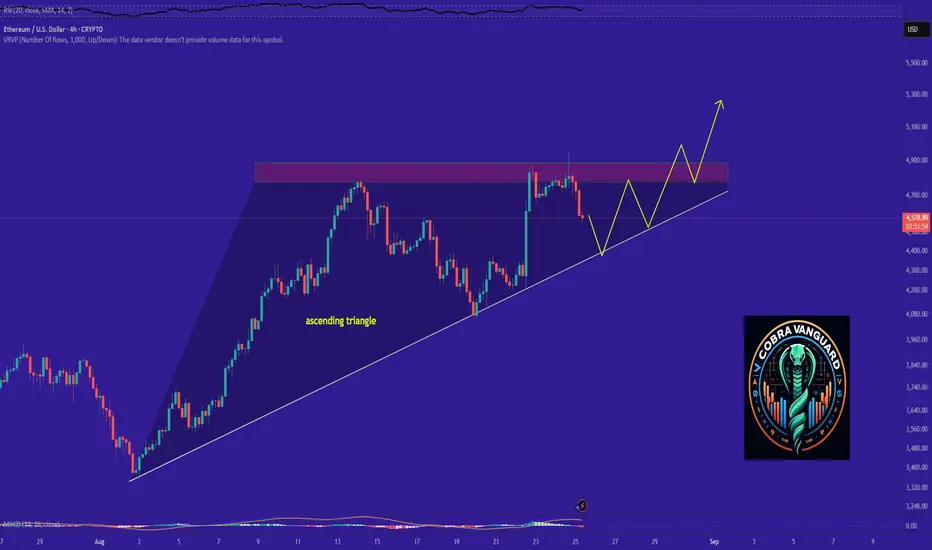
ETH is bullish now and many Traders don't see it !!The price on the 4h timeframe is within an ascending triangle, which can be promising. If the price breaks this pattern with bullish candles, it could easily rise by the distance of AB=CD .
Best regards CobraVanguard.💚
ETHEREUM HIGHEST CLOSEDOn weekly timeframe, Ethereum closed its highest candle ever and is testing that $4,627 as support. This could be a bullish sign for Ethereum, with RSI showing room for growth.

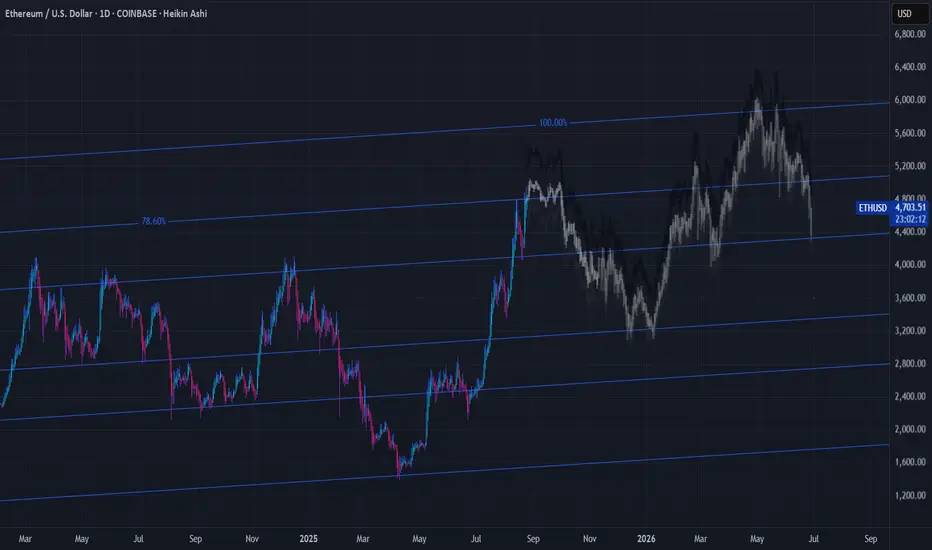
▒𖢻▒ ETHEREUM FORECAST | 1D ▒𖢻▒COINBASE:ETHUSD
My ETH Forecast on the Daily. Long-Term I believe ETH will see a 35% drop before a 100% gain.
The first part of this forecast is shown here.
This can always change, this is my initial forecast from watching price action for thousands of hours. The Fibonacci Sequence supports these fractal forecasts and as well as the trading patterns throughout the history of Ethereum.
I am a Bitcoin Maximalist so I am not trading ETH, however if I was I'd be taking large profits and/or trading out of all of my positions at this current level ($5,000 - $4,600) and reposition back in around these valley levels ($3,300 - $3,000).
DISCLAIMER
I AM NOT A FINACIAL ADVISOR, NOR AM I YOURS. THIS IS NOT FINANCIAL ADVICE. MEARLY DOODLINGS ON A MATHMATICALLY DRIVEN GRAPHICAL INTERFACE, TRACKING AN INVISIBLE 256BIT MILITARY-GRADE ENCRYPTED ASSET. . . FOR ENTERTAINMENT/AMUSEMENT PUROSES ONLY. ENJOY!