BB + RSI: Ultimate Mean Reversion
BB + RSI: Ultimate Mean Reversion 🍊
🍊 Summary
Most traders use Bollinger Bands or RSI in isolation, but they often lead to "false breakouts" or "riding the bands." This idea breaks down the power of **Confluence**—where mathematical extremes meet market exhaustion—using the **OrangePulse LITE** framework.
---
📊 Visual Breakdown (Analyzing the Screenshot)
1. The Entry: Pure Confluence
Look at the most recent trade on the right side of the chart:
* **Bollinger Bands:** Price pierces the lower band, indicating a statistical deviation from the mean.
* **RSI:** Simultaneously, the RSI drops below 30, confirming that the asset is mathematically oversold.
* **The Result:** This "Sweet Spot" is where the probability of a relief bounce is highest.
2. The "Step-down" Effect (DCA in Action)
Notice the **Yellow line (Average Price)** and **Green line (Take Profit)**:
* Every time a **Safety Order (SO)** is filled (indicated by the small blue arrows), these lines instantly drop.
* **Why this matters:** You don't need the price to return to your original entry to profit. The bot automatically "brings the target to the price."
* In this 1h BTC chart, you can see how the target was brought down significantly, allowing for a much faster exit on the first sign of recovery.
3. Precision & Discipline
Automated trading isn't about "winning every trade" instantly. It's about having a plan for when the market moves against you.
* **Patience:** The bot waits for the exact moment both conditions align.
* **Execution:** No emotions, no hesitation. Just math.
---
⚙️ How to Use This
This exact logic—the confluence triggers, the automated DCA lines, and the real-time status table—is the core engine of the **OrangePulse v3.0 LITE** script.
It's designed to be a reliable "Mean Reversion" tool for traders who want to automate their discipline without complex setups.
DCA

DCA Target Drag: Why You Don't Need a Full Recovery
One of the biggest misconceptions in trading is that if you buy an asset at $100 and it drops to $80, you need it to go back to $100 to break even. In a DCA (Dollar Cost Averaging) system, every Safety Order (SO) 'drags' your Take Profit (TP) target closer to the current price.
Using the OrangePulse LITE visual framework, we can see exactly how this works. By adding volume at lower levels, your average price drops significantly. The bot automatically recalculates the new TP line based on the updated average. This means a minor 5% relief bounce can exit a trade that is currently 15% in drawdown.
Conclusion: Success in DCA isn't about picking the bottom; it's about the speed of the target adjustment. Math > Predictions.

The "Inverted" DCA: How to Profit from Overextended Pumps
Dollar Cost Averaging (DCA) is usually associated with "buying the dip." But in a professional trading environment, the same mathematical principles can be applied to Shorting overextended rallies.
Today we are looking at how to use OrangePulse Lite to capture "Mean Reversion" moves to the downside.
1. Identifying the "Exhaustion" Instead of just shorting blindly, we look for Confluence:
Price is above the Upper Bollinger Band (statistically overextended).
RSI is in the Overbought zone (>70). This suggests the "pump" is losing steam and a return to the mean (average price) is likely.
2. Building the Short Position Shorting a strong rally is dangerous because of "short squeezes." This is where DCA shines:
We enter a small Base Order (BO) at the first sign of weakness.
If the price continues to push higher, we add to our position via Safety Orders (SO).
This moves our "Short Average Price" higher, making it much easier to exit in profit on the first minor retracement.
3. Psychology of a Short DCA While most traders are "FOMO-ing" into the top, the DCA bot is mechanically building a position. The goal isn't to pick the exact top, but to create an average entry that is higher than the eventual "Mean Reversion" point.
4. Risk Management Shorting has theoretically unlimited risk, so Max Safety Orders and a clear Stop Loss are mandatory. The Lite script allows you to visualize exactly where your "danger zone" starts.
Conclusion: DCA is a tool for volatility management, not just for long-term investing. By applying it to the short side, you can stay profitable even when the macro trend is bearish.

Maximizing Bull Runs: Fixed TP vs. Trailing Take Profit
One of the hardest decisions in trading is knowing when to exit. If you exit too early with a fixed Take Profit (TP), you might miss out on a "moon" move. If you hold too long, the price might reverse and wipe out your gains.
Today, we are exploring the logic of Trailing Take Profit—a dynamic way to stay in the trend as long as possible.
1. The Concept of "Activation" A Trailing TP doesn't start immediately. In the OrangePulse Lite logic, we use a Trail Activation %.
The trade first needs to reach a certain "safety profit" level.
Once hit, the bot "arms" the trailing logic (visualized by the purple line on the chart).
2. The "Trailing Distance" Once armed, the bot looks at the Highest High (for Longs) reached during the trade. The exit trigger is set at a fixed percentage below that high point.
If the price continues to rise, the exit line (purple) follows it up.
The price is effectively given "room to breathe," but the profit is locked in if a reversal occurs.
3. Fixed TP vs. Trailing TP Look at the attached chart:
A Fixed TP would have closed the trade at the green line, missing the final leg of the rally.
The Trailing TP (purple) stayed active during the entire push, closing the trade only when the momentum actually stalled and the price dropped by the trailing distance.
4. The Trade-off
Fixed TP: Higher reliability and faster capital turnover. Great for sideways markets.
Trailing TP: Captures the "meat" of a trend. Essential for parabolic moves.
Educational takeaway: Don’t be afraid to let your winners run, but always have a mechanical way to lock in those gains. Using a trailing algorithm removes the "greed factor" and ensures you exit based on price action, not emotions.

The Math of Mean Reversion: How DCA Lowers Your Break-Even Durin
Trading against the trend or catching a "falling knife" is often considered risky. However, when combined with mechanical Mean Reversion logic and Dollar Cost Averaging (DCA), it becomes a powerful statistical approach.
In this educational study, we are looking at how a structured DCA ladder helps a trader survive volatility by dynamically lowering the average entry price.
1. The Concept of Mean Reversion Prices don't move in a straight line. After an overextended move (to the upside or downside), the price tends to return to its "mean" or average. The goal of this strategy is to accumulate a position during the extension and exit as soon as the price starts its trek back to the average.
2. The Logic of Safety Orders (SO) Using the OrangePulse Lite opens-source framework, we can visualize how a position is built:
Base Order (BO): The initial entry based on a signal (e.g., oversold conditions).
Safety Orders (SO): Pre-placed limit orders at specific percentage deviations below the entry.
3. Why the "Break-Even" Moves The most important lesson in DCA trading is the Average Price. Look at the attached chart:
When the first SO is hit, the average price of the entire position drops significantly.
As a result, the Take Profit (TP) line moves closer to the current price.
This means you don't need the price to return to your original entry to exit in profit; you only need a small "relief bounce" to close the entire position.
4. Risk Management (The "DCA Trap") Education wouldn't be complete without mentioning the risks. The danger of DCA is a "black swan" event where the price never bounces.
Max Safety Orders: Always have a limit.
Volume Scale: If you double your size on every step (Martingale style), you run out of capital very quickly. A conservative multiplier (e.g., 1.4x - 1.6x) is often more sustainable.
Conclusion: DCA is not about "hoping" the price goes back up. It is a mathematical way to improve your probability of exit by adjusting your entry price during volatility.
Study this on your charts using the OrangePulse Lite script to see how the ladder handles historical dips.

SEI: Is the Bottom In? Accumulating the World’s First Functional¿How are you? I have started a position in $SEI. After a deep dive into the current technical structure and the massive fundamental upgrades scheduled for 2026, I believe we are looking at a high-asymmetry opportunity. Here is the breakdown of my thesis.
Technical Analysis: The "90% Discount" Play
→ Deep Retracement: SEI is currently trading roughly 90% below its All-Time High (ATH). Historically, for a Layer 1 with active development, this is often the "maximum pain" zone where long-term accumulation happens.
→ Floor Found: While the price remains within a macro bearish channel and below the weekly 200 EMA, it appears to have established a solid horizontal floor at $0.1095.
→ Risk/Reward: Entering at these levels allows for a tight stop-loss below the recent lows, offering a very attractive R/R ratio if we see a mean reversion toward the 200 EMA.
Fundamentals: Growth & The "Giga" Upgrade
→ Massive Adoption: Network activity is decoupling from price. Active addresses grew by +93% in Q3 2025, reaching over 1.3 million daily active users in early 2026. The ecosystem is growing, not shrinking
→ Parallel EVM Pioneer: Sei v2 is the first functional Parallel EVM. It allows Ethereum developers to deploy Solidity/Vyper contracts with zero code changes while benefiting from parallel execution.
The 2026 Roadmap (The "Giga" Upgrade):
→ 200k TPS Target: The upcoming Giga upgrade (Q1 2026) aims for 200,000 transactions per second.
→ Tech Stack: Implementation of state compression and the "Autobahn" consensus mechanism to achieve sub-400ms finality.
Conclusion:
SEI is currently a high-conviction speculative play. We are betting on the successful execution of the Giga upgrade and the transition to a "pure EVM" architecture. If the team delivers on the 200k TPS milestone, SEI could easily become the go-to infrastructure for high-frequency DeFi and gaming.

Tron: Why start DCA? Technical and Fundamental AnalysisHello, everyone.
I have decided to start a DCA strategy on Tron.
My thesis is based on a strong convergence between the exhaustion of the short-term downtrend and undisputed fundamental dominance in the stablecoin sector.
1. Technical Analysis: Momentum Awakening
MACD (Weekly): I note that the histogram is losing strength in negative territory. The MACD line is preparing to cross above the Signal Line (the yellow line). Historically, this crossover in longer time frames usually marks the beginning of a prolonged uptrend.
RSI and Stochastic: Both indicators are in areas close to oversold. This indicates to me that the price has been punished enough and the chances of a technical rebound are high.
Price Action: CRYPTOCAP:TRX continues to accurately follow an uptrend channel that has been in place since August 2024. As long as the price remains within this channel, the structure of rising lows remains intact.
2. Fundamental Analysis: The King of Stablecoins
USDT Dominance: We cannot ignore that almost 40% of USDT transactions occur on the Tron network. In a year where the main narrative is the mass adoption of stablecoins, being positioned in the infrastructure that moves those digital dollars is a strategic move.
Institutional Narrative and IPO: Rumors and movements surrounding Tron's initial public offering (IPO) generate enormous institutional validation. This will facilitate traditional capital entering the ecosystem, increasing liquidity and demand for the token.
Strength of the Dollar: Tron has become the “bridge” for the U.S. dollar to maintain its global relevance through digitization, aligning with the narrative of strengthening the financial system through blockchain technology.
Execution Strategy:
I am not looking to go all in at a single price. My plan is to make dollar-cost averaging (DCA) purchases, taking advantage of the lower end of the current bullish channel and seeking medium- and long-term targets as the payment ecosystem continues to grow.

Leverage Is a Tool — Learn Risk, DCA & Capital EfficiencyIn trading, most failures don’t come from bad entries — they come from bad risk.
This post is a lesson in structured risk management , showing you how to use:
- Leverage as a tool for capital efficiency — not destruction
- DCA (Dollar-Cost Averaging) as a strategic method of entry
- Portfolio risk limits to define, control, and survive uncertainty
If you struggle with:
- Overexposure
- Emotional compounding
- Liquidation from small pullbacks
- No clear entry/exit framework...
… this lesson is for you.
🔐 Risk Management: The Non-Negotiable
Rule #1: Define how much you are willing to lose before entering a trade.
This is called your risk per trade , usually between 1–2% of your portfolio.
At 10%, you're being aggressive — and must have a plan to manage that exposure.
We don't control the outcome — we control the input:
- Entry
- Stop
- Size
- Risk
When you control those, drawdowns are survivable, and probability can do its job.
⚖️ Leverage: Use It Intelligently
Leverage is a tool , not a strategy.
Use it to reduce the amount of margin locked in a trade, not to increase your risk.
With defined stops and limited exposure, leverage lets you:
- Keep cash free for other trades
- Scale into high-conviction zones
- Stay efficient in the market
But uncapped leverage + undefined risk = guaranteed blowup over time.
📊 DCA: A Smarter Way to Scale
DCA (Dollar-Cost Averaging) isn't just for passive investing — it's powerful in trading too.
When the market moves into a reversal zone (support/resistance, divergence, order block, etc.), we don’t guess one perfect entry. Instead:
- Set an anchor entry
- Add 2–4 additional levels deeper into the zone
- Size each entry with increasing conviction (e.g. 1x, 2x, 4x)
This gives you a better average entry , avoids full fills on weak moves, and reduces emotional overreaction to early red positions.
📈 Best Practices (Save These)
✅ Always define risk in % of portfolio
✅ Use 1–3% risk max per trade unless fully planned
✅ Use higher timeframes (1D, 4H) for cleaner levels
✅ Pair DCA with reversal indicators — don’t DCA blindly
✅ Set SL below/above zone based on structure or ATR
✅ Only use leverage when risk is defined — never without a stop
✅ Never DCA into a loser without a stop — this isn't martingale
🛠️ Apply the Lesson — with the DCA Ladder + Risk Calculator
To make this practical, I’ve published a free tool here on TradingView:
👉 DCA Ladder Calculator by @RWCS_LTD
It lets you:
- Input portfolio value, risk %, and leverage
- See optimal entry prices and position sizes
- Understand stop loss placement
- Visualize how capital and risk are distributed
- Teach yourself capital-efficient execution
You can use it for both LONG and SHORT setups.
Pair this tool with your strategy, and your edge will stop bleeding from risk errors.
⚠️ Final Reminder
Risk is not something to react to — it’s something to define.
“It’s not about being right — it’s about not blowing up.”
🛡️ Disclaimer
This is not financial advice.
All content is for educational purposes only.
Trading with leverage involves risk of loss.
Always do your own research and consult a licensed financial advisor before acting on any ideas or tools.

ETH DCA Opportunities: Targeting the $2,900 Zone and FibonacciEthereum Breakdown: Fibonacci Retracements and Strategy-Validated Supports
Let's dive into Ethereum ( BINANCE:ETHUSD ).
Ethereum is approaching an interesting zone established from March to May last year, confirmed by both my indicators around $2,900 USD. Currently, it's nearing that same level, which converges with the range from our recent low at $1,300 to the high from a few weeks ago hitting the 0.618 Fibonacci retracement.
This positions the current zone as a prime area to initiate DCA entries for a better average price. If the price doesn't hold and breaks through, the next strategy-confirmed zones would be around $2,400 USD, followed by another at $1,600.
My approach uses custom indicators like Trend Force (TF) and Smart Money (SM) for these validations confluences between them provide the strongest signals, but single indicator confirmations can also be reliable.
Since my indicators are private and not visible here on TradingView, head over to my Substack for the full chart, including a longer timeframe view of previous signals and zones based on the strategy. There, you can also find my detailed strategy explanation to interpret the traffic signals easily.
Remember, I'm not a financial advisor, and this isn't investment advice—always do your own research. I'm just sharing my analyses derived from proprietary tools. If you'd like me to review a specific asset, let me know in the comments.

$MAGS: Magnificent Seven ETF – Tech Titan or Overhyped?(1/9)
Good afternoon, everyone! ☀️ CBOE:MAGS : Magnificent Seven ETF – Tech Titan or Overhyped?
With MAGS at $46.85, is this ETF a powerhouse of tech giants or just another bubble waiting to burst? Let’s decode the code! 🔍
(2/9) – PRICE PERFORMANCE 📊
• Current Price: $ 46.85 as of Mar 18, 2025 💰
• Recent Move: Likely up, reflecting tech sector strength, per data 📏
• Sector Trend: Tech stocks soaring with AI and cloud hype 🌟
It’s a tech fest—let’s see if it’s worth the buzz! ⚙️
(3/9) – MARKET POSITION 📈
• Market Cap: Approx $1.87B (assuming 40M shares) 🏆
• Operations: Tracks Apple, Microsoft, Amazon, Alphabet, Meta, Tesla, Nvidia ⏰
• Trend: Dominant players in tech, driving innovation and market trends 🎯
Firm in the heart of Silicon Valley! 🚀
(4/9) – KEY DEVELOPMENTS 🔑
• Tech Rally: Magnificent Seven companies hit new highs, per data 🌍
• Earnings Season: Strong Q4 results from underlying firms, per posts on X 📋
• Market Reaction: MAGS up, reflecting sector momentum 💡
Navigating through tech’s highs and lows! 🛢️
(5/9) – RISKS IN FOCUS ⚡
• Regulatory Scrutiny: Antitrust concerns for big tech players 🔍
• Market Volatility: Tech stocks prone to swings due to innovation and competition 📉
• Economic Factors: Interest rates and global economic conditions impact growth ❄️
It’s a risky ride—buckle up! 🛑
(6/9) – SWOT: STRENGTHS 💪
• Industry Leaders: The Magnificent Seven are pioneers in their fields 🥇
• Growth Potential: AI, cloud computing, and other tech trends fuel expansion 📊
• Dividend Payouts: Some companies offer dividends, adding income potential 🔧
Got the best of both worlds! 🏦
(7/9) – SWOT: WEAKNESSES & OPPORTUNITIES ⚖️
• Weaknesses: High valuations, potential for overinvestment 📉
• Opportunities: Emerging technologies like quantum computing, biotech integration, per strategy 📈
Can they stay ahead of the curve? 🤔
(8/9) – POLL TIME! 📢
MAGS at $46.85—your take? 🗳️
• Bullish: $50+ soon, tech’s unstoppable 🐂
• Neutral: Steady, risks balance gains ⚖️
• Bearish: $40 looms, overhyped and due for correction 🐻
Chime in below! 👇
(9/9) – FINAL TAKEAWAY 🎯
MAGS’s $46.85 price reflects the dynamism of the tech sector 📈, but with risks from valuations and regulatory pressures 🌿. DCA-on-dips could be a strategy to manage volatility. Gem or bust?

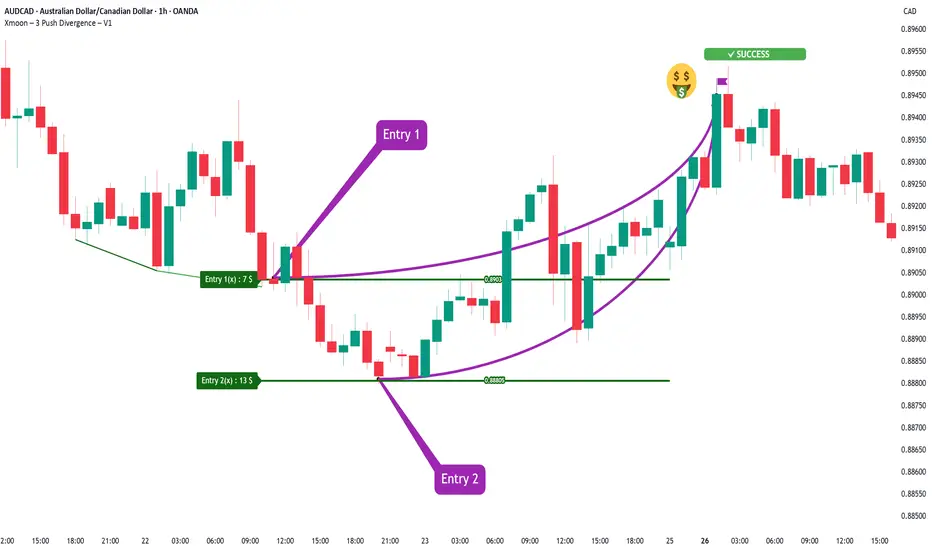
Xmoon Indicator Tutorial – Part 3 – Step Entry (DCA Entry)📘 Xmoon Indicator Tutorial – Part 3
🎯 Step Entry (DCA Entry)
Step-by-step entry, also known as DCA (Dollar Cost Averaging), is one of the key parts of the Xmoon – 3 Push Divergence strategy.
🔹 Why is it important?
After a 3 Push Divergence pattern appears, the market usually doesn’t reverse immediately.
It often moves a bit further in the same direction before turning back.
If we put all our capital in at once, the risk of liquidation increases.
🔹 The solution
We split the capital into several parts and enter the market step by step:
✦ If the market doesn’t reverse from Entry 1 , the chance of reversal at Entry 2 is higher
✦ If it doesn’t reverse from Entry 2, the chance at Entry 3 increases even more
✦ And so on — with each new step, the probability of reversal grows
Benefits of step entries:
✅ Lower overall risk
✅ Higher win rate
✅ Positions reach the Risk Free point faster
📣 If you have any questions or need guidance, feel free to ask us. We’d be happy to help.
Bittensor (TAO): Undervalued AI Crypto Gem Amid #Crypto Revival?Bittensor (TAO): Undervalued AI Crypto Gem Amid #Crypto Revival? $600+ in Sight? 📈
At $316.43 (+1.5%), TAO's market cap of $3.03B undervalues its DeAI ecosystem, with FDV at $6.62B hinting at growth—could #AI and #Crypto trends push it toward Bitcoin-like status? 🚀
**Fundamental Analysis**
With circulating supply of 9.6M and total 21M, TAO powers decentralized AI compute; undervalued per community sentiment, positives include modular AI infrastructure, though early-stage risks persist.
- **Positive:** Strong ecosystem partnerships (e.g., Google Cloud); bullish community sentiment.
- **Negative:** High volatility typical of altcoins; limited mainstream adoption yet.
**SWOT Analysis**
**Strengths:** Pioneering AI-blockchain fusion; capped supply scarcity.
**Weaknesses:** Dependency on AI hype; technical complexity.
**Opportunities:** Expanding DeAI use cases; listings on major exchanges.
**Threats:** Regulatory scrutiny on crypto; competition from centralized AI.
**Technical Analysis**
Chart exhibits strong uptrend with recent 7.2% weekly gain. Price: $316.43, VWAP N/A for crypto.
Key indicators:
- RSI: 60 (bullish, not overextended).
- MACD: Positive, confirming upward momentum.
- Moving Averages: 50-day at $300 (support hold), 200-day at $250 (long bull trend).
Support/Resistance: Support at $310, resistance at $320. Patterns/Momentum: Breakout from consolidation, momentum favoring bulls. 📈 Bullish | ⚠️ Bearish.
**Scenarios and Risk Management**
- **Bullish:** Surge above $320, DCA in for scaled entry amid #AI buzz.
- **Bearish:** Retreat to $310 on market dips, trim holdings.
- **Neutral:** Hover around current levels pending news.
Risk Tips: Stops at 10% drawdown, risk no more than 1% portfolio, diversify crypto holdings, DCA to average volatility. ⚠️
**Conclusion/Outlook**
Bullish if #Crypto and #AI converge. Watch exchange listings. Fits innovative theme with upside. Take? Comment!

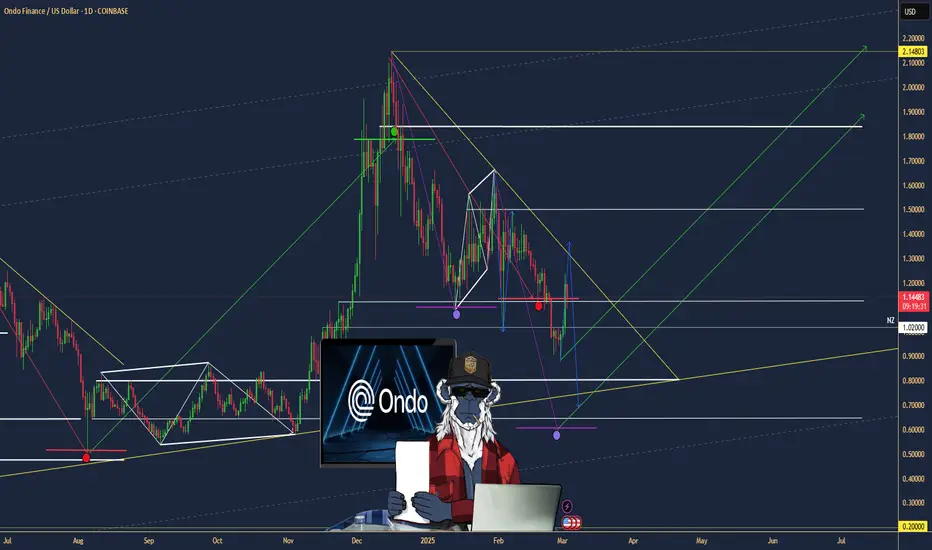
$ONDO: Ondo Finance – Tokenizing the Future or Facing Roadblocks
(1/9)
Good morning, champs! ☀️ LSE:ONDO : Ondo Finance – Tokenizing the Future or Facing RWA Roadblocks?
Ondo Finance just joined Mastercard’s Multi-Token Network, aiming to tokenize U.S. Treasuries! But with market volatility, is this RWA gem a buy or a wait? Let’s dive in! 🔍
(2/9) – PRICE PERFORMANCE 📊
• Recent Trend: Transaction volume spiked to 400M in Jan 2025, now ~300M 💰
• Market Insight: Up 1.6% recently (Daily Hodl, Feb 2025) 📏
• Sector: RWA tokenization surging with TradFi interest 🌟
It’s buzzing in the DeFi space! ⚙️
(3/9) – MARKET POSITION 📈
• Market Cap: Not specified; holds 40% of tokenized securities market 🏆
• Holdings: U.S. Treasuries, bonds via USDY, OUSG tokens ⏰
• Trend: Whales hold 88% of tokens, per IntoTheBlock 🎯
Firm, leading RWA tokenization! 🚀
(4/9) – KEY DEVELOPMENTS 🔑
• Partnership: Joined Mastercard MTN as first RWA provider (Feb 26, 2025) 🔄
• Expansion: Teamed with World Liberty Financial for RWAs 🌍
• Market Reaction: Steady growth in transaction volume 📋
Adapting, bridging TradFi and DeFi! 💡
(5/9) – RISKS IN FOCUS ⚡
• Volatility: Crypto market swings could hit token value 🔍
• Regulation: Compliance hurdles in tokenized assets 📉
• Concentration: High whale ownership (88%) risks dumps ❄️
Tough, but risks loom! 🛑
(6/9) – SWOT: STRENGTHS 💪
• RWA Leader: 40% tokenized securities market share 🥇
• Big Backers: BlackRock, Coinbase Ventures support 📊
• Tech Edge: Tokenizing U.S. Treasuries for DeFi 🔧
Got fuel in the tank! 🏦
(7/9) – SWOT: WEAKNESSES & OPPORTUNITIES ⚖️
• Weaknesses: High whale concentration, market volatility 📉
• Opportunities: TradFi integration, DeFi yield growth 📈
Can it tokenize to the moon? 🤔
(8/9) – 📢Transaction volume at 300M, Mastercard partnership live, your take? 🗳️
• Bullish: $2 soon, TradFi loves it 🐂
• Neutral: Steady, risks balance ⚖️
• Bearish: $0.90 looms, whales dump 🐻
Chime in below! 👇
(9/9) – FINAL TAKEAWAY 🎯
SMCI’s transaction volume and TradFi ties scream potential 📈, but whale concentration adds caution 🌿. Volatility’s our buddy—dips are DCA gold 💰. Grab ‘em low, climb like pros! Gem or bust?
TSMC: AI Chip Titan – Still the King or Facing New Challengers?Good morning, everyone! ☀️ TSMC: AI Chip Titan – Still the King or Facing New Challengers?
(1/9)
TSMC’s riding the AI wave with record Q4 2024 profits, but with U.S.-China curbs and fab delays, is this semiconductor king untouchable or at a crossroads? Let’s unpack it! 🔍
(2/9) – PRICE PERFORMANCE 📊
• Q4 2024: Net income up 57% to $11.4B, revenue climbed 39% 💰
• Full Year 2024: Revenue hit $87.1B, up 34% from 2023 📏
• Sector Trend: AI chip demand soaring, per Reuters 🌟
It’s a powerhouse, driven by tech’s hunger! ⚙️
(3/9) – MARKET POSITION 📈
• Market Share: Over 60% of global foundry market 🏆
• Clients: Apple, Nvidia, AMD—big names rely on ‘em ⏰
• Trend: Expanding fabs in U.S., Japan, Germany 🎯
Firm, holding the throne but not without battles! 🚀
(4/9) – KEY DEVELOPMENTS 🔑
• Q4 Earnings: Record $11.4B profit, per Jan 16 Reuters 🔄
• Expansion: Arizona fab faces delays, full ops by 2027? 🌍
• Market Reaction: Shares up 81% in 2024, still strong 📋
Adapting, with global eyes on its moves! 💡
(5/9) – RISKS IN FOCUS ⚡
• Geopolitics: U.S.-China export curbs hit demand 🔍
• Costs: U.S. fab chips 50% pricier than Taiwan 📉
• Talent: Lack of skilled U.S. workers slows growth ❄️
Tough, but risks loom large! 🛑
(6/9) – SWOT: STRENGTHS 💪
• Profit Surge: 57% net income jump in Q4 2024 🥇
• Tech Lead: 5nm mass production, 3nm in R&D 📊
• Client Base: Powers Apple, Nvidia, more 🔧
Got silicon in the tank! 🏦
(7/9) – SWOT: WEAKNESSES & OPPORTUNITIES ⚖️
• Weaknesses: High U.S. fab costs, talent gaps 📉
• Opportunities: AI chip demand, new fabs in Japan, EU 📈
Can it keep the lead amid global shifts? 🤔
(8/9) – 📢TSMC’s Q4 profit up 57%, AI booming, your take? 🗳️
• Bullish: Still the king, long-term winner 🐂
• Neutral: Steady, but risks weigh ⚖️
• Bearish: Curbs and costs slow growth 🐻
Chime in below! 👇
(9/9) – FINAL TAKEAWAY 🎯
TSMC’s record profits signal AI dominance 📈, but U.S.-China curbs and fab delays add caution 🌿. Volatility’s our friend—dips are DCA gold 💰. Grab ‘em low, climb like pros! Gem or bust?

$XRP: Ripple’s Rocket – Ready to Soar or Facing Turbulence?(1/9)
Good evening, everyone! 🌙 CRYPTOCAP:XRP : Ripple’s Rocket – Ready to Soar or Facing Turbulence?
CRYPTOCAP:XRP ’s up 8.4% despite a crypto crash, with SEC rumors fueling hope—but will adoption or regulation steer this rocket? Let’s dive in! 🔍
(2/9) – PRICE PERFORMANCE 📊
• Recent Trend: Gained 8.4% despite a crypto market down 20.57% in Feb, per U.Today 📈
• 2025 Context: Speculation of SEC appeal dismissal boosts sentiment 📏
• Sector Trend: Crypto market down, but CRYPTOCAP:XRP bucks the trend 🌟
It’s a fighter, shaking off the bears! ⚙️
(3/9) – MARKET POSITION 📈
• Ranking: Remains a top 10 cryptocurrency, per CoinMarketCap 🏆
• Use Case: Leading in cross-border payments with RippleNet ⏰
• Trend: Regulatory clarity hopes rise, potentially unlocking more adoption 🎯
Firm, a key player in the altcoin arena! 🚀
(4/9) – KEY DEVELOPMENTS 🔑
• SEC Case: Closed-door meeting Feb 27 fuels dismissal talk, per Ripple CEO’s X post 🔄
• Adoption: RippleNet partnerships expand, with new banks joining for faster payments 🌍
• Market Reaction: Up 8.4% amid market turmoil, showing resilience 📋
Adapting, with legal and adoption catalysts! 💡
(5/9) – RISKS IN FOCUS ⚡
• Regulation: SEC case uncertainty persists, appeal process ongoing 🕳️
• Market Volatility: Crypto market’s unpredictable swings can hit hard ❄️
• Competition: Other blockchain platforms vying for cross-border payment dominance ⚖️
Tough, but risks are part of the game! 🛑
(6/9) – SWOT: STRENGTHS 💪
• Resilience: Up 8.4% when others fall, showing strong investor confidence 🥇
• Utility: RippleNet’s fast cross-border payments attract banks and institutions 📊
• Community: Robust support from holders and Ripple’s strategic partnerships 🔧
Got fuel in the tank! 🏦
(7/9) – SWOT: WEAKNESSES & OPPORTUNITIES ⚖️
• Weaknesses: SEC case not fully resolved, adoption slower than hoped 📉
• Opportunities: Potential ETF approval, expanding CBDC projects, and new partnerships 📈
Can it break free and soar? 🤔
(8/9) – 📢 CRYPTOCAP:XRP ’s up 8.4% despite market crash, SEC buzz grows, your take? 🗳️
• Bullish: $3+ soon, legal win sparks rally 🐂
• Neutral: Steady, risks balance ⚖️
• Bearish: Below $2, regulation stalls 🐻
Chime in below! 👇
(9/9) – FINAL TAKEAWAY 🎯
CRYPTOCAP:XRP ’s resilience amid a market crash shows its mettle 📈, but SEC uncertainty and competition pose challenges 🌿. Volatility’s our friend—dips are DCA gold 💰. Grab ‘em low, climb like pros! Gem or bust? S

$NIFTY: Nifty 50 – India’s Market Meltdown or Hidden Gem?(1/9)
Good Morning, folks! ☀️ NSE:NIFTY : Nifty 50 – India’s Market Meltdown or Hidden Gem?
Gift Nifty’s at 22,555, down 65 points, and the index is off 13% since October 2024! Is this a crash landing or a golden ticket in disguise? Let’s unpack the chaos! 🔍
(2/9) – PRICE PERFORMANCE 📊
• Gift Nifty: 22,555, down 65 points (Mar 6, 2025) 💰
• Recent Trend: 13% drop from Oct 2024 highs 📏
• Sector Mood: Autos, real estate dragging, per web reports 🌩️
It’s a bumpy ride, but bargains might be brewing! 🔧
(3/9) – MARKET POSITION 📈
• Index Weight: 50 top Indian firms, 65% of NSE market cap 🏅
• Scope: Spans 13 sectors, from banks to tech ⏳
• Trend: Bearish streak persists, down 13% since Oct 🎯
Still a heavyweight, but feeling the squeeze! 🌐
(4/9) – KEY DEVELOPMENTS 🔑
• Earnings Slowdown: Growth at 5%, down from 20%+ 🔄
• Macro Woes: U.S. tariffs, trade tensions spook investors 🌍
• Market Vibe: Gift Nifty signals a sour start 📋
Tough times, but sectors might shine through! 💡
(5/9) – RISKS IN FOCUS ⚡
• Geopolitics: U.S. tariff threats hit exports 🔍
• Sector Slump: Autos, real estate under pressure 📉
• Volatility: Bearish trend grips tight 🌪️
Rough waters ahead, but storms pass! 🛡️
(6/9) – SWOT: STRENGTHS 💪
• Diversity: 13 sectors, broad economic play 🏆
• Scale: Tracks India’s biggest players 📈
• Value: Potentially undervalued, per web buzz 🔩
A battered champ with fight left! 💼
(7/9) – SWOT: WEAKNESSES & OPPORTUNITIES ⚖️
• Weaknesses: 5% earnings growth, macro drag 📉
• Opportunities: Sector plays in banks, tech shine 📈
Can it dodge the punches and rally? 🤔
(8/9) – 📢Nifty at 22,555 (Gift), down 13%—your call? 🗳️
• Bullish: $24K soon, undervalued steal 🦬
• Neutral: Flatline, risks offset ⚖️
• Bearish: $20K next, bears rule 🐻
Vote below! 👇
(9/9) – FINAL TAKEAWAY 🎯
Nifty’s 13% slide and $116 Gift price signal trouble 📉, but undervalued sectors tease upside 🌱. Volatility’s our mate—dips are DCA fuel 🔥. Buy low, aim high! Hit or miss?

$ZS: Zscaler – Cloud Security Titan or Overhyped Hype Train?(1/9)
Good afternoon, folks! ☀️ NASDAQ:ZS : Zscaler – Cloud Security Titan or Overhyped Hype Train?
With NASDAQ:ZS soaring after smashing earnings, is this cybersecurity champ locking down profits or just riding a digital wave? Let’s crack the code! 🔍
(2/9) – PRICE PERFORMANCE 📊
• Current Price: Up post-earnings, exact $ TBD 💰
• Recent Results: Q1 2025 earnings beat estimates, per X buzz 📏
• Sector Trend: Cloud security demand surging 🌟
It’s a hot streak in a hotter market! ⚡
(3/9) – MARKET POSITION 📈
• Market Cap: Strong, based on 151.62M shares 🏆
• Operations: Leader in Zero Trust security ⏰
• Trend: posts hail robust growth, per Mar 6 chatter 🎯
Solid, shielding the digital frontier! 🌍
(4/9) – KEY DEVELOPMENTS 🔑
• Earnings Win: Q1 2025 topped forecasts, guidance raised 🔄
• Cloud Security: Demand spikes amid cyber threats 🌐
• Market Reaction: Stock jumped📋
Thriving, as hackers keep the world on edge! 💡
(5/9) – RISKS IN FOCUS ⚠️
• Valuation: High P/E could spook investors 🔍
• Competition: Crowded field with CrowdStrike, Palo Alto 📉
• Macro Shifts: Economic dips might slow spending ❄️
Watch out, risks lurk in the shadows! 🕵️
(6/9) – SWOT: STRENGTHS 💪
• Earnings Beat: Q1 2025 growth shines 🥇
• Market Lead: Zero Trust pioneer 📊
• Demand: Cloud security’s red-hot 🔧
Locked and loaded for the cyber age! 🔒
(7/9) – SWOT: WEAKNESSES & OPPORTUNITIES ⚖️
• Weaknesses: High valuation, competition pressures 📉
• Opportunities: Rising cyber threats fuel expansion 📈
Can it secure the bag or get hacked by rivals? 🤔
(8/9) – 📢Zscaler’s riding high post-earnings—your call? 🗳️
• Bullish: $250+ by summer, cyber’s king 🐂
• Neutral: Holding steady, risks loom ⚖️
• Bearish: $180 drop, hype fades 🐻
Vote below! 👇
(9/9) – FINAL TAKEAWAY 🎯
Zscaler’s Q1 2025 earnings pop signals strength 📈, but high stakes mean volatility’s a shadow friend 🌫️. Dips? That’s our DCA jackpot 💰. Buy low, soar high! Treasure or trap?

$CY6U: CapitaLand India Trust – Bangalore Boom or Borrowing Bust(1/9)
Good afternoon, Tradingview! ☀️ SGX:CY6U : CapitaLand India Trust – Bangalore Boom or Borrowing Bust?
At 1.02 SGD, is this Indian office play a hidden gem or a debt-laden mirage? Revenue’s up, insiders are buying—let’s unpack the curry! 🔍
(2/9) – PRICE PERFORMANCE 📊
• Current Price: 1.02 SGD 💰
• Recent Moves: Modest gains in 2025, per trends 📏
• Sector Buzz: India’s office market heating up 🌟
It’s a slow simmer, but spice is brewing! 🔥
(3/9) – MARKET POSITION 📈
• Market Cap: Around 1.36B SGD (1,333.5M shares) 🏆
• Operations: Office projects, Bangalore expansion ⏰
• Trend: Revenue hit S$278M, up from S$234M 🎯
Rooted in India’s growth soil! 🌱
(4/9) – KEY DEVELOPMENTS 🔑
• Expansion: Bangalore office buy locked in 🔄
• Insider Buying: Confidence despite earnings dip ahead 🌏
• Sentiment: Cautious cheers, per market vibes 📋
Scaling up, but debt’s the side dish! 🍛
(5/9) – RISKS IN FOCUS ⚠️
• Earnings Drop: 39% decline forecast over 3 years 🔍
• Borrowing: Heavy reliance raises eyebrows 📉
• Global Noise: China stimulus, trade jitters ❄️
Spicy risks on the horizon! 🌩️
(6/9) – SWOT: STRENGTHS 💪
• Revenue Jump: S$278M from S$234M last year 🥇
• India Play: Bangalore’s office boom 📊
• Insider Faith: Buying signals grit 🔧
A curry with some kick! 🍲
(7/9) – SWOT: WEAKNESSES & OPPORTUNITIES ⚖️
• Weaknesses: Debt load, earnings slide ahead 📉
• Opportunities: India’s resilience, market gaps 📈
Can it spice up profits or just heat debt? 🤔
(8/9) – 📢At 1.02 SGD, revenue up, insiders in—your vibe? 🗳️
• Bullish: 1.20 SGD soon, India shines 🐂
• Neutral: Flat, risks weigh ⚖️
• Bearish: 0.90 SGD, debt bites 🐻
Drop your take below! 👇
(9/9) – FINAL TAKEAWAY 🎯
CapitaLand’s Bangalore bet and S$278M revenue pop tasty 📈, but debt and a 39% earnings dip loom 🌫️. Volatility’s our mate—dips are DCA spice 💰. Scoop low, rise steady! Gold or ghee?

$BTC: Bitcoin – Digital Gold Rush or Crypto Rollercoaster?(1/9)
Good morning, folks! ☀️ CRYPTOCAP:BTC : Bitcoin – Digital Gold Rush or Crypto Rollercoaster?
With CRYPTOCAP:BTC at $82,352.34, is this the motherlode of digital wealth or a wild ride with no brakes? Let’s dig into the blockchain buzz! 🔍
(2/9) – PRICE PERFORMANCE 📊
• Current Price: $ 82,352.34 as of Mar 10, 2025 💰
• Recent Moves: Up 30%+ YTD, per web trends 📏
• Sector Trend: Crypto volatility reigns, X posts show mixed vibes 🌟
It’s a high-stakes game with big swings! ⚡
(3/9) – MARKET POSITION 📈
• Market Cap: $1.63T (based on 19.83M circulating supply) 🏆
• Status: King of crypto, 50%+ market dominance ⏰
• Trend: Whales scooping coins, per X chatter 🎯
Reigning supreme in the digital realm! 🌍
(4/9) – KEY DEVELOPMENTS 🔑
• Sentiment: X posts cheer GETTEX:82K support, ETF flows mixed 🔄
• Adoption: El Salvador adds BTC, strategic reserve talk grows 🌐
• Market Reaction: Price steady despite tariff fears 📋
Riding waves of hype and hope! 💡
(5/9) – RISKS IN FOCUS ⚠️
• Volatility: 5-10% daily swings not uncommon 🔍
• Regulation: Global crackdowns loom 📉
• Macro: Economic shifts could jolt crypto ❄️
High risk, high reward territory! 🕵️
(6/9) – SWOT: STRENGTHS 💪
• Dominance: 50%+ of crypto market 🥇
• Adoption: Nations, whales piling in 📊
• Scarcity: 19.83M of 21M coins mined 🔧
A heavyweight with staying power! 🔒
(7/9) – SWOT: WEAKNESSES & OPPORTUNITIES ⚖️
• Weaknesses: Wild price swings, regulatory haze 📉
• Opportunities: Institutional cash, global unrest boost 📈
Can it strike gold or stumble? 🤔
(8/9) – 📢 Bitcoin at $82,352.34—your bet? 🗳️
• Bullish: $100K+ by Q2, unstoppable 🐂
• Neutral: Sideways, risks weigh ⚖️
• Bearish: $70K crash, bubble bursts 🐻
Drop your vote below! 👇
(9/9) – FINAL TAKEAWAY 🎯
Bitcoin’s $82,352.34 marks a wild frontier 📈, with dominance shining through volatility 🌫️. Dips? That’s our DCA sweet spot 💰. Scoop low, ride high! Boom or bust?

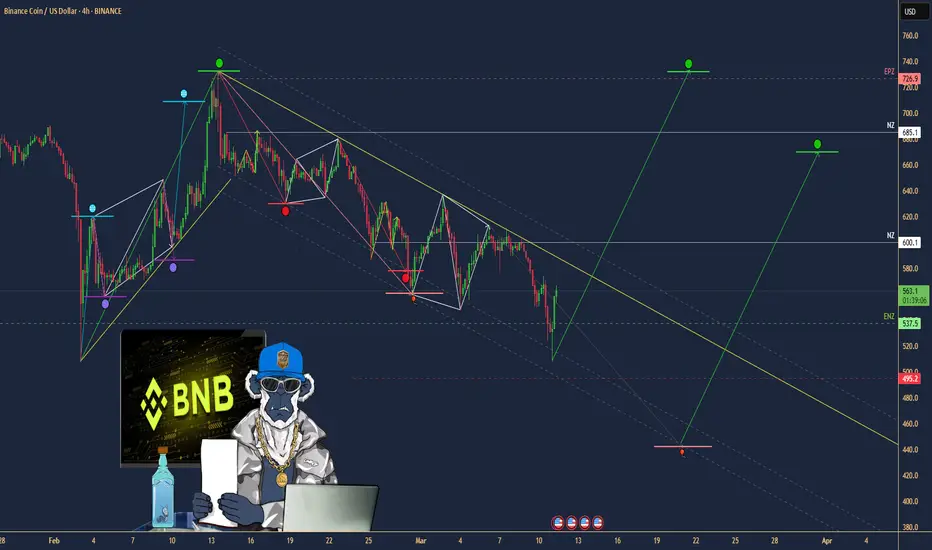
$BNB: Binance Coin – Crypto Rocket or Volatile Firecracker?(1/9)
Good Morning, TradingView! ☀️ CRYPTOCAP:BNB : Binance Coin – Crypto Rocket or Volatile Firecracker?
CRYPTOCAP:BNB ’s at $566—rocketing off recent highs or just fizzing out? With wild swings and big dreams, is it time to strap in or bail out? Let’s decode it! 🔍
(2/9) – PRICE PERFORMANCE 📊
• Current Price: $ 566 as of Mar 11, 2025 💰
• Recent Moves: Down 13.5% in an hour last night, per posts 📏
• Sector Vibe: Crypto volatility spiking, per market buzz 🌟
It’s a rollercoaster—hold tight! ⚡
(3/9) – MARKET POSITION 📈
• Market Cap: Around $82.5B (149.54M shares) 🏆
• Operations: Powers Binance ecosystem, top exchange ⏰
• Trend: Sentiment mixed, posts flag adoption 🎯
A heavyweight in crypto chaos! 🌍
(4/9) – KEY DEVELOPMENTS 🔑
• Earnings Echo: Q1 2025 beat estimates, per Mar 6 buzz 🔄
• Network Buzz: Record activity fuels optimism 🌐
• Market Reaction: Price yo-yoing, posts note caution 📋
Riding high, but bumpy! 💡
(5/9) – RISKS IN FOCUS ⚠️
• Volatility: 13.5% hourly drop spooks traders 🔍
• Competition: Rivals like Ethereum nip at heels 📉
• Macro Risks: Regulatory shadows loom ❄️
Tricky terrain ahead! 🕵️
(6/9) – SWOT: STRENGTHS 💪
• Ecosystem Might: Fuels Binance, top-tier exchange 🥇
• Adoption: Network humming, per chatter 📊
• Burns: Token scarcity drives value 🔧
A crypto beast with muscle! 🔒
(7/9) – SWOT: WEAKNESSES & OPPORTUNITIES ⚖️
• Weaknesses: Wild swings, regulatory heat 📉
• Opportunities: DeFi, GameFi growth beckon 📈
Can it blast off or stall out? 🤔
(8/9) –📢BNB at $566, wild ride—what’s your vibe? 🗳️
• Bullish: $650+ soon, adoption rules 🐂
• Neutral: Choppy but stable ⚖️
• Bearish: $500 crash, volatility bites 🐻
Holler below! 👇
(9/9) – FINAL TAKEAWAY 🎯
BNB’s $566 dance shows grit 📈, but volatility’s a wild card 🌫️. Dips? That’s our DCA sweet spot 💰. Snag low, aim high! Goldmine or gamble?
$DG: Dollar General – Discount Dynamo or Bargain Bust?(1/9)
Good afternoon, folks! ☀️ NYSE:DG : Dollar General – Discount Dynamo or Bargain Bust?
NYSE:DG ’s at $82, riding a rocky retail road! Is this budget king stacking cash or just scraping by? Let’s rummage through the bins! 🔍
(2/9) – PRICE PERFORMANCE 📊
• Current Price: $ 82
• Recent Moves: Down 0.78% from Mar 7 close, per web data 📏
• Sector Vibe: Retail shaky, but discounts hold appeal 🌟
It’s a bumpy ride with a bargain twist! 🚛
(3/9) – MARKET POSITION 📈
• Market Cap: ~$18B (219.93M shares) 🏆
• Operations: 20,000+ stores, rural retail champ ⏰
• Trend: X posts hint at turnaround hopes 🎯
Tough, but planted firm in small towns! 🏡
(4/9) – KEY DEVELOPMENTS 🔑
• Analyst Takes: Bernstein’s $90 PT, per X 🔄
• Store Push: 575 new stores planned for 2025 🌍
• Market Mood: Mixed—soft sales vs. value focus 📋
Chugging along, eyes on the prize! 💪
(5/9) – RISKS IN FOCUS ⚠️
• Consumer Woes: Low-income pressure, per X 🔍
• Competition: Walmart, Dollar Tree crowding in 📉
• Margins: Profit dips spook, per web data ❄️
Risks stalk like aisle lurkers! 🕵️
(6/9) – SWOT: STRENGTHS 💪
• Scale: 20,000+ stores, rural reach 🥇
• Value Play: Budget shoppers’ haven 📊
• Growth: New store spree in 2025 🔧
A lean, mean discount machine! 🛒
(7/9) – SWOT: WEAKNESSES & OPPORTUNITIES ⚖️
• Weaknesses: Margin squeeze, soft sales 📉
• Opportunities: Reinvestment, consumer shift 📈
Can it turn pennies into profit? 🤔
(8/9) – 📢DG at $82, retail’s rough—your guess? 🗳️
• Bullish: $95+ soon, value shines 🐂
• Neutral: Flatline, risks weigh ⚖️
• Bearish: $70 crash, margins fade 🐻
Cast your lot below! 👇
(9/9) – FINAL TAKEAWAY 🎯
DG’s $82 stance shows grit 📈, but retail’s a grindstone 🌾. Volatility’s our sidekick—dips are DCA gems 💰. Snap ‘em up, rise steady! Paydirt or pyrite?

$DXY: Dollar Strength or Dollar Dip?(1/9)
Good afternoon, everyone! 🌞 DXY: Dollar Strength or Dollar Dip?
With the DXY at 103.732, is the dollar flexing its muscles or ready to stumble? Let’s break it down! 🔍
(2/9) – PRICE PERFORMANCE 📊
• Current Price: 103.732 as of Mar 14, 2025 💰
• Recent Move: Near recent levels, down from 110.18 peak (web data) 📏
• Sector Trend: Forex markets volatile, with trade and policy shifts 🌟
It’s a wild ride—dollar’s dancing on the edge! ⚙️
(3/9) – MARKET POSITION 📈
• Role: Measures USD vs. euro, yen, pound, and more 🏆
• Influence: Drives forex and commodity prices globally ⏰
• Trend: Balancing U.S. policy and global demand, per data 🎯
King of currencies, but not without challengers! 🚀
(4/9) – KEY DEVELOPMENTS 🔑
• Trade Tensions: U.S.-China tariff talks ongoing, per data 🌍
• Rate Cut Bets: Markets eyeing Fed moves, per posts on X 📋
• Market Reaction: Holding steady at 103.732 amid mixed signals 💡
Navigating a storm of global pressures! 🛳️
(5/9) – RISKS IN FOCUS ⚡
• Rate Cuts: Could weaken dollar if Fed acts, per X sentiment 🔍
• Trade Wars: Tariffs disrupting supply chains, per data 📉
• Global Growth: Slowdowns hitting demand for USD ❄️
It’s a tightrope—risks aplenty! 🛑
(6/9) – SWOT: STRENGTHS 💪
• Reserve Status: USD’s global dominance holds firm 🥇
• U.S. Economy: Still a powerhouse, supporting dollar value 📊
• Safe Haven: Attracts flows in uncertain times, per trends 🔧
Got muscle to flex when it counts! 🏦
(7/9) – SWOT: WEAKNESSES & OPPORTUNITIES ⚖️
• Weaknesses: Vulnerable to rate cuts, trade spats 📉
• Opportunities: Strong U.S. data could lift it higher, per outlook 📈
Can it hold the line or break out? 🤔
(8/9) – POLL TIME! 📢
DXY at 103.732—your take? 🗳️
• Bullish: 105+ soon, dollar rallies 🐂
• Neutral: Steady, risks balance out ⚖️
• Bearish: 100 looms, dollar dips 🐻
Chime in below! 👇
(9/9) – FINAL TAKEAWAY 🎯
The DXY’s 103.732 shows it’s steady but tested 📈. Trade wars and Fed moves could swing it either way—dips are our DCA gold 💰. Buy low, ride high—time’s the key! Gem or bust?

$APA: APA Corporation – Oil’s Wild Ride or Steady Bet?(1/9)
Good afternoon, everyone! ☀️
NASDAQ:APA : APA Corporation – Oil’s Wild Ride or Steady Bet?
With APA at $19.70, is this energy titan a fuel for profit or a risky barrel? Let’s drill down! 🔍
(2/9) – PRICE PERFORMANCE 📊
• Current Price: $ 19.70 as of Mar 17, 2025 💰
• Recent Move: Down from higher levels, reflecting oil price volatility 📏
• Sector Trend: Energy sector volatile amid economic uncertainties 🌟
It’s a rollercoaster—hold tight! ⚙️
(3/9) – MARKET POSITION 📈
• Market Cap: Approx $6.1B (310M shares outstanding) 🏆
• Operations: Oil and gas exploration in key regions like U.S., Egypt ⏰
• Trend: Vulnerable to oil price swings, but diversified operations offer stability 🎯
Firm in its niche, but subject to market winds! 🚀
(4/9) – KEY DEVELOPMENTS 🔑
• Oil Price Dynamics: Recent drops impact revenue and earnings 🌍
• Company Strategies: Focus on cost management and strategic investments 📋
• Market Reaction: Stock price reflects current market sentiments 💡
Navigating through turbulent waters! 💪
(5/9) – RISKS IN FOCUS ⚡
• Oil Price Volatility: Primary driver of performance 🔍
• Regulatory Changes: Environmental regulations and transition to renewables 📉
• Geopolitical Tensions: Impact on supply chains and prices ❄️
It’s a risky venture—stay alert! 🛑
(6/9) – SWOT: STRENGTHS 💪
• Established Presence: Key oil-producing regions like Permian Basin 🥇
• Diversified Portfolio: Operations across multiple geographies 📊
• Financial Stability: Strong balance sheet, per historical data 🔧
Got solid foundations! 🏦
(7/9) – SWOT: WEAKNESSES & OPPORTUNITIES ⚖️
• Weaknesses: Vulnerable to oil price drops, regulatory risks 📉
• Opportunities: Expansion into new markets, M&A activities, potential oil price rebound 📈
Can it weather the storm and shine again? 🤔
(8/9) – POLL TIME! 📢
APA at $19.70—your take? 🗳️
• Bullish: $25+ soon, oil prices rebound 🐂
• Neutral: Steady, risks and opportunities balance out ⚖️
• Bearish: $15 looms, further downturn ahead 🐻
Chime in below! 👇
(9/9) – FINAL TAKEAWAY 🎯
APA’s $19.70 price reflects current market challenges 📈, but its long-term potential remains. DCA-on-dips could be a strategy to average in over time. Gem or bust?
