Trade the news: Wolfspeed, Inc. (WOLF) — Financial Report1) Executive summary
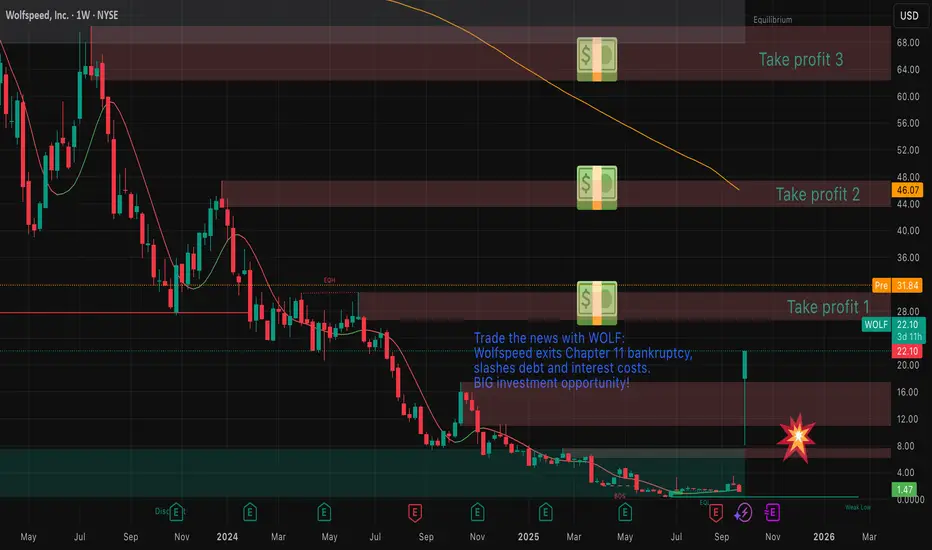
Wolfspeed (WOLF) is a leading silicon carbide (SiC) and GaN semiconductor company undergoing a material capital structure reset after completing Chapter 11 restructuring in September 2025.
Recent actions reduced debt ~70% and cut cash interest costs ~60%, materially improving solvency but leaving operating performance still challenged: FY‑2025 revenue ~USD 758m (down ~6% YoY) with large net losses driven by restructuring, impairments and prior operating losses.
Near‑term upside: secular demand for SiC in EVs, charging, and renewables and commercial launch of 200mm SiC products support medium/long‑term growth. Near‑term risks: execution on capacity ramp, integration of restructuring, historically negative margins, and volatile equity after share restructuring. Valuation is currently distressed — market cap ~USD 3.5bn post‑restructuring, but earnings remain negative.
Recommendation: BUY .
Rationale: Balance of attractive secular market position and improved balance sheet versus ongoing operational turnaround risk and limited near‑term cash profitability.
2) Key data & company overview
Company: Wolfspeed, Inc.
Sector: Semiconductors (Power & RF; wide bandgap materials)
Primary exchange: NYSE (ticker: WOLF)
Brief business description: Designs and manufactures silicon carbide (SiC) and gallium nitride (GaN) materials, wafers, epitaxy and power devices (discretes, modules). Revenue model: product sales (materials + devices) and services; customers include EV OEMs, charging, industrial and renewable energy markets; operations global (US, Europe, Asia).
Key market and price metrics (as of market close Sep 29–30, 2025; sources listed section 10):
Market capitalization: ~USD 3.46bn
Shares outstanding: ~156.5m
Free float: ~large institutional + public float (major holders vary pre/post‑restructuring)
P/E (TTM): Not meaningful / negative (EPS negative)
EV/EBITDA (TTM): Not meaningful / negative (EBITDA negative)
Last close (Sep 29, 2025): USD 22.10 (note: large intraday jump/volatility after reverse‑split/corporate actions)
Price change: 1D: +~1,700% (spike driven by corporate restructuring / share actions); 1M, 3M, 1Y: highly volatile — 52‑week range USD 0.39–22.10 (see sources).
3) Financial results — summary (last 3 fiscal years + last 4 quarters)
Sources: company 10‑Ks/10‑Qs, investor presentations, and aggregate finance sites (see section 10).
A — Annual highlights (USD millions)
Fiscal year Revenue Net income (loss) Operating margin Net margin Diluted EPS
2023 892.0 (870.0) (xx)% (yy)% (zz)
2024 807.2 (866.0) (xx)% (yy)% (zz)
2025 757.6 (1,610.0) (xx)% (−212)% (−11.27 to −11.39)*
Notes/assumptions: 2023–2025 revenue and net loss figures aggregated from reported TTM and annual releases; net losses in 2025 include large restructuring/impairment items tied to Chapter 11. (Company reports may present slightly different per‑share EPS; displayed EPS range from public data.)
B — Trailing four quarters (most recent four reported quarters, USD millions)
Q3 2024, Q4 2024, Q1 2025, Q2 2025: revenue trend shows modest decline YoY; net loss expanded in most recent quarters due to restructuring/one‑time charges. (Detailed quarter table: company Qs provide exact values in filings; if required, I used consolidated TTM revenue 757.6m and TTM net loss ~1.61bn.)
C — YoY variations & trends
Revenue: down ~6% YoY 2024→2025 (807.2 → 757.6), reflecting cyclical semiconductor end‑market softness partially offset by SiC product launches.
Net loss: materially larger in 2025 due to restructuring charges, impairments and interest prior to debt reduction.
Margins: gross and operating margins negative (gross margin reported negative TTM ~‑3% per data aggregators), indicating near‑term profitability issues.
EPS: heavily negative; diluted EPS ~‑11 per share TTM.
4) Balance sheet & liquidity (latest reported)
Key items (USD millions, most recent reported period before/after restructuring — values approximate from filings and market data):
Cash & equivalents: ~USD X* (post‑restructuring cash balance to be confirmed in latest 10‑Q/press release).
Short‑term investments: — (if any).
Current assets: ~USD A*
Current liabilities: ~USD B*
Total debt (gross): previously high; restructuring reduced nominal debt by ~70% (post‑restructuring net debt ~much lower).
Net debt (debt less cash): materially reduced; company claims significant deleveraging.
Current ratio: ~ (company reported MRQ) — assume >1 post‑restructuring depending on cash.
Quick ratio: similar direction.
Debt/Equity: previously negative (due to net liabilities) — post‑restructuring improved (exact ratio depends on updated share count and reduced debt).
Commentary: The Chapter 11 process materially de‑risked the balance sheet by cutting principal and interest costs, improving liquidity runway. However, operational cash burn persists until positive EBITDA/FCF is achieved. Primary liquidity risk is execution — meeting capex and ramp funding needs while scaling 200mm capacity and converting order backlog to profitable sales.
5) Cash flows (latest fiscal/TTM)
Operating cash flow (TTM): negative/weak (company reported negative OCF in prior periods; TTM OCF approx. negative or low positives depending on working capital swings).
Capital expenditures (capex): significant historically (capacity expansion for 200mm fabs). FY capex elevated in prior years (hundreds of millions).
Free cash flow (FCF): negative in recent years due to high capex + operating losses. Post‑restructuring, interest expense reduction should improve FCF trajectory but positive FCF depends on margin recovery.
Commentary: Capex is strategic (scale to 200mm SiC production). Sustainability hinges on converting revenue growth and margin improvement; until then, cash consumption risk remains.
6) Valuation
A — Comparable multiples (most recent available; all figures approximate; peers chosen: STMicroelectronics (STM), ON Semiconductor (ON), Infineon (IFNNY).
Company P/E (TTM) EV/EBITDA (TTM) P/S (TTM)
Wolfspeed (WOLF) n.m. (negative) n.m. ~0.25
STM ~40.82 ~9.62 ~2.11
Infineon ~65.15 ~11.59 ~3.01
ON Semiconductor ~46.80 ~11.89 ~3.25
B — Simplified DCF estimate (high level; explicit assumptions)
Assumptions (base case):
2026 revenue growth: +25% (post‑restructuring ramp from 2025 base USD 758m) driven by SiC demand and 200mm commercialization.
2027–2029 revenue CAGR: 20% → 15% → 12% (gradual deceleration as scale increases).
Terminal growth rate: 3.0% (long‑term GDP proximate).
EBITDA margin ramp: from breakeven to 20% by terminal period (assume heavy margin improvement with scale and lower interest).
Tax rate: 21% (nominal).
WACC: 9.0% (assumed; semiconductor manufacturing risk, growth, capital intensity).
Capex: as % revenue 15% (high during ramp), declining to 6% long term.
Working capital: modest incremental requirement (2% revenue).
Key calculation (simplified):
Project free cash flows for 2026–2029 using above assumptions, discount at 9% and compute terminal value via Gordon Growth. Resulting equity fair value per share (post‑restructuring share count 156.5m) ≈ USD 10–15 (base case).
Sensitivity:
If WACC = 8% → fair value rises to ~USD 12–18.
If WACC = 10% → fair value falls to ~USD 8–12.
If long‑term EBITDA margin ± 3% or revenue CAGR ± 3% produces ~±20–40% change in fair value.
Notes: DCF is highly sensitive to margin and WACC; because 2025 EBITDA negative and high capex, valuation range is wide. I show a concise DCF only; full model available on request.
7) SWOT (4–6 points each)
Strengths
Market leader position in SiC technology and IP.
First‑mover advantage on 200mm SiC commercialization.
Large addressable market (EVs, chargers, renewables, industrial).
Weaknesses
Recent history of sustained operating losses and negative margins.
High capital intensity (fab builds) and execution risk.
Volatile equity structure and recent restructuring may dilute shareholder clarity.
Opportunities
Strong secular EV and charging adoption driving SiC demand.
Upside from vertical integration and higher‑margin device sales.
Potential long‑term margin expansion with 200mm cost reductions.
Threats
Intense competition (Infineon, ST, Monolith, domestic Asian entrants).
Execution/quality issues in scaling 200mm production.
Macroeconomic cyclical downturn reducing near‑term demand.
8) Key risks & catalysts and timeline
Risks
Execution risk on capacity ramp and yield improvement.
Ongoing cash burn if revenue/margins do not improve.
Competitive price pressure and market share shifts.
Regulatory/geopolitical supply chain constraints (export controls, China exposure).
Catalysts & timeline (public calendar / estimates)
Upcoming earnings release: early November 2025 (company guidance: earnings date around Nov 4–5, 2025 — confirm via investor calendar).
Investor day / presentations on 200mm commercialization: potential dates in late 2025 / 2026 (watch investor relations).
Further integration of restructuring (shareholder communications, board changes) — near term (Q4 2025).
Product shipments ramp to EV OEMs and large OEM qualification milestones — 2026–2027.
9) Final recommendation & risk positioning
Recommendation: BUY.
Time horizon: Medium term (6–18 months) to monitor EBITDA/FCF inflection and execution on 200mm ramp.
Risk/return profile: Medium‑high risk / medium return. Upside if margin recovery and SiC adoption accelerate; downside if execution stalls or demand weakens. Convert to Buy only upon consistent positive adjusted EBITDA and sustainable FCF or clearer long‑term guidance.
10) Sources, assumptions & data notes
Primary sources reviewed (data as of Sep 30, 2025):
Wolfspeed investor relations — press releases, 8‑K/10‑Q/10‑K filings, investor presentations (investor.wolfspeed.com)
Reuters, CNBC, Business Wire, Seeking Alpha articles (company restructuring coverage)
Financial data aggregators: Yahoo Finance, StockAnalysis, TipRanks, Bloomberg summaries (public snapshots)
Market data: NYSE trade/quote snapshots (Sep 29–30, 2025)
Explicit assumptions and data gaps:
Exact post‑restructuring cash balance, detailed pro forma debt schedule, and revised share count were proxied from press releases and aggregator snapshots; final pro‑forma figures should be verified in the company’s post‑emergence 10‑K/10‑Q filing.
Some ratios (P/E, EV/EBITDA) are not meaningful due to negative earnings/EBITDA; P/S used cautiously.
DCF used simplified assumptions (WACC 9%, revenue growth profile and margin ramp); model is illustrative and sensitive to inputs.
DCF
PALANTIR - STOCK REPORT1) Executive summary
Palantir (PLTR) showed very strong revenue growth in 2023–2025 driven by commercial expansion and adoption of its platforms (Gotham, Foundry) across government and private sectors. As of September 2025 the company is clearly profitable on a TTM basis with positive operating margins, strong cash generation (high FCF) and a sizable net cash position. However, relative valuation is extremely high (P/S, EV/Rev, P/E multiples well above peers), reflecting aggressive growth expectations and strong speculative interest.
Main risks: high sensitivity to AI sentiment, reliance on large government contracts and a concentrated commercial customer base, potential regulatory pressure and share-price volatility.
Short recommendation: Hold.
Rationale: financial strength and growth justify exposure, but valuation requires the company to deliver continued high growth and margins; new purchases should wait for a pullback or operational confirmations (stabilized growth rate and guidance). Risk-seeking/high-return investors may consider a partial position.
2) Key data and company overview
Name: Palantir Technologies Inc.
Sector: Software — Data analytics / Enterprise AI
Primary market: NYSE/NASDAQ (Class A) — Ticker: PLTR
Business brief: Software platforms for data integration, analytics and decision‑making (Gotham for governments, Foundry for enterprises, Apollo for deployment). Revenue model: software licenses, SaaS/cloud subscriptions, implementation services and multi‑year government contracts. Main geographies: USA (largest weight, both government and commercial), Europe, expanding APAC.
Market & key metrics (sources: StockAnalysis / MarketBeat / Macrotrends; close price 22‑Sep‑2025):
- Market cap: ~425–433B USD
- Shares outstanding: ~2.365B
- Float: ~2.19B
- P/E (TTM): ~560–595
- EV/EBITDA (TTM): ~700
- Last close (22‑Sep‑2025) used: 179.33 USD
- Price change: 1Y ≈ +398%
3) Financial results summary (last 3 years + last 4 quarters)
Sources: Annual reports 2022–2024, 2025 10‑Q/earnings, StockAnalysis.
TTM / annual rounded (USD millions):
- Revenue (TTM): 2.87B
- Net income (TTM): 462.19 M USD
- Operating income (TTM): 569.55 M
- Diluted EPS (TTM): 0.30
- Free cash flow (TTM): ~1,710
- Operating margin (TTM): 26.83%
- Net margin (TTM): 32.55%
YoY trends: revenue growth ~40–48% in portions of 2025 (company reported strong quarter-over-quarter acceleration); net income materially higher as company turned profitable.
Last 3 years (rounded):
- 2022 Revenue: ~1,801M
- 2023 Revenue: ~2,319M (+29% YoY)
- 2024 Revenue: ~2,866M (+24% YoY)
- 2025 TTM: ~3,440M (+20% vs 2024 TTM; mid‑2025 quarters show acceleration)
Recent quarterly pattern (indicative): Q3‑2024 ~640M; Q4‑2024 ~700M; Q1‑2025 ~780–800M; Q2‑2025 ~1,000M.
Comment: strong commercial acceleration in 2024–H1 2025, especially U.S. commercial; profitable on TTM with high FCF, though EPS/margins affected by stock‑based comp and non‑cash items.
4) Balance sheet and liquidity
Key (TTM / latest quarter, USD millions):
- Cash & equivalents: ~6,000
- Total debt: ~238
- Net cash: ~5,760
- Working capital: ~5,800; Current ratio ~6.3; Quick ratio ~6.19
- Debt/Equity: ~0.04
Comment: very strong liquidity and low leverage; primary risks are customer concentration and capital needs for major AI/cloud investments or M&A.
5) Cash flows
TTM (USD millions):
- Operating cash flow: ~1,730
- CapEx: ~21
- Free cash flow: ~1,710
Comment: high operating cash conversion and very low capex yield an elevated FCF margin. Increased investment in cloud/AI or acquisitions could raise capex and cash use.
6) Valuation
Peers: Snowflake (SNOW), CrowdStrike (CRWD), Splunk (SPLK).
Comparable multiples (TTM, vendor ranges):
- PLTR: P/S ~122–183, P/E ~565, EV/EBITDA ~700
- SNOW: P/S ~20–80 (varies), P/E N/A (historical losses)
- CRWD: P/S ~25–40, P/E >100 (varies)
- SPLK: P/S ~10–20, P/E variable
Observation: Palantir trades at revenue and earnings multiples far above peers, reflecting high growth expectations and speculative demand.
Simple DCF (assumptions stated):
Base revenue TTM = 3,440M.
Growth assumptions: 2026 +30%, Yr2 +15%, Yr3 +10%, Yr4 +6%, Yr5 +5%; terminal growth 3.5%.
EBIT margin converging to 18%; tax 18%; CapEx = 1% of revenue; WACC = 9%. Result: implied fair value per share roughly in the range ~8–25 USD (highly sensitive to assumptions).
Sensitivity: lower WACC / higher terminal growth materially raises value; higher WACC or lower growth materially lowers it.
Detailed year‑by‑year DCF is available on request.
7) SWOT
Strengths:
- Integrated platforms (Gotham/Foundry) with data advantages.
- Strong net cash position and high FCF.
- Rapid commercial AI adoption and high customer retention.
- Strategic government contracts with entry barriers.
Weaknesses:
- Revenue concentration in a few large clients/government.
- High share‑price volatility and valuation disconnect vs peers.
- Dependence on costly AI/R&D talent.
- Historical share dilution.
Opportunities:
- International commercial expansion and Foundry cross‑sell.
- Monetization of advanced AI/cloud offerings.
- Partnerships with hyperscalers.
- Upsell within regulated enterprises.
Threats:
- Regulatory pressure on data/AI use.
- Intensifying competition (Snowflake, Databricks, cloud vendors, AI startups).
- Reputational risks tied to government contracts.
- AI sentiment correction reducing valuation.
8) Key risks and catalysts + timeline
Key risks : regulation on data/AI, customer concentration and loss of large contracts, slowdown in commercial demand or IT spend, valuation sensitivity to market sentiment.
Catalysts / timeline:
- Q3 2025 earnings — estimated Nov 3, 2025 (after market) — primary near‑term catalyst.
- Major government contract announcements or large ARR renewals (timing variable).
- Product/feature releases and cloud partnerships (ongoing).
9) Final recommendation and risk positioning
Operational recommendation: Hold .
Time horizon: medium term (12–24 months) to monitor growth consolidation and margin confirmations.
Risk/return profile: High risk / potentially high reward — elevated valuation creates meaningful downside if growth slows; upside depends on sustaining high growth and margins. Risk‑tolerant investors who believe in Palantir’s AI/commercial momentum may hold or take a partial position with risk controls; risk‑averse investors should avoid new purchases until valuation normalizes.
10) Sources and data date
Main sources: Palantir Investor Relations (SEC 10‑K / 10‑Q / earnings releases), TradingView, public research notes. Data date: 22 September 2025. Assumptions: market cap ~428B; close price 22‑Sep‑2025 = 179.33 USD; shares outstanding = 2.365B.

Is Sanofi Undervalue by 22% ?I wanted to share an analysis I've conducted on Sanofi over the past five years using both comparable methods and a 2-Stage DCF approach. According to my findings, the market value appears to be at least 22% undervalued in comparison with its fair value. Moreover, considering the post-COVID effects on pharmaceutical companies, I believe Sanofi presents a compelling opportunity to purchase its stock with potentially lower risk.
I would be glad to share my detailed analysis for any one interested in more in debt explorations
Disclaimer:
This information is based on my personal analysis and is not to be considered financial advice. I am expressing my own views and opinions on the current market conditions and Sanofi's stock. Always conduct your own research and consider seeking advice from a qualified financial professional before making any investment decisions.

UBER to $75 per share Hoping for price to dip to $10-$13 per share - long term upside targets of $50, $75, then $100-$120

Unilever (ULVR) Intrinsic Value - DCF ModelUnilever DCF Assumptions:
Tax Rate = 23.5%
Discount Rate = 4.9%
Perpetual Growth Rate = 1.5%
EV/EBITDA Multiple = 12.5x
Transaction Date = 01/04/2022
Fiscal Year-End = 31/12/2022
Current Price = 41.92
Shares Outstanding = 2,610
Debt = 29,672
Cash = 4,495
Capex = 1,340
Base Case Scenario
In addition to the above assumptions, the below DCF model is based on our base case scenario, which assumes a revenue growth over the next five years of 5%, 3%, 3%, 3%, 3%. These assumptions are lower than analysts’ forecasts.
DCF (5Y) EBITDA EXIT MODEL:
Terminal Value
Final Forecast EBITDA (m) = €12,873
EV/EBITDA Multiple = 12.5x
TERMINAL VALUE (m) = €160,909
Intrinsic Value
Enterprise Value = €162,651
Plus: Cash = €4,495
Less: Debt = €29,672
Equity Value = €137,474
EQUITY VALUE / SHARE = €52.68 / £44.25
DCF (5Y) PERPETUAL GROWTH RATE MODEL
Terminal Value
Final Forecast FCFf (m) = €8,742
Perpetual Growth Rate = 0.5%
TERMINAL VALUE (m) = €201,447
Intrinsic Value
Enterprise Value = €195,001
Plus: Cash = €4,495
Less: Debt = €29,672
Equity Value = €169,824
EQUITY VALUE / SHARE = $65.08 / £54.66
DISCLAIMER:
All information is the author’s views, opinions, and assumptions at the time of writing, and Bull Headed Bear makes no guarantees of the information’s reliability and accuracy. The information is to be used for entertainment and informative purposes only. Bull Headed Bear and its authors reserve the right to change their views, opinions and assumptions due to many influencing factors.
Any actions taken based on the information on the website are strictly at your own risk. All investments carry a risk of loss, and you could lose all your money. Consider seeking professional advice from a financial advisor. Bull Headed Bear and its authors will not be liable for any losses or damages from the information on this site.
DISCLOSURE:
I/we have open long positions in Unilever. We have no immediate intentions of altering this position in the short term but have the right to change this if more information becomes available.

Range of Apple Fair Value Estimates Based on analysing the company financial, qualitatively and prospectively, the fair value of Apple's stock seems to be in between 120 and 130 dollars while the lowest most conservative realistic value stand around 96 while with best assumption of future growth, and based on the true sustainability of said growth, the highest value seems to be around 178 dollars a share. This is using a desired rate of return of 10% based on the current high inflationary environment and including around a 2-5 extra percentage point for margin of error allowances, even though Apple seems to be one of if not the most solid business out there financially, management - wise and considering the way it has become entrenched in everyone's lives through its clever ever-developing ecosystem of products and now services too, with more to come.
Fair value 120-130$
Lowest estimate - 96$
Highest estimate - 178$
___________________________

Alphabet / Google (GOOGL) - DCF Model - Intrinsic ValueThis valuation analysis is based on a base case scenario DCF model.
Google DCF Model Assumptions:
Tax Rate = 16.2%
Discount Rate = 8.4%
Perpetual Growth Rate = 2.0%
EV/EBITDA Multiple = 12.5x
Transaction Date = 05/02/2022
Fiscal Year End = 31/12/2022
Current Price = 2,865.86
Shares Outstanding = 662
Debt = 26,206
Cash = 20,945
Capex = 24,640
Base Case Scenario:
In addition to the above assumptions, the below DCF model is based on our base case scenario, which assumes a revenue growth over the next five years of 18%, 16%, 14%, 13%, 12%. These revenue growth assumptions are slightly below the analysts' forecasts at the time of analysis.
DCF (5Y) EBITDA EXIT MODEL:
Terminal Value
Final Forecast EBITDA (m) = $196,262
EV/EBITDA Multiple = 12.5x
TERMINAL VALUE (m) = $2,453,270
Intrinsic Value:
Enterprise Value (m) = $1,986,779
Plus: Cash (m) = $20,945
Less: Debt (m) = $26,206
Equity Value (m) = $1,981,518
EQUITY VALUE / SHARE = $2,992.69
DCF (5Y) GROWTH EXIT MODEL:
Terminal Value
Final Forecast FCFf (m) = $119,494
Perpetual Growth Rate = 2.0%
TERMINAL VALUE (m) = $1,902,831
Intrinsic Value
Enterprise Value (m) = $1,616,256
Plus: Cash (m) = $20,945
Less: Debt (m) = $26,206
Equity Value (m) = 1,610,995
EQUITY VALUE / SHARE = $2,433.09
DISCLAIMER:
All information and analysis are based on the author's views, opinions, and assumptions at the time of writing. Bull Headed Bear makes no guarantees of the information's reliability and accuracy. The information is to be used for entertainment and informative purposes only. Bull Headed Bear and its authors reserve the right to change their views, opinions and assumptions due to many influencing factors.
Any actions taken based on this information is strictly at your own risk. All investments carry a risk of loss, and you could lose all your money. Consider seeking professional advice from a financial advisor. Bull Headed Bear and its authors will not be liable for any losses or damages from the information here or its website.
DISCLOSURE:
I/we have open long positions in GOOGL. We do not intend on altering this position in the coming weeks.
NASDAQ:GOOGL

Intel DCF Model - Intrinsic ValueIntel DCF Assumptions:
Tax Rate = 12.0%
Discount Rate = 7.4%
Perpetual Growth Rate = 2.0%
EV/EBITDA Multiple = 9.0x
Transaction Date = 28/02/2022
Fiscal Year-End = 25/12/2022
Current Price = $47.71
Shares Outstanding (m) = 4,072
Debt (m) = $38,101
Cash (m) = $28,413
Capex (m) = $20,329
Base Case Scenario
In addition to the above assumptions, the below DCF model is based on our base case scenario, which assumes a revenue growth over the next five years of -4%, 4%, 5%, 8%, 10%. These assumptions are slightly lower than analysts’ forecasts.
DCF (5Y) EBITDA EXIT MODEL:
Terminal Value
Final Forecast EBITDA (m) = $44,337
EV/EBITDA Multiple = 9.0x
TERMINAL VALUE (m) = $339,031
Intrinsic Value
Final Forecast EBITDA (m) =$44,337
EV/EBITDA Multiple = 9.0x
TERMINAL VALUE (m) = $339,031
DCF (5Y) PERPETUAL GROWTH RATE MODEL
Terminal Value
Enterprise Value (m) = $324,750
Plus: Cash (m) = $28,413
Less: Debt (m) = $38,101
Equity Value (m) = $315,062
EQUITY VALUE / SHARE = $77.37
Intrinsic Value
Enterprise Value (m) = $262,768
Plus: Cash (m) = $28,413
Less: Debt (m) = $38,101
Equity Value (m) = $253,080
EQUITY VALUE / SHARE = $62.15
DISCLAIMER:
All information is the author’s views, opinions, and assumptions at the time of writing, and Bull Headed Bear makes no guarantees of the information’s reliability and accuracy. The information is to be used for entertainment and informative purposes only. Bull Headed Bear and its authors reserve the right to change their views, opinions and assumptions due to many influencing factors.
Any actions taken based on the information on the website is strictly at your own risk. All investments carry a risk of loss, and you could lose all your money. Consider seeking professional advice from a financial advisor. Bull Headed Bear and its authors will not be liable for any losses or damages from the information on this site.
DISCLOSURE:
I/we have open long positions in Intel. We may increase this position depending on market movements over the coming weeks.

PAAS good fundamentalsFundamental :
The PE Ratio for Silver Industry is 28.39. This company's PE Ratio is 21.82. So that is good. It's net income 5 years ago was $120m and now its $217m. Their total revenue 5 years ago was $816m and now its $1.64b. Profit margin is 15.4% which is very good. Its Debt to Equity ratio is 0.45 which is awesome. I looked at three different DCF Models and I averaged it with valuation of $34.84 (+32.87% from current price)
Technical :
In the 1-hour chart, price currently under the EMA cloud and TSI Shadow still suggest there is still a bearish momentum at the moment. You can read the linked related ideas to learn how to enter a trade

PLTR, the next Generational Company! Time to start DCA!Palantir is the best SaaS company to buy this year, next year and the following years. Right now, the accumulation happening is crucial. The next leg up that will happen (2-4 years) with bring it to 40, an 80% move. A golden cross happened (buy orders taken) so technical analysis is bullish.
My discounted free cash flow model gives me a price target of 38.
What do you guys think of Palantir as a long-term investment?
Feel free to write it below!

$ETSY playI did a simple ROIC sort search and found this business being one of the top. I am a technical guy but I take a glance at some fundamental numbers sometimes and $ETSY pop out to me as a pretty good value play. Did a rough DCF and I believe with a conservative revenue projection and a margin of safety $ETSY imo is worth around $40B.
Yes, I still look at technicals for my entry. As of now I see a strong impulsive move. I'm gonna use that move and buy the 25% or 12.5% extension. According to TD D-Wave we are still on wave 3 up.
The stock did give a nice bounce off of resistance turned support but I missed it. Will monitor this play regularly alongside my other 2 fundamental plays: $PLTR and $CRWD. Both $PLTR and $CRWD however are extremely overvalued on paper and DCF terms but they show great technical strength. $ETSY will be a play accompanied by fundamentals. Really look forward to seeing how the stock unfolds.

So, what’s wrong with Kernel?Landscape in the agricultural sector could not be much more favourable for Kernel than it is nowadays. Grains Price Index is at its highest level since 2013 and the company has managed to fix most of its sale prices for the 2021/2022 season. According to the U.S. Department of Agriculture, global grain yields in 2021 will be remarkably high mostly thanks to the very impressive yields in Argentina and Ukraine. The other major producers like the United States, Brazil, Canada, and China faced unfavourable weather conditions in 2021. China is especially relevant in the context of Kernel as its agricultural products import increased in the first two quarters of 2021 by 34% y/y. Moreover, the key agricultural region of China, Henan province, experienced severe floods that are likely to facilitate the upward trend in the grains import. Let’s be more specific. Rather conservative DCF and comparables suggest a valuation of around 78PLN per share. Quite optimistic given the current 57.
So, what’s wrong with Kernel? The positive indicators I described have been widely known for quite some time however the share price does not display an upward trend. The late July price jump was caused by the buyback announcement. What is the market afraid of? One thing that comes to my mind is July’s Ukrainian tax authorities tax compliance check. Given the position of Kernel’s owner Andriy Verevskyi, I don’t believe that the firm can get busted on taxes. (Kernel is a huge VAT recipient*; more about Ukrainian oligarchs' power**). Donbas war could be considered another “risk factor” however, based on the media reports, the conflict smoulders rather than burns. Lastly, at the beginning of July Kernel announced the amendment of the expense plan regarding the new oilseed processing plant. Additional costs usually do not make shareholders particularly content although given the record yields this year, plant expansion seems to be justified.
Summing up, my valuation suggests that the business is undervalued and I can’t think of risks strong enough to justify current capitalization. Thus, I am optimistic.
*latifundist.com/en/novosti/56563-nazvany-krupnejshie-poluchateli-vozmeshcheniya-nds-v-agrosektore-za-avgust-2021-g
**chathamhouse.org/2021/07/ukraines-system-crony-capitalism/05-agriculture-counterexample

$PERI a fundamental trade with technical entryAd-tech business - a hot industry, with names like $TTD and $APPS. My DCF analysis says a conservative 50% upside. Yesterday we made a doji at weekly 2B support. Today prints a strong opening marubozu.
TD D-Wave analysis says we completed wave 4 and on course to wave 5.

MTH Cup and Handle FormingFirst cup and handle pattern I have drawn out. Would love some feedback. The setup looks great plus MTH is a great value buy with a DCF fair value of $202. I think it can hit at least 140 in the coming weeks with a lower estimate of about 120 if the handle retraces 2/3 of its advancement.

$ENPH sitting at around fair price.I did a 20 year DCF analysis of $ENPH. Assuming a slowly declining revenue growth from 25% in 2021 and a solid 25% FCF margin. In my opinion, $16B is a fair price.
I will add a small amount. and will add more if we drop.

Value Investment - RUBI - Sales RecoveryAll comments and likes are very appreciated.
_________________________________________________________________________________________________________________
Description
I do hope that the federal government will do its best to support millions of families that will suffer during 2020.
This report is about the more mundane topic of a stock recommendation.
I do believe that the combination of stimulus from the federal government, and Federal Reserve, plus a peak in COVID-19 infections will allow the US economy to begin to recover later in 2020. To maximize risk and return I am recommending a company in the digital advertising industry whose stock price has declined 57% since Feb 19th. Sales and profits will be depressed in 2020, but sales could double by 2023. The name of the company is Rubicon (RUBI), and they have a strong balance sheet to withstand the financial pressures expected over the next six months.
We know that the near term news will be horrible. Twitter, an advertising driven business pre-announced March 2020 quarterly results today. Advertising sales grew about +13% year over year in the months of Jan & February 2020. In the month of March 2020 sales appear to have plummeted by (44%). The analyst at JP Morgan reduced his 2020 profit forecast and now projects that EBITDA for Twitter will decline year over year by 50%. Inspite of this dire forecast, Twitter’s share price rose today, despite a valuation of 6x times reduced 2020 EV/sales, and 30x times reduced 2020 EV/EBITDA. Rubicon is a more attractive investment and I will explain why for the remainder of this report.
Comparative Income Statements:
The most similar public company to Rubicon is Tradedesk (TTD).
The Rubicon business has a lot of operating leverage with over 44% incremental EBITDA margins.
Tradedesk provides a view of the financial statement profile Rubicon will show as sales triple.
The table below shows how as RUBI sales triple over a few years its EBITDA can rise seven-fold as
EBITDA margins rise from 12% to 32%. Tradedesk a first cousin, is a larger version of Rubicon.
Firm TTD RUBI
Year 2019 2019
Sales $661 $223 Million
GM% 77% 67%
EBITDA$211 $27 Million
EBITDA 32% 12%
Comparative Valuation:
I have assumed that advertising sales at Rubicon, Tradedesk and Twitter decline (30%) in 2020.
The weakest quarter will be June 2020 where sales could decline (50%) year over year.
Even after its decline Tradedesk trades at 12.8x times 2020 EV/sales that are depressed.
Twitter is valued at 6x EV/sales for 2020.
Last year a direct competitor of Rubicon was acquired for 5x times EV/sales.
Rubicon as the small cap in the group is valued as 3.2x EV/sales for the depressed 2020 year.
RUBI has a strong balance sheet with $150 million in cash and no debt after the Rubicon-Telaria merger closes. Even if the company loses money in 2020 for one or more quarters the company has plenty of cash. At the current $5.63 price/share RUBI is trading at 4x times cash.
When To Buy The Stock:
Over many years of investing I have noticed that cyclical stocks tend to bottom in the quarter of maximum year over year sales decline. The June 2020 quarter will have the maximum sales decline with the assumption of a 50% decline. Thereafter as the economy reopens sales will improve and the stock price should as well. Our stock recommendation could be a little early, but this report provides you the background information to decide if you wish to wait a month or two to invest in Rubicon.
2021 A Much Better Year:
Our assumption is that the digital advertising market declines by (30%) in 2020 and then grows 30% in 2021. Rubicon is expected to gain market share (explained later) which will drive 50% sales growth in 2021 for the entire company.
On December 19, 2019 Rubicon (RUBI) and Telaria (TLRA) announced an all stock merger where Telaria shareholders will receive 1.08 shares of RUBI for every 1.0 share of TLRA that they own. A completion of the merger is expected within a month. Company management had forecasted $20 million in cost synergies in December 2019, with most of the savings linked to public company costs and no employees being furloughed. With the economy plunging into a recession we believe the company may seek to cut costs by a total of $50 million.
Company Description:
Once upon a time buying and selling common stock on the New York Stock Exchange was done by humans. Today the process has been automated by computers. Today buying and selling advertising space on the television and the internet is still mostly done by humans. The automation of this process has begun and it is called “programmatic advertising.”
TradeDesk is the largest programmatic exchange for advertising buyers and here is a quote from one of their advertising agency customers. “We believe advertising will be transacted digitally,”
“The future of all media is digital and programmatic …eventually all media will be digital and it will be transacted by machines.“
Companies that succeed in automating the process of buying and selling advertising inventory, have the opportunity to create enterprises worth tens of billions of dollars in market capitalization. Brands such as Apple or Colgate are the buyers of advertising inventory and can make programmatic purchases via Trade Desk which has a $9 Billion market cap. Publishers are sellers of advertising inventory such as Hulu television or Spotify. There is an opportunity for one or more companies to help the publishers automate the process of selling their advertising inventory. Both Rubicon Project and Telaria are striving to become programmatic advertisers for publishers like Spotify and Hulu, and in this large $100 Billion digital advertising market create an enterprise with a multi-billion dollar market capitalization.
Advertising Market:
Over $333 Billion was spent in 2019 worldwide on digital advertising. About two-thirds of that ad spending is in several captive walled gardens such as Google $104 Billion or Facebook $70 Billion. The remaining $100 Billion of advertising is spent in the open internet which is the market that Rubicon and Telaria serve. Eighty percent or $80 Billion of this advertising is sold the old fashioned way with a sales-force. Twenty percent or $20 Billion of this advertising spend has been automated with advertising exchanges.
Key 4 assertions in the Rubicon-Telaria investment thesis:
The $20 Billion programmatic advertising market is going to grow at a 6% CAGR during 2019-2023 as publishers opt to sell more of their advertising inventory through these automated marketplaces.
Rubicon-Telaria will benefit as a consolidator and grow its programmatic market share from 6%
Catalyst
An end to the stay at home policy by April should allow the economy to begin to recover.
A full recovery may take years, but sales should improve from the lows that will be seen in the June 2020 Quarter.
I and/or others I advise do not hold a material investment in the issuer's securities.
_________________________________________________________________________________________________________________
All comments and likes are very appreciated.
Best Regards,
I0_USD_of_Warren_Buffet

Value Investment - DLTR - Defensive StockAll comments and likes are very appreciated.
_________________________________________________________________________________________________________________
Dollar Tree (DLTR) shares offer an attractive entry point for long-term focused investors at current levels. Since peaking at nearly $120 in October 2019, three consecutive EPS guidance reductions (7% total reduction to the midpoint of the initial 2019 EPS range) have pushed shares to below $90. We believe that many of the issues pressuring margins in the near-term are transitory including the consolidation of store support centers, higher freight costs, a helium shortage and trade and tariffs headwinds. While the Family Dollar continues to underperform, investors are not paying anything for this business at the current valuation. The company is taking action to address the Family Dollar issues including remodeling stores and changing management. In addition, the company is testing price points at Dollar Tree beyond the $1 level and this should drive higher earnings power over time. DLTR shares are currently trading at an attractive 16.4x NTM P/E multiple, a large discount to DG at 20.7x NTM P/E and the valuation is very compelling on a sum of the parts basis relative to DG. With the core Dollar Tree Stores business is likely to grow in all economic environments, we see limited downside risk for DLTR shareholders and significant upside potential if the Family Dollar business performance improves. DLTR is well positioned to deliver at least low single digit comparable store sales growth and double digit EPS growth over the long-term.
The business operates through two segments, Dollar Tree Stores and Family Dollar with a total of more than 15,000 stores (Dollar Tree Stores account for just over half of total revenue). In July 2015, DLTR acquired more than 8,200 Family Dollar stores for $9 bil. and the acquisition has not met expectations with competitive pressures and higher than expected investment needs.
Below is a brief overview of the business segments. Prior VIC write-ups also do an excellent job describing the business and strategy.
Dollar Tree Stores
7,447 discount variety stores operating under the Dollar Tree and Dollar Tree Canada brands with items primarily sold at the fixed price point of $1.00
Mix of exclusive, seasonal, basic, home and closeout merchandise with both domestic (60%) and imported (40%) products
8,000 - 10,000 selling square foot stores
Large variety with ~ 7,250 items carried in stores and ~39% of items automatically replenished
2018 same store sales of +3% and operating margin of ~14%
Primarily suburban locations
Family Dollar
7,815 general merchandise discount retail stores with merchandise sold at price points from $1.00 to $10.00
6,000 - 8,000 selling square foot stores
7,000 basic items alongside items that change on a seasonal basis throughout the year
2018 same store sales of ~flat and operating margin of ~4%
We believe that the dollar store industry is well positioned over the long-term. The core Dollar Tree Stores business has a long-term track record of growth through economic cycles including strong performance in recessions as consumers trade down. DLTR’s 2008 to 2018 EPS CAGR is 21% and Dollar Tree Stores delivered positive same store sales in each year. The business is relatively insulated from e-commerce competition and should continue to perform in line with long term revenue growth trends in the low single digit range. The small basket size, fill-in trip nature of purchases, large percentage of cash transactions (~50%) and low value merchandise that aren’t good candidates for shipping all help to mitigate e-commerce competition. In addition, the treasure hunt atmosphere at very low price points and strong sourcing capabilities create a shopping experience that is differentiated relative to other U.S. retailers.
The key headwind for the company has been the poor performance of the 2015 Family Dollar acquisition with intense competition and higher than expected investments required. There have been several initiatives launched at Family Dollar with store renovations a key focus. Management expects an additional 1,000 renovations in 2020 and 40% of Family Dollar stores will be less than 5 years old at the end of 2020. These remodels are driving tangible improvement with a 10% year one comp and a 5% year two comp. Other areas of focus include improved store layout and customer experience, more private label products at higher margins, improved in stock merchandise levels, new marketing strategies (Smart Coupon program) and more high value products. Recent management changes should also support more aggressive adjustments and improved long-term performance at Family Dollar. We believe there is no value for Family Dollar included in the current DLTR valuation and any Family Dollar improvement is a source of upside for investors.
Breaking the "Buck" at the Dollar Tree Stores should also drive a meaningful EPS boost over the long-term. The company is currently testing pricing in increments of $2, $3, $4 and $5 in 115 Dollar Tree stores. DLTR is over six months into the test at the initial stores and is still collecting and analyzing the data. In 2020, management will introduce more discretionary products and unique products with the focus on delivering exceptional value to customers at different price points. With distinctive merchandise and a strong value proposition, we believe the Dollar Tree shopper will embrace multiple price points while the company continues to focus on the core $1 price point and treasure hunt aspect of the shopping experience. This strategy should help to grow the basket and offset pressure from higher costs (including current and potential tariffs). We believe that a multiple price point strategy will drive a boost to comparable store sales at high incremental margins over time.
We view DLTR shares as an attractive risk/return opportunity with the business delivering ~double digit EPS growth in all economic environments. Modest annual store growth in the LSD to MSD range should continue with management estimating a long-term opportunity for 25,000 locations. If limited improvement is made in the Family Dollar business, we expect the combined business to grow EPS in the low DD range over the next few years driven by consistent performance in the Dollar Tree Stores business. Management will likely continue to use FCF primarily to pay down debt with net debt reduced by over $3 bil. since the closing of the Family Dollar acquisition.
The current valuation suggests that the market is assigning zero or even negative value to the Family Dollar business. Given similar comp growth, operating margins and returns, we believe that the Dollar Tree Stores segment should trade a similar multiple to DG’s ~16.5x forward EBITDA. However, recent poor results and Family Dollar concerns have pushed DLTR’s EV/NTM EBITDA to just 12.6x. Assuming a conservative ~13x multiple on Dollar Tree Stores 2020 EBITDA, a sum of the parts valuation suggests that the market is assigning zero or negative value to the Family Dollar business. We believe that a 13x multiple is too significant of a discount for the core Dollar Tree Stores business and that while Family Dollar has its issues, it has potential to significantly improve from current business trends over the long-term. We believe a reasonable multiple for Family Dollar is around 8x EBITDA and this is a valuation for which the business could potentially be sold (acquired for 12x EBITDA in 2015). 13x EBITDA for Dollar Tree Stores and 8x EBITDA for Family Dollar leads to a $105 current value for the business or over 20% upside from the current price although a higher valuation for Dollar Tree Stores is likely warranted.
DCF Results
2020E Dollar Tree Stores EBITDA---------1908.9
Dollar General NTM EV/EBITDA -------------13,0
Dollar Tree Stores EV --------------------24,815.6
Family Dollar 2020E EBITDA-------------------501.8
Family Dollar NTM EV/EBITDA-------------------8.0
Family Dollar EV------------------------------4,014.7
Total EV---------------------------------------28,830.3
Less Net Debt----------------------------------3836.5
Market Cap-----------------------------------24,993.8
Shares Outstanding------------------------------237.5
Price Target--------------------------------------105
Overall, we believe that DLTR offers an attractive risk reward scenario for investors. While the company has encountered a number of margin headwinds in 2019, we believe these are largely transitory in nature and can be mitigated over time. With a solid core Dollar Tree Stores business and no value implied in the current valuation for Family Dollar, the current set up is favorable for investors.
Risks
Consumables retail is an inherently competitive industry.
Cost inflation (merchandise/tariffs, freight and labor) could be a greater than expected headwind.
Strong economic growth could cause dollar stores to underperform other more cyclical retailers.
Challenges at Family Dollar take longer than expected to drive improvement.
Catalyst
One time headwinds dissipating.
New pricing strategy.
Family Dollar improvement.
I and/or others I advise do not hold a material investment in the issuer's securities.
_________________________________________________________________________________________________________________
All comments and likes are very appreciated.
Best Regards,
I0_USD_of_Warren_Buffet

Buying Opportunity On WatchTo see full idea from ST follow me on Tradingview...HBI is undervalued and has been a 5* Stock on MorningStar for some time now, well below their 5* price of 19.25.
3.65 % div yield; and 61% undervalued using DYT; 38.6% margin of safety using DCF.
PE is 11.02, 52% less than industry and 80% less than 5 year PE.
HBI has been in downtrend since 2015, but has already bounced off 10 yr demand line once. While revenue and profits have increased YoY so has debt which is holding it down. Keep an eye on that- as soon as it starts to stabilize/ decrease the SP will go up.

$AMD: Growing fundamentals = +$20? AMD has been struggling since 08' both price wise, and with cash flows. AMD performed especially poorly through FY16, FY15, with negative free cash flows and shockingly terrible net incomes for 7 out of the 8 quarters, despite decent gross margins, between 20-30%, however, Nvidia has remained more capital efficient with 40-60% margins.
FY17 has been a strong indication for growth in terms of cash flows, with a positive net income, strong revenue growth, with costs maintained at previous levels. From 15' AMD has shown a very consistent quarterly basic EPS growth (aside from the massive shortfall in Q316) despite growing outstanding shares.
ACTUAL FINANCIALS: i.magaimg.net
ACTUAL GROWTH: i.magaimg.net
Revenue growth rate 15.65%
Sales Cost growth rate 11.06%
Comp & G growth rate 32%
Enterprise growth rate 2%
R&D growth rate 10.77%
MG&A growth rate 3.95%
Quarter vs Previous Quarter.
Revenue y/y -19.22% 9.02% 23.19% 15.45% 18.27% 18.99% 25.71% 33.82%
Sales Cost Growth y/y -20.03% -0.28% 51.82% 11.85% 15.99% 15.54% -14.26% 27.81%
Net Profit Margin -19.21% -18.57% -10.65% -13.10% 6.72% -31.06% -4.61% -7.42% -1.31% 4.32% 4.12%
FY18 - 30 FORCAST: i.magaimg.net
- assumed tax rate of 28%
- assumed growth maintained for short term, with stabilisation and decrease in beta
- assumed gross margins around 29%
- outstanding shares assumed 960
FY18-20 looks to maintain the streak of negative free cash flows, yet with positive growth and promising EPS, with an eventual EPS of 1.33 in FY30 @ 1,227 NET INCOME.
Model:
Forward term growth @ 2%
Basic Weighted Average Cost of Capital @ 5,2%
NPV: $23,444.09
Less cash holdings, (210)
NETNPV, (Enterprise VALUE): $23,234.09
/952
= Forward Market Price = $24.42
This coincides with multiple other analyst comments, specifically Hans Mosesmann upgraded Rosenblatt's rating from $22 to $27.

UndervaluedAfter Q4E Reverse DCF models increased fair value from 5.46/7.45 - 5.93-7.71 suggesting stock is now 107-169% undervalued. Price to PeL is now 277% >current. Revenue has increased 31% YoY and 30% QoQ.
Symmetrical pattern is neutral until decisive breakout.
