DeepSeek Smuggles Nvidia (NASDAQ: $NVDA) Chips for AI ModelChinese AI startup DeepSeek is reportedly building its next major artificial intelligence model using thousands of Nvidia (NASDAQ: NVDA) Blackwell-generation GPUs that were smuggled into China, according to a detailed investigation by The Information. These chips, among Nvidia’s most advanced AI accelerators, are restricted under U.S. export controls, making them unavailable to Chinese buyers through legal channels.
The report highlights a sophisticated smuggling operation in which servers equipped with Blackwell chips were initially shipped to data centers in countries not affected by U.S. restrictions. The servers were then dismantled, and their components imported into China in pieces, bypassing regulatory scrutiny. Most Nvidia chips are produced in Taiwan and distributed globally through a network of intermediaries, creating gaps that can be exploited.
For DeepSeek, access to the Blackwell architecture provides a significant performance advantage. It enables faster training times, larger models, and superior inference efficiency—critical factors in the global AI race. Despite Beijing’s aggressive support for domestic semiconductor advancement, Chinese-made AI chips still trail Nvidia’s top-tier performance, according to executives from Chinese AI companies.
Nvidia, responding to the allegations, stated that it has not seen evidence of “phantom data centers” being constructed and dismantled to disguise smuggling routes, though the company emphasized that it investigates any credible tip it receives.
Technical Analysis
NVDA’s price action remains in a broad structural uptrend, despite recent volatility. The stock is currently trading near $185, just below its shorter-term moving average. A critical resistance zone lies around $212, marked by the previous swing high. A breakout above this level could resume the macro uptrend, potentially targeting new all-time highs.
If price fails to reclaim momentum, downside support sits around $170, where significant demand previously pushed price higher. A deeper correction could revisit the $145 liquidity zone, aligning with historical consolidation. Overall, NVDA remains technically strong, but sensitive to geopolitical and regulatory headlines.
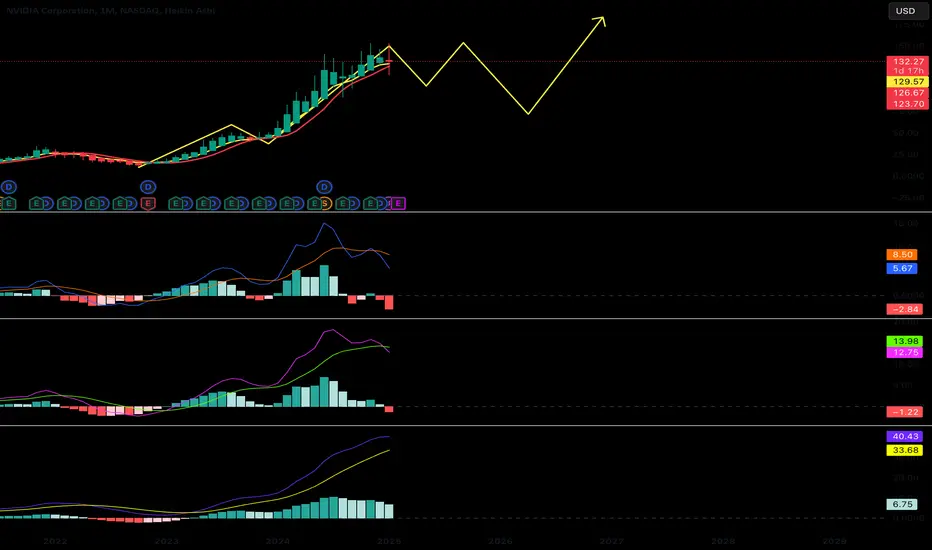
Deepseek

High 80s soon and will it rally towards 200?After a long break its back again with AI, self-driving software and much more. This can go down to high 80s in the near term. I think next year this can hit low 200s. All the best!!
Not a financial advice.

Ai Analyse EURUSD M15: Tracking the Liquidity Sweep ReversalHello everyone, a quick update on our EURUSD M15 trade setup. Our AI-driven system has pinpointed a classic Liquidity Sweep Reversal (LSR) setup, suggesting a high-probability bullish move is on the horizon.
The Action: OANDA:EURUSD
The market made a clear push down, taking out the low at 1.17304. This "sweep" of liquidity has been met with a powerful bullish rejection, with the most recent candle closing strong and reversing the prior momentum. This price action indicates that sellers have been trapped, and we expect an upward continuation.
The Plan:
We are waiting for confirmation of this reversal with a BUYSTOP order.
Symbol: OANDA:EURUSD
Time Frame: M15
Order Type: BUYSTOP
Entry: 1.17390
Stop Loss: 1.17290
Take Profit: 1.17590
This setup is aligned with our AI's analysis of real-time market data, and we're looking forward to tracking its progress.
Disclaimer: This is not financial advice. Trade at your own risk.

Ai Analysis EURUSD : Price Targets and Bullish MomentumOur AI's analysis, which utilizes real market data, continues to track the bullish momentum on EURUSD. As the price moves in our favor, we have updated our take profit targets to reflect the current market structure.
This trading setup is based on the LSR (Liquidity Sweep & Reversal) strategy, a powerful concept in which a brief price movement is used to clear out a cluster of orders before a strong reversal in the opposite direction. Our AI successfully identified this key reversal point, allowing us to position ourselves to capitalize on the subsequent upward move.
Entry: 1.17950
Stop Loss (SL): 1.17800
Take Profit (TP) Levels:
TP1: 1.17983
TP2: 1.18035 (At this level, we will move our Stop Loss to the entry price to secure the trade)
TP3: 1.18150
We are now actively tracing this trade, managing it according to our predefined plan to maximize potential gains while protecting our capital.

Using AI to Spot the PERFECT XAU/USD Entry Point Live TradingHello everyone! We just locked in a fantastic sniper entry on Gold (XAUUSD) using our AI trading system. While Gold has been in a strong uptrend, our AI, which analyzes real-time OHLC market data (not just static images), identified a high-probability counter-trend sell setup.
The system provided a precise Sell Limit entry, allowing for a sharp, low-risk execution. This highlights the power of using AI to find opportunities that are often missed by conventional analysis.
A huge reminder: even with a powerful tool like AI, strict risk and money management are non-negotiable!
Stay disciplined and happy trading!
All of the information provided is for educational and informational purposes only and is not intended as financial advice. Trading involves significant risk, and past performance is not a guarantee of future results. It is essential to conduct your own research and manage your risk diligently.

2025 Market Outlook - Cautiously Bullish (Important Bar Counts)Hey Everybody,
Thanks for checking out the video. I'm reviewing all major instruments, US and Non US.
US has carried the financial markets since 2020 and 2022 and this year out of the gate we're seeing big runs in "uninvestable" spaces like Europe and China. I say that jokingly because of how bad everything thought non US assets were, but here we are watching DAX, FTSE, and HSI running to double digit gains while the US lags behind.
Will the US catch up and the global economy tide rise to lift all boats or are we truly seeing a catch up trade that will have headwinds uncertainties a plenty? Time will tell.
This week is a holiday shortened trading week, RBA and RBNZ expected to cut rates, Europe and US printing PMI on Friday. BABA and BIDU earnings this week (China related), and NVDA earnings next week (#2 market cap in US).
I discuss the big bar counts that I'm watching closely on SPY, SPX, XSP, RSP, NDX, QQQ, DIA, NVDA, META, NFLX, and others that I believe technically will matter for limited upside momentum without a bigger pause, snapback or correction ahead.
Cautiously optimistic is a perfect play for 2025. I'm off to a good start for the year and intend to keep that way without chasing or doing anything silly.
Thank for watching.

CHINA’S TECH SURGE—AI HYPE, HOT MONEY, AND LINGERING DOUBTSCHINA’S TECH SURGE—AI HYPE, HOT MONEY, AND LINGERING DOUBTS
(1/9)
Big News: China’s tech sector is on fire 🔥📈 in 2025, driven by AI breakthroughs and a softer regulatory vibe from Beijing. Hong Kong’s Hang Seng Index is up 13% YTD, outpacing the S&P 500 (+4%). Is this a tech golden age or a speculative bubble? Let’s break it down! 🚀
(2/9) – STOCKS IN FOCUS
• Alibaba: +50% (Hong Kong) 💥
• Xiaomi: +35% 📱
• Baidu: +30% 🔍
• BYD: +25% 🚗
The Hang Seng Tech Index has soared 30% since mid-January, hitting a 3-year high 🎉. Trading volumes are through the roof!
(3/9) – WHY THE SURGE?
• DeepSeek’s cost-effective AI model sparks global buzz 🤖
• Alibaba’s AI partnership with Apple + Jack Ma’s reappearance with Xi Jinping 🇨🇳
• Beijing hints at easing its tech crackdown, boosting investor confidence 💸
(4/9) – ‘HOT MONEY’ DRIVING THE RALLY
• Speculative capital—“hot money”—from hedge funds and retail traders fuels the boom 💨
• Trading volumes spike, but big institutional investors (pension funds, etc.) stay cautious 🧐
• Analysts warn: Momentum, not fundamentals, is driving this rally 📉
(5/9) – AI BREAKTHROUGHS: REAL OR HYPE?
• DeepSeek’s AI model hailed as a game-changer, but details are thin 🤔
• Social media buzz calls it a “bull market” for Chinese tech 🐂
• Critics say it’s more sentiment than substance—China’s history of overpromising looms large ⚠️
(6/9) – REGULATORY REPRIEVE OR TEMPORARY TRUCE?
• Xi Jinping meets tech leaders, signaling a thaw after years of crackdowns 🏛️
• Investors scour photos for clues—Alibaba and Tencent back in favor? 📸
• Skeptics question if it’s a genuine shift or a short-term tactic to prop up the economy 😬
(7/9) – RISKS VS. REWARDS
• Risks: Geopolitical tensions, trade tariffs, and competition from Western tech (e.g., Nvidia’s $589B drop) 🌍
• Rewards: If AI delivers and Beijing stays supportive, Chinese tech could dominate globally 🌟
• The rally’s fate hinges on sustainability—will the gains stick? 🤝
(8/9) – Will China’s tech surge last?
1️⃣ Yes—AI and policy shifts will fuel a new golden age.
2️⃣ Maybe—Short-term gains, but long-term doubts remain.
3️⃣ No—Speculative bubble will burst soon.
Vote below! 🗳️👇
(9/9) – FINAL TAKEAWAY
China’s tech rally is a wild ride 🌍—AI hype, “hot money,” and a regulatory truce are driving stocks sky-high. But with big investors on the sidelines and risks aplenty, it’s a fragile boom. Will Beijing and AI deliver, or is this another fleeting frenzy? Stay tuned! 💪

China stocks ready to go? #DeepSeek another reason..This is a chart of the benchmark index for Hong Kong - HK50
It's up on Monday, while Nvidia is down 10+%
If funds are flowing out of Nvidia - China (home of DeepSeek) could be one place they end up.
The Hang Seng is a perfect example of how long a trend can take to reverse.
How many times would traders have tried to go long this index only to see it slump right back towards the bottom?
Now while this trend reversal might be delayed further - and might fail altogether - we think there is enough evidence to suggest a reversal is happening.
The price is above a rising weekly 30 week SMA
A long term trendline has broken
Crucially - the price made a double bottom pattern around 15,000
DAILY CHART
On the daily chart we see the strong surge in buying interest from September has given way to a long multi-month correction.
We are looking for a breakout above the down trendline to demonstrate the correction has finished and a new up-leg is beginning.
The final confirmation would come from a break of resistance (not drawn) from the November and December highs at 21,350.
Should the price turn lower and make a new fractal low under 19,650 then we’ll have to wait a bit longer for the Hang Seng trend reversal.
But - as always - that’s just how the team and I are seeing things, what do you think?
Share your ideas with us - OR - send us a request!

Inflation Fears Weigh More than China Tech GainsDeepSeek Is Not the Market’s Biggest Concern
Over the past few days following the emergence of DeepSeek, Nasdaq or technology stocks have experienced a notable 6% decline across all major U.S. indices. However, this recent pullback pales in comparison to the more substantial drop seen in December.
Small-Cap Stocks Take a Bigger Hit
The Russell 2000, which tracks small and medium-sized enterprises in the U.S., suffered an even sharper decline, falling by 12%. This suggests that broader economic concerns, beyond just the tech sector, are weighing on investor sentiment.
Then, What Is It?
On December 18, during the highly anticipated Federal Open Market Committee (FOMC) meeting, the Federal Reserve announced a widely expected 0.25% rate cut, bringing the Fed Funds Rate down to 4.5%. However, it wasn’t the rate cut that rattled the market—it was Fed Chair Jerome Powell’s comments that followed.
“… the median participant projected that the appropriate level of the federal funds rate would be 3.9% at the end of 2025, indicating expectations of two additional rate cuts in 2025, down from the four projected in the previous summary.”
This statement signaled that the Fed remains hawkish on inflation, with expectations of only two rate cuts in 2025 instead of the previously projected four. As a result, borrowing costs are likely to remain elevated at around 3.9%, a scenario that investors had not fully priced in. The market reacted negatively, with indices falling sharply over the subsequent weeks.
Market Stabilization Amid China Tech Competition
Despite the recent downturn, there are signs of stabilization, with major indices still maintaining their position along an established uptrend line. As long as inflation continues to ease—hovering around 3% or, ideally, heading toward the Fed’s 2% target—the broader market outlook remains positive.
From a strategic standpoint, I will continue to focus on buying dips if the market respects the uptrend line. However, if hopes for rate cuts in 2025 fade and the trend begins to break below key support levels, my strategy will shift toward selling into strength when opportunities arise.
Short-Term Trading Outlook
To refine my trading decisions, I have also drawn trendlines on an hourly chart. Applying the same uptrend principles, these lines serve as a guideline for short-term trading in the Micro S&P 500 futures.
With the latest January Consumer Price Index (CPI) reading at 3%—higher than expected—I will be closely monitoring my daily chart's uptrend line.
While external economic conditions remain unpredictable, adapting trading strategies in response to market trends is key to staying ahead.
Please see the following disclaimer and information that you may find useful:
E-mini S&P 500 Futures & Options
Ticker: ES
Minimum fluctuation:
0.25 index points = $12.50
Micro E-mini S&P 500 Futures & Options
Ticker: MES
Minimum fluctuation:
0.25 index points = $1.25
Disclaimer:
• What presented here is not a recommendation, please consult your licensed broker.
• My mission is to create lateral thinking skills for every investor and trader, knowing when to take a calculated risk with market uncertainty and a bolder risk when opportunity arises.
Trading competition: www.tradingview.com
Trading the Micro: www.cmegroup.com
CME Real-time Market Data help identify trading set-ups in real-time and express my market views. If you have futures in your trading portfolio, you can check out on CME Group data plans available that suit your trading needs www.tradingview.com

DeepSeek Is Not What the Market FearsWith the emergence of DeepSeek, tech stocks have generally dropped by 6% over these few short days across all US indices, but from the peak in late November to December, we saw a much more massive drop among all of them.
The Russell 2000, representing small and medium-sized enterprises in the U.S., declined by 12%,
What triggered this sell-off in the tech giants (Nasdaq), the old guards (Dow Jones), the suite of blue-chip stocks (S&P 500), and the medium-sized firms (Russell 2000)?
Markets are inter-connected. What should we be looking out for, and how should we navigate if the market break below this recent all-time low?
E-mini S&P 500 Futures & Options
Ticker: ES
Minimum fluctuation:
0.25 index points = $12.50
Micro E-mini S&P 500 Futures & Options
Ticker: MES
Minimum fluctuation:
0.25 index points = $1.25
Disclaimer:
• What presented here is not a recommendation, please consult your licensed broker.
• Our mission is to create lateral thinking skills for every investor and trader, knowing when to take a calculated risk with market uncertainty and a bolder risk when opportunity arises.
Trading competition: www.tradingview.com
Trading the Micro: www.cmegroup.com
CME Real-time Market Data help identify trading set-ups in real-time and express my market views. If you have futures in your trading portfolio, you can check out on CME Group data plans available that suit your trading needs www.tradingview.com

Oh no! SHORT TERM BEARISH- BACK TO 116 AT LEAST. $NVDA SELL NOW!A dead cat bounce refers to a temporary, short-lived recovery in the price of a falling stock. The term comes from the notion that even a dead cat will bounce if it falls from a great height. It is also commonly used to describe any situation where something experiences a brief comeback during or after a significant decline. This phenomenon is sometimes called a "sucker rally."
- Breakdown of the rising wedge pattern.
- SMA 20 & 50 are coming down
- Tariff wars with China and other countries
- Deepseek Shock/ Tech Shocks aka Al Black Monday on
- High inflation (Fed NOT "in a hurry" to push more rate cuts)
- Volume is decresing while price is increasing too fast.
- NASDAQ:SOXX shows weakness
Hopefully, NVDA holds at $116. Otherwise, it might gap down to fill at $95.
Advise selling now and purchasing again at a lower price.


NVIDIA (NVDA) - Failed Bear Flag, Bullish Reversal in Play📉 Failed Bear Flag Pattern
NVDA initially formed a bear flag, with a strong downward flagpole followed by consolidation in an upward-sloping channel. However, instead of breaking down as expected, the price reversed at the lower boundary, signaling bulls absorbing selling pressure.
📈 Breakout Potential
The recent impulse move out of the flag formation aligns with a Wave 1 breakout, confirming a potential bullish trend. If the Wave 2 retracement holds above previous lows, NVDA could see a strong Wave 3 rally towards $130-$140.
🔍 Key Resistance & Confirmation Levels
Immediate resistance around $122-$124 (previous highs & bear flag upper boundary). A break above $124 with volume could trigger further bullish momentum. Downside risk remains if NVDA re-enters the bear flag below $115.
🚀 Bullish Bias Unless Invalidated
Given the failed bear flag breakdown and Elliott Wave structure, the bias shifts bullish towards higher highs. Watch for strong follow-through on Wave 3 to confirm this setup.
📊 Trade Plan:
Entry: On pullbacks above $118-$120
Target: $130-$145
Stop: Below $115
💡 Let me know your thoughts! Do you agree with this bullish outlook?
Don't forget,
Patience is Paramount.

Bitcoin - Bitcoin lost $100,000?!Bitcoin is trading below the EMA50 and EMA200 on the four-hour timeframe and is trading in its descending channel. Bitcoin’s upward correction and its placement in the supply zone will allow us to resell it. It should be noted that there is a possibility of heavy fluctuations and shadows due to the movement of whales in the market and capital management in the cryptocurrency market will be more important. If the downward trend continues, we can buy in the demand range.
In the past trading week, spot Bitcoin ETFs saw an inflow of $560 million, though this represents a significant decline compared to the previous two weeks. Meanwhile, as of January 31, 2025, U.S. spot Ethereum ETFs recorded a minor outflow of $45 million, though this decline was not particularly drastic.
At the same time, Standard Chartered Bank has advised investors in a new research note to view Bitcoin’s drop below $100,000 and the over 6% single-day decline in the crypto market as a buying opportunity. Jeff Kendrick, Head of Digital Asset Research at Standard Chartered, stated: “Hope is not a strategy.” He further explained: “When hope disappears, digital asset prices tend to fall by 10% to 20%.”
Despite recent market volatility, Standard Chartered remains optimistic about Bitcoin’s price trajectory in 2025. The bank’s research suggests that growing institutional interest could accelerate Bitcoin’s potential surge to $200,000 by the end of the year.
Last week, Donald Trump fulfilled two key promises to the crypto industry:
1. Granting clemency to Ross Ulbricht, the founder of Silk Road, who is regarded as a symbolic figure among Bitcoin and libertarian communities.
2.Signing an executive order on cryptocurrencies, which aims to enhance regulatory transparency for digital assets, promote stablecoins, prevent the debanking of the crypto sector, and ban the creation of a Central Bank Digital Currency (CBDC).
In parallel, Jeff Kendrick of Standard Chartered also warned investors to pay close attention to altcoins, referring to cryptocurrencies other than Bitcoin that are expected to experience significant growth in the coming year. He stated: “As soon as we enter the second phase, in my view, the altcoin season will begin.” Kendrick further noted that institutional flows will primarily drive Bitcoin and Ethereum investments, partially offsetting the rotation into altcoins.
Responding to the growing interest in Bitcoin and Solana, MetaMask is planning to expand beyond Ethereum. The company is currently working on integrating Bitcoin functionality while simultaneously exploring decentralized finance (DeFi) opportunities across multiple blockchain ecosystems.
Meanwhile, Texas Lieutenant Governor Dan Patrick has identified the establishment of a state Bitcoin reserve as a top priority for 2025. Texas, already a pioneer in adopting Bitcoin at the state level, continues on this path despite challenges at the national level.
If the proposal is approved, Texas will become the first U.S. state to hold Bitcoin as a financial reserve on its balance sheet, a move that could accelerate Bitcoin adoption within the U.S. financial system.

Big move coming ahead for MEGL - stay tuned!!
Magic Empire Global Ltd. engages in the provision of corporate finance advisory and underwriting services. It offers sponsorship, financial advisory, compliance advisory, and underwriting and corporate services.

Is NVDA's $600 Billion Drop Due to DeepSeek?Is NVDA's $600 Billion Drop Due to DeepSeek?
From my observation, the answer is no. NVIDIA had been experiencing continuous breakout growth for several months, reaching a double-top peak at the same time the AI wave was at its strongest. This led to the company's valuation multiplying several times from its lows.
The $140+ range was around the peak valuation for NVDA. Therefore, in the next few months, a correction below $100 is inevitable. Even without DeepSeek, a similar event would have triggered this correction, as it is a natural phase for a company that has experienced such rapid and sustained growth. Framing it as an AI-driven narrative simply makes the situation more convincing.
Looking at the chart, NVDA will likely top out, correct downward to form a bottom, then rebound to a new high before the larger 3M cycle correction begins.
The West Innovates, but China COPY/PASTES Better...From Instagram/Youtube to Tik-Tok
From OpenAI (closed AI) to China Free AI ...
''🇨🇳📋 China Doesn't Just Copy, They Paste Better! 🚀🤖''
What Just Happened?
The DeepSeek AI shockwave just sent the US stock market into panic mode – wiping out hundreds of billions in value.
Here’s the breakdown:
DeepSeek, a Chinese AI company, built a ChatGPT rival using a fraction of the resources.
They optimized their software rather than relying on NVIDIA’s expensive GPUs.
NVIDIA lost $500B in market cap, as investors realized brute-force AI computing might not be the future.
The US market tanked as the news spread – another case of China disrupting American tech.
This isn't the first time we’ve seen this play out…
China’s Playbook: Innovation Through “Pasting”
We’ve seen this before:
'US Innovation' vs 'China’s “Better Cheaper” Version'
Facebook / Instagram WeChat / Xiaohongshu
YouTube Shorts Douyin (TikTok in China)
Google Search Baidu
ChatGPT (OpenAI) DeepSeek AI
The pattern is simple: China doesn’t just copy – they optimize, scale, and outcompete. The US responds by banning them.
And guess what? The ban playbook is coming back.
OpenAI vs. China – The “Copy-Paste” Battle
China isn’t just building ChatGPT clones – they’re making them free. DeepSeek AI is disrupting the AI race by offering competitive models at a fraction of the cost.
TikTok destroyed Instagram Reels & YouTube Shorts → US tried to ban it.
DeepSeek AI is now outperforming OpenAI on efficiency → What’s next?
If history repeats itself, expect the US to start "national security" concerns about Chinese AI models soon. But the real reason? China is winning the innovation war.
My Take: The Real Reason Behind “Free” AI
Nothing in China is truly free. If they’re offering cutting-edge AI for nothing, the real cost is your data, ideas, and innovation.
They’re not just training AI – they’re training on global users.
By offering AI for free, they gather intelligence on how people build, create, and think.
This isn’t just about AI models – it’s about controlling the future of tech.
The US stock market just realized this, and so should you.
🚀 Watch how NVIDIA, OpenAI, and US regulators react in the coming weeks. A ban may be inevitable.
One Love,
The FXPROFESSOR 💙
ps. I am for sure NOT taking my AI innovation on a 'free- copy/paste is ok' place/ NOT Happening.

GBP/USD Resistance Rejection and Bearish OutlookGBP/USD is a forex pair representing the British Pound against the US Dollar. The current price is 1.24150, and the target price is 1.21000, indicating an expected decline. This suggests a bearish outlook, with a potential gain of 300+ pips if the price moves as anticipated. The analysis is based on support and resistance levels, key technical indicators in forex trading. The price is currently facing strong resistance, leading to a rejection at this level. A rejection from resistance often signals selling pressure, pushing prices downward. Traders expect the price to drop toward the next support level at 1.21000. The setup aligns with technical analysis, where resistance acts as a ceiling for price movements. If the resistance holds, further bearish momentum could drive the price lower. Risk management is essential, as price movements can be unpredictable.

Nvidia could still be seriously overvaluedIf the release of DeepSeek's AI models really is as disruptive as some suspect, Nvidia bulls could be seriously questioning if they want to hold onto the stock for the long haul. And that means some bulls could be looking to offload into a bounce while bears seek to fade into them. I highlight some key levels for bears to keep an eye on.
Matt Simpson, Market Analyst City Index and Forex.com

NVIDIA Retesting The Resistance! Sell!
Hello,Traders!
NVIDIA gapped down massively
On the DeepSeek news and
Went further down after the
Opening, but then a gap closing
Move started and the price is now
Retesting the horizontal resistance
Around 130/132$ which also
Happens to be the gap's opening
Level so based on technical analysis
We might be expecting a local
Bearish pullback from the resistance
Sell!
Comment and subscribe to help us grow!
Check out other forecasts below too!

DeepSeek AI | TechStocks Crash | NVIDIA down -17%On Monday (yesterday), Wall Street reacted wildly with the release of Chinese AI app DeepSeek.
Throughout the day, roughly 1 Trillion US Dollars was wiped from the stock market, largely from chip and tech stocks suck as Nvidia which caused a larger sell-off.
OpenAI CEO Sam Altman called it an "impressive model" and POTUS Donald Trump said that it should be a "wakeup call for our industries".
The bright side of this, is that there can be some excellent entry points found across the market after the sell-off.
_______________
NASDAQ:NVDA

Nvidia's Largest Single-Day Decline and Its ImplicationsNvidia Experienced Its Largest Single-Day Decline on 27th Jan, tumbled 17%, erasing USD589B from its market capitalisation, it was the biggest in the US stock market history.
What will be the implications?
Last month, we discussed how the Nasdaq reached and responded well to the upper band of its parallel channel.
Nvidia being one of the largest market cap stocks in Nasdaq. What will be Nasdaq’s performance like for the rest of the year?
Let’s explore how we can include fundamental analysis to make sense of the situation.
Micro E-Mini Nasdaq-100 Index Futures & Options
Ticker: MNQ
Minimum fluctuation:
0.25 index points = $0.50
Disclaimer:
• What presented here is not a recommendation, please consult your licensed broker.
• Our mission is to create lateral thinking skills for every investor and trader, knowing when to take a calculated risk with market uncertainty and a bolder risk when opportunity arises.
CME Real-time Market Data help identify trading set-ups in real-time and express my market views. If you have futures in your trading portfolio, you can check out on CME Group data plans available that suit your trading needs www.tradingview.com

It Appears as though the Bullish Wedge is our most probable playTrading Fam,
Time for my weekly update on the Bitcoin. A lot has occurred in the last week or so since I updated you all last, not least of which includes Deepseek AI FUD causing panic in the GPU and Power stock plays which has spilled over into our crypto space. But does this panic have merit or is this simply another retail bait, shaking out paper hands while whales continue to buy? The charts are showing me the latter is most probably true and news seems to support my thesis here as Michael Saylor and MicroStrategy acquired another 10,107 Bitcoin on the 26th of Jan.
Previously, you will remember that I had spotted a potential H&S on the charts and had posted a caution in this regard as it had potential to play out.
Shortly thereafter, I also spotted this bullish pendant at which point my bias became conflicted. Was Bitcoin going to pop or was it going to drop? We had to wait and observe further price action before it became clear.
It now looks like our bulls maintained the greatest strength as we bounced off or our neckline, and broke up above our bullish wedge, hitting resistance at 106K. We then formed another bullish pennant smaller in size, dropped from that quickly to perfectly retest the topside of our larger bullish pennant, and then came back inside the wedge for further consolidation.
If I am reading this chart correctly, our greatest probability now lies with the bulls breaking to the upside of the smaller wedge and retesting that 106K resistance level again. In time, I believe we'll break 106k to the upside and continue towards our target of 140k.
Why 140k?
When we broke above our bullish descending channel in Oct. of last year, we continued up until we hit a new high at 109k. This was our local top. We can now measure the distance from that break up (around 68k) to our new high at 109k. This same distance can be utiliized to give us a new target from our bullish wedge breakout. This fractal gives us a reasonable target of around 140k.
Hope this makes sense.
✌️Stew
