DEX 30 - Forecast🕰 Weekly
Sitting right on top of that weekly demand (22,700–23,200). Buyers are trying to defend, but if this floor gives way, we’re diving deeper. BOS is still intact from the upside, but momentum looks tired.
📉 Daily
Heavy drop straight into demand. Now the real question → do we bounce back into 23,700–24,000 supply for a cheeky rejection… or do we crack lower straight away? 👀
⏱ 8H
Clean ChoCH to the downside. Market tapped demand, so a little relief rally is on the cards. But watch that supply zone — sellers waiting up there with bags packed.
🎯 Outlook
Short-term → bounce into supply ✅
Mid-term → bearish pressure still in control 🔻
Lose 22,700 and we could easily hunt liquidity towards 22,000–22,300.
Bias : Short-term pullback → Mid-term bearish
Demand Zone

A new Demand zone in a making time for longs ETHUSDT Demand and Supply, time for longs.
market has make new demand zone now time for upside ETHUSDT

EURGBP – Battleground of Supply and Demand!EURGBP has been trading between clear supply and demand zones ⚖️, respecting both ends of the range.
After rejecting the 0.8750 supply zone, price turned lower, showing that sellers remain in control. Currently, EURGBP is hovering around the 0.8620 – 0.8640 demand zone, where buyers previously stepped in.
This area forms an important decision point 🔑:
- If demand holds, we could see a bounce back toward mid-range levels.
- If broken, a continuation lower would confirm supply’s dominance 📉.
Patience here is key ⏳ — waiting for confirmation at these zones can help filter out false moves and set up a cleaner trade.
⚠️ Disclaimer: This is not financial advice. Always do your own research and manage risk properly.
📚 Always follow your trading plan regarding entry, risk management, and trade management.
Good luck!
All Strategies Are Good; If Managed Properly!
~Richard Nasr

EUR/USD - Trade Idea (Forecast Linked)🕰 Weekly View
Price is pushing away from major support at 1.14–1.15 and climbing into the 1.18–1.20 resistance zone. Weekly structure still favors upside momentum while support holds.
📉 Daily Structure
Resistance: 1.18–1.20 strong supply.
Support : 1.16–1.17 demand , with deeper discount demand sitting at 1.15–1.16.
Daily price action shows liquidity being swept both sides before a push higher.
⏱ 8H Breakdown
Price is reacting from unmitigated demand around 1.16–1.17. A wedge breakout is sending price toward resistance at 1.18–1.20. If rejected, look for retrace back into discount demand (1.15–1.16) before continuation.
🔎 Outlook
Scenario 1 → Sweep into 1.18–1.20 supply → retrace back into 1.15–1.16 discount demand → continuation higher.
Scenario 2 → Clean breakout above 1.20 accelerates toward 1.22+.
Bias : Short-term reaction lower possible → mid-term bullish continuation.

EUR/USD - Moving into Buy movements🕰 Monthly View
Price is breaking out of the major support/resistance zone around 1.18–1.20 after years of compression. Historically, this level has acted as a turning point, and now momentum favors the upside. MACD confirms strength with a bullish cross, pointing to continuation.
📉 Weekly Structure
Resistance: Cleared at 1.20, room to expand higher.
Support: 1.10–1.12 base holds as long-term demand.
Macro structure now looks like a sustained breakout phase.
⏱ Daily / Lower-Timeframe Perspective
Price has been steadily pressing higher without significant supply above. The clean breakout above 1.18 suggests little resistance until much higher levels, leaving upside open.
🔎 Outlook
Bullish momentum dominates. As long as price holds above 1.18, continuation toward 1.30+ becomes likely. MACD divergence that held the downside has now shifted, fueling the upside breakout.
Bias : Strong bullish continuation → mid-to-long term upside toward 1.30+.

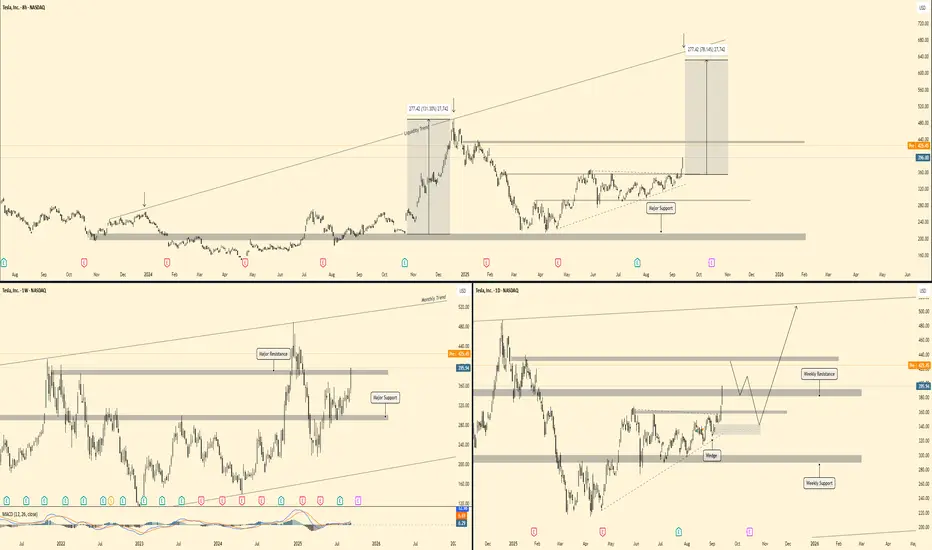
Tesla - Forecast (Before and After)🕰 Weekly View
Price is holding above major support at 325–340 and pushing into weekly resistance around 420–440. The broader monthly trend points higher, with upside liquidity aligned toward the 500–520 zone.
📉 Daily Structure
Resistance: 420–440 supply zone.
Support: 325–340 demand zone, with a secondary base near 280.
Price has broken from a wedge formation and is now testing overhead supply, with potential to retest support before continuation.
⏱ 8H Breakdown
Tesla has been trending steadily upward off major support. Clean structure shows momentum building. A breakout and retest scenario could drive price toward 500+ targets, while failure at 420–440 could cause a pullback into 360–380 support.
🔎 Outlook
Scenario 1 → Retest support (360–380) before continuation higher.
Scenario 2 → Clean breakout above 440 accelerates into 500–520 zone.
Bias : Bullish continuation → mid-term target 500+.
NZD/USD - Forecast🕰 Weekly View
Price is still respecting the monthly downtrend. Strong support sits lower at 0.55–0.56, but as long as price stays above recent structure, buyers could defend. Weekly imbalance still unfilled above.
📉 Daily Structure
Resistance: 0.61–0.62 (no clear supply above until that zone).
Support: 0.58–0.59 demand block.
Currently ranging mid-structure, building a base for the next push.
⏱ 4H Breakdown
Price is holding an 8H demand zone at 0.59 and has built a buyer level there. Short-term resistance sits near 0.61, where rejection could send us back to retest 0.59 before continuation.
🔎 Outlook
Scenario 1 → Retest 0.59 demand, then push into 0.61–0.62 supply.
Scenario 2 → Failure to hold 0.59 leads to deeper move into 0.56 strong support.
Bias: Pullback into demand → bullish continuation toward 0.61–0.62.

USD/CHF - Forecast 🕰 Weekly View
Price remains under the weekly downtrend, with structure holding below new resistance at 0.84. Market continues to respect the wedge pattern, with downside pressure aiming toward 0.78–0.79 weekly demand.
📉 Daily Structure
Resistance: 0.82–0.84 supply block.
Support: 0.78–0.79 demand zone.
Price is stuck in compression — either we sweep into resistance for rejection lower, or break above wedge to shift momentum bullish.
⏱ 4H Breakdown
Price is consolidating inside a wedge formation. Overhead resistance sits at 0.80–0.805, while a clean break below wedge support opens the door toward 0.79–0.788 demand.
🔎 Outlook
Bias remains bearish while under 0.82 resistance, with potential pullback into 0.79 demand. However, a breakout above 0.82–0.84 could flip structure bullish.
Bias: Bearish pressure → mid-term bearish unless breakout above 0.82–0.84.

NZDUSD Demand Zone SetupThis is a high probability trade if prices comes down as it broke a significant trendline with a change in structure

MEDS - rebound from supply area IDX:MEDS
In terms of trend, it's starting to move from sideways to an uptrend. The structure that's forming looks pretty solid, with the supply area that was previously broken now successfully turning into a demand area, as shown by the stock price rebounding in that area.
For the 1-hour intraday timeframe, there's also a golden cross happening between the 10 and 20 SMA.
Buying Area: Feel free to buy near the 3, 5, or 10 MA.
For Stoploss, if it can’t hold above the demand area below.
This trade plan has a Risk:Reward ratio of 1:2.56.That makes this stock pretty interesting to trade.

USDCAD bearish possibility There are a two bottom liquidity's not sweep, so it's mean the price should go down to sweep their liquidity . Also maybe we will have a head & shoulder pattern
Also, when the price going to sweep liquidity, there is FVG that must be visited, which confirms the process of liquidity sweep.
Let's see what will happen, and will update later

GBPUSD MARKET KEY RESISTANCE READ CAPTIONhi trader's
GBPUSD Price is currently trading between the resistance zones (1.34473 – 1.35522) and the demand zone (1.32676).
If price fails to break resistance, it may retrace back toward the demand zone.
A breakout above resistance could open the way for bullish continuation.
This shows the market is in a range-bound structure, where both buyers and sellers are active
For more live forex setups and daily chart analysis, follow my profile to stay updated

AUDCHF Demand ZoneAUDCHF has been in an uptrend and has formed a demand zone.
This zone has been tested once and we rallied.
Hopefully we can get another retest followed by a rally.
This is a ltf trade so please only risk 0.5% on this trade.

EURNZD Demand ZoneEURNZD has been bullish and it formed a demand zone
We are waiting to come down to this demand zone and go up

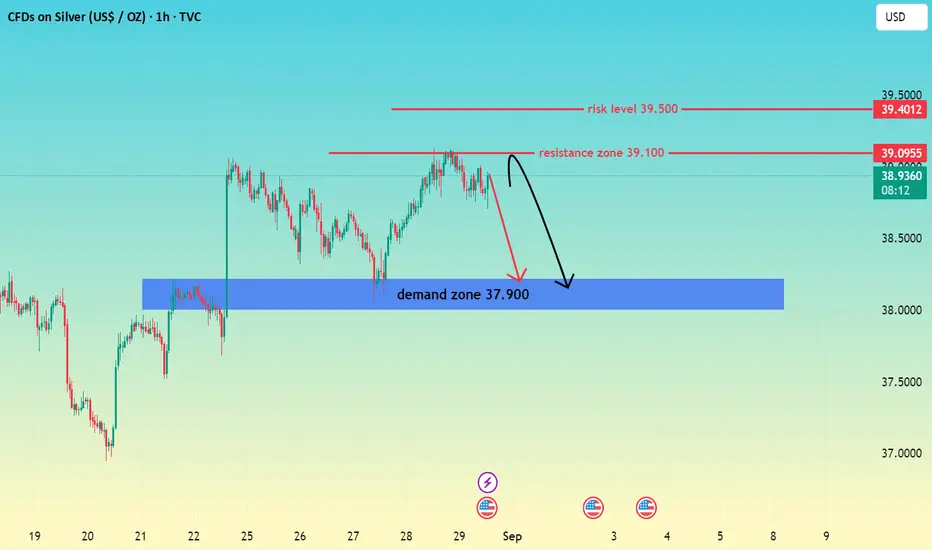
SILVER AT RESISTANCE ZONE-READ CAPTIONHi trade's
Silver price is currently approaching the resistance zone near 39.100, while the risk level remains at 39.500.
If price respects this resistance, we may see a rejection and a move back toward the demand zone at 37.900.
However, if buyers push above 39.500, the bearish setup becomes invalid.
This setup highlights a short opportunity from resistance with demand zone as the key target. Risk management is crucial, as a breakout above 39.500 may shift the trend
Resistance 39.100
Demand 37.900
Risk 39.500
BTC Bulls Make a Stand at Key Demand Zone | Is a Reversal ImmineChart: BTCUSDT, 1H
Bias: Neutral to Short-Term Bullish
Analysis:
Hello, traders! Here's a look at the current BTCUSDT price action, which finds itself at a critical juncture.
The Bearish Context (Macro):
For the past several days, Bitcoin has been in a clear and structured downtrend. This is confirmed by:
A strong rejection from the "Perfect Sell Zone 1" around the $122,000 - $120,000 level.
A series of lower lows and lower highs.
Multiple breaks of structure (marked as "Strong" lows being broken) to the downside, confirming bearish momentum is in control.
The Bullish Reaction (Micro):
Despite the strong bearish trend, the price has now entered a significant "Perfect Buy Zone 1" between approximately $111,500 and $108,500. We are seeing a very aggressive reaction from this area:
A massive bullish engulfing candle has formed, showing that buyers have stepped in with force.
This push has resulted in a minor break of structure to the upside (the latest "Break" label), which could be interpreted as a Change of Character (CHoCH). This is the first potential sign that the short-term bearish momentum is weakening.
Potential Scenarios & Key Levels :
Bullish Reversal / Pullback: If the bulls maintain control, the immediate target would be the previous support levels, which may now act as resistance.
TP 1: $114,400 (Fibonacci 0.786 level)
TP 2: $115,700 (Recent consolidation area)
TP 3: $116,875 (Fibonacci 0.618 level)
An ideal entry for a long position could be on a successful retest of the recently broken resistance around $112,800.
Bearish Continuation: If this bullish push is merely a liquidity grab and fails to hold, a break below the "Perfect Buy Zone" (a close below $111,500) would invalidate the bullish scenario. This would likely signal a continuation of the macro downtrend toward lower price targets.
Conclusion:
We have a classic conflict: a dominant bearish trend versus a strong bullish reaction from a key demand zone. While the immediate momentum favors the bulls, caution is advised. A confirmation of a higher low would strengthen the case for a reversal.
Disclaimer:
This is not financial advice. This is for educational purposes only. Always do your own research (DYOR) before entering any trade.

BTCUSD Long Thesis: Awaiting Reversal for a Target of 118000Hello, traders! The market structure for BTCUSD was redefined by a reversal from the prior descending channel. A bullish initiative from the pivot point low near 112000 shifted the balance of power, with the subsequent impulse creating a new high at the 122500 supply zone. This action set the boundaries for the current consolidation phase.
Currently, BTC is consolidating within a large symmetrical triangle, a pattern of contracting volatility. The price auction is being squeezed between the descending supply line and the ascending demand line. The market is now at a critical juncture, testing the integrity of the horizontal demand zone around 113000, the primary area of control for buyers.
The working hypothesis is a long scenario based on a potential liquidity grab. It is anticipated that the price may briefly dip into the 113000 - 112000 demand zone before a sharp bullish reversal. A swift reclaim of the 113000 level would be the key confirmation. Such a reversal is expected to initiate a full rotation towards the upper boundary, with the take-profit set at 118500, a logical target representing a significant area of prior price interaction. Manage your risk!

$EURUSD 15m Mark-UpAug 18 - Mark-Up Update
Analysis Note:
The demand zone failed, and price did not move toward the Asian high.
Currently, if price manages to maintain its bullish structure and shift character from this area on the lower timeframe, it may push upward. If not, it will likely head toward the weak low I marked, and we may see a 15-minute swing character shift.
By analyzing price action on the 5-minute timeframe, you can make a more precise decision for either scenario!
Follow us to never miss more analyses.

$EURUSD 15m MarkUpAug 18
Analysis Notes:
We’ve tapped into a demand zone and also swept the Asian low on the 15-minute timeframe.
At the moment, I expect a move toward the Asian high, where you can look for entry confirmation on the 1-minute timeframe.
The 15-minute swing high is our final target.
Follow us to never miss more analyses.

Long Idea on USDHUFBased on :
-Negative Correlation with ZB1!
- Vwap support
- Demand zone
- Volume profile analysis

POSSIBLE BEARISH CONTINUATION ON GOLDBased on price action, Gold presents a very bearish sentiment from the daily point of view.
The indicated supply region may be the area of interest for the build up of the sells if indeed Gold is bound for the monthly lows.
Confirmation is needed for an entry.

US100 Index – Potential Bearish Reversal in Key Resistance Zone🧠 US100 Index – Potential Bearish Reversal in Key Resistance Zone
Timeframe: 30-Minute | Chart Published: July 24, 2025
---
🔍 Overview
The US100 (NASDAQ) has been trading in a well-structured ascending channel, forming higher highs and higher lows. However, recent price action suggests that the index is testing a critical supply zone near 23,400, with signs of weakening bullish momentum. This may signal a potential corrective phase or bearish reversal.
---
📈 Technical Analysis Breakdown
🔵 Trend Structure:
Price is respecting a clear ascending trendline (blue), connecting multiple higher lows.
Multiple bullish flag/channel formations have been completed within the uptrend, showing healthy momentum until the current point.
🟥 Resistance Zone:
Strong supply zone marked between 23,250 – 23,450.
Price action shows stalling candles and rejection wicks within this zone, indicating buyer exhaustion.
⚠ Bearish Patterns:
The red path projection suggests a head and shoulders-like structure forming at the top of the channel.
This, along with divergence in wave strength and shrinking momentum, supports a potential reversal.
🔵 Key Support:
First support lies around 23,000 — aligning with the ascending trendline and previous consolidation.
If broken, next demand zone is around 22,835 – 22,900, where historical consolidation took place.
---
🔁 Projected Scenario (as per visual path)
1. Price may attempt one last push into the 23,400–23,450 zone (possible false breakout).
2. Rejection from this level could trigger a fall toward the ascending trendline support.
3. A confirmed break of the trendline can lead to a larger correction toward the 22,800 zone.
---
🧠 Unique Insight
This chart combines multi-timeframe structure recognition with a real-time reversal formation inside a long-standing bullish trend. The analysis doesn’t just rely on textbook patterns—it recognizes real-time price behavior shifts, which makes it valuable for proactive traders.
---
📌 Conclusion
While the trend remains bullish overall, caution is warranted as the US100 approaches a historically significant resistance zone. The setup offers a compelling risk-reward short opportunity for aggressive traders, especially if the price confirms a break below trendline support.
---
🔧 Next Steps for Viewers
> “Watch for a clean rejection candle or lower high at resistance before entering short. If trendline breaks cleanly, 22,835 could be the next target zone.”

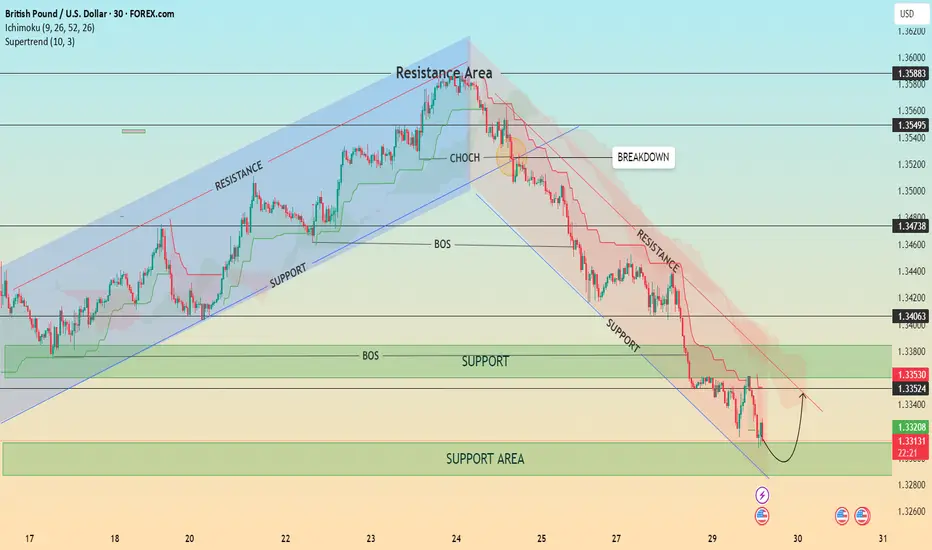
GBP/USD – Bearish Structure with Possible Short-Term Pullback📊 GBP/USD – Bearish Structure with Possible Short-Term Pullback
Timeframe: 30-Minute | Date: July 29, 2025
Price action recently broke down from a well-respected ascending channel, confirming a shift in market structure with a Change of Character (CHOCH) followed by a Break of Structure (BOS). Since then, GBP/USD has been respecting a descending trend channel, forming consistent lower highs and lower lows.
🔍 Current Setup:
Price is testing a major support area around 1.3300–1.3320.
A minor pullback is expected as indicated by the bullish wick rejections.
However, the overall bias remains bearish unless we break and hold above the 1.3353–1.3406 resistance zone and the descending trendline.
The Ichimoku Cloud and Supertrend both show bearish momentum.
📈 Potential Scenario:
Price may bounce from the support area and retest the upper boundary of the descending channel before resuming the bearish trend.
⚠️ Key Levels to Watch:
Resistance: 1.33530 / 1.34063 / 1.34738
Support: 1.33200 / 1.33000
💡 Structure Notes:
CHOCH = Trend Reversal Signal
BOS = Confirmation of Downtrend
Cloud = Dynamic Resistance