ADAUSDT → Correction (hunt for liquidity) before the fall BINANCE:ADAUSDT is pausing in the 0.41 area and entering a correction phase, during which it may test the zone of interest in a bearish market.
Bitcoin failed to overcome resistance at 92K, with economic data intensifying bearish pressure, resulting in another decline. The market is stagnant within the trading range, and any correction could quickly turn into a sharp decline...
ADA is forming a halt in the 0.41 zone and is entering a phase of local correction. The zone of interest is 0.426 - 0.434 (the area of local trend support breakdown). A retest of resistance may end in a false breakout...
Resistance levels: 0.421, 0.426, 0.434
Support levels: 0.409, 0.392
A false breakout of the resistance zone or a retest of the previously broken support of the uptrend may end in pressure from the bears. The correction may be followed by a continuation of the downtrend and the zone of 0.421 - 0.434
Best regards, R. Linda!
Descending Triangle

SOLANA → Countertrend correction. Bear market BINANCE:SOLUSDT.P is forming a correction after retesting the intermediate bottom of 120.0. Ahead lies a fairly strong and important zone of interest, to which the market may react...
The market structure is bearish. After updating the low within the bearish trend, a countertrend correction to the liquidity zone is forming. A retest of resistance at 143-145 may end in a false breakout and a fall.
Bitcoin is also stagnating. There is no strong support from the fundamental side, and the market is also far from technical support. There is still potential for a fall...
Resistance levels: 143.35, 145.67, 150.8
Support levels: 133.12, 128.3
The coin is within the trading range of 120.0 - 144.0. Accordingly, after a retest of support, a retest of resistance is forming, but pressure on the market is being exerted by a weak fundamental background and a downward trend. A false breakout of this zone of interest could trigger a sell-off...
Best regards, R. Linda!

BNBUSDT → The hunt for liquidity before the decline BINANCE:BNBUSDT.P breaks through the 880 support level as part of a global downtrend and updates its low to 790. Fundamentally and technically, the situation is weak...
Bitcoin and the cryptocurrency market as a whole are in a global downtrend. Within the trend, countertrend corrections are forming as a “hunt for liquidity” before the decline continues...
After updating its low to 790.9, BNB is forming a pullback, the target of which may be the resistance area of 879-888, which acts as a break-even zone (area of interest for MM). A false breakout could trigger a decline of 1/2, 2/3 of the current range.
Resistance levels: 879-880, 940
Support levels: 837, 814, 790
A retest of resistance and a lack of bullish potential could trigger a false breakout. Consolidation and a close below 879 could lead to another phase of selling and a correction to 837-814.
Best regards, R. Linda!

NZDUSD → The hunt for liquidity. Bearish trend...FX:NZDUSD is forming a correction towards consolidation after updating its global minimum. Bears may play aggressively against the backdrop of a strong dollar.
The dollar is quite strong after Thursday's news. After retesting resistance, the index is not falling, but is gathering strength and may continue to grow.
The global trend is downward. After a long consolidation, the currency pair is breaking support and updating its low. The market sentiment is bearish. Against this backdrop, NZDUSD may continue to decline after retesting resistance at 0.560 and a false breakout...
Resistance levels: 0.5606, 0.5635
Support levels: 0.555, 0.55
A false breakout, lack of bullish momentum, and price consolidation below 0.56 could trigger a further decline in price within the current trend.
Best regards, R. Linda!

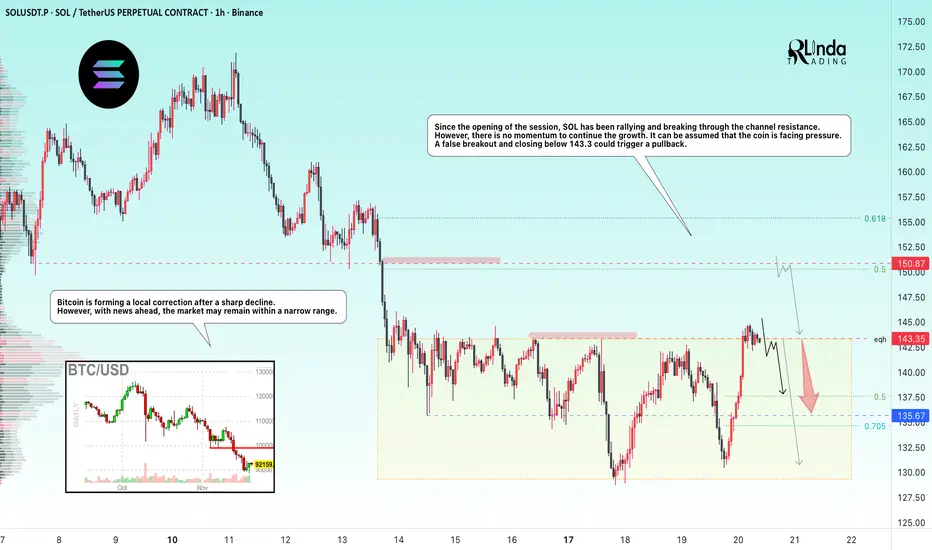
SOLANA → Manipulation - false breakout of resistance BINANCE:SOLUSDT.P flew up to resistance at 143.35 at the opening of the session and attempted to break through it, but bears may not let the price rise ahead of the news...
Bitcoin is forming a local correction after a sharp decline. However, news is ahead and the market may remain within a narrow range.
From the opening of the session, SOL rallies and breaks through the channel resistance, wasting 75% of its intraday growth potential. However, there is no momentum to continue the growth. It can be assumed that the coin is facing pressure. A false breakout and closing below 143.3 could trigger a pullback.
Resistance levels: 143.35, 150.87
Support levels: 135.67, 130.0
Two key levels for countertrend movement: 143.35 - 150.87. If the liquidity pool does not stop the price at the nearest level, then 150.87 can be considered as an additional level for trading a false breakout.
However, news on unemployment is coming soon, and the market may react quite aggressively. Therefore, if there are no trading opportunities before the news, I recommend refraining from action for an hour and waiting out the storm...
Best regards, R. Linda!
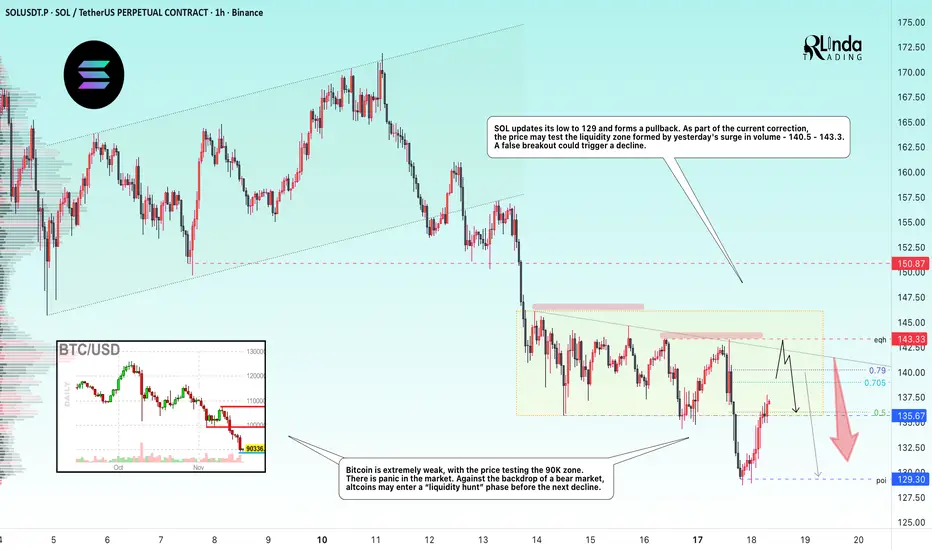
SOLANA → Hunting for liquidity in a weak market BINANCE:SOLUSDT is forming a countertrend correction. Zone of interest: 140.0–143.5. The lack of bullish potential and positive fundamentals could cause another decline...
Bitcoin is extremely weak, with the price testing the 90K zone. There is panic in the market. Against the backdrop of a bear market, altcoins may enter a phase of “liquidity hunting” before another decline.
Solana's price on D1 broke through fairly strong support at 141.3-138.5. The trend is bearish, and the breakout of support confirms the weakness of buyers (strength of sellers) at the moment.
SOL is updating its low to 129 and forming a pullback. As part of the current correction, the price may test the liquidity zone formed by yesterday's surge in volume - 140.5 - 143.3
Resistance levels: 139.0, 140.2, 143.3
Support levels: 135.67, 129.3
Consolidation is forming above the support range - 135.67. Most likely, bulls may flood the volume and provoke another rise to the liquidity zone, but there may not be enough potential for continued growth. A false breakout and lack of bullish momentum could trigger a decline to 135.5 - 129.3.
Best regards, R. Linda!
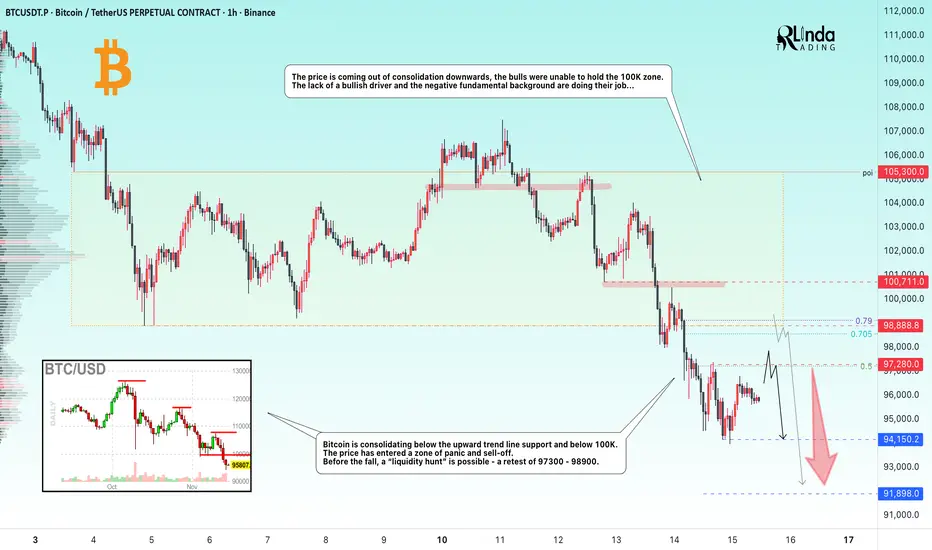
BITCOIN → 100K broken. Consolidation in the short zone...BINANCE:BTCUSDT.P broke through the 100K support level and is consolidating within the local range of 94,150 - 97,280. The decline may continue if the market does not receive support (news or other bullish drivers).
Bitcoin is consolidating below the upward trend line of support and below 100K. The price has entered a zone of panic and sell-off. Before the fall, a “liquidity hunt” is possible - a retest of 97300 - 98900.
The price is coming out of consolidation downwards, the bulls were unable to hold the 100K zone. The lack of a bullish driver and the negative fundamental background are doing their job...
Resistance levels: 97280, 98900, 100700
Support levels: 94150, 91900
Before further decline, the market may test the previously broken support zone relative to the upward lower trend line. Focus on the 97280 - 98990 zone. A false breakout and lack of bullish momentum could form a reversal pattern and trigger a decline to 94150 - 91900.
Best regards, R. Linda!
GOLD → Retest 4050 in a weak market...FX:XAUUSD is bouncing off support at 4000 and forming a correction towards 4050, an important resistance level. The market's main focus is on the September employment report (NFP), which will be released on Thursday.
Key pressure factors:
The strong dollar is supported by hawkish statements from the Fed and risk aversion. The probability of a rate cut in December has fallen to 42%.
Support for gold: Demand for government bonds has lowered the yield on 10-year Treasuries, allowing gold to rebound to $4045.
A series of negative labor market reports keeps risks alive.
Gold remains under pressure. A break below $4000 will open the way to $3950, while a rise above $4050 will require weak NFP data or dovish Fed rhetoric. The week will determine the direction
Resistance levels: 4050, 4090
Support levels: 4000, 3965
The market is beginning to doubt the local bullish structure. Strong trend support is breaking down and the previously broken level is being retested. If the bears keep the price below 4045-4050, gold could continue to decline. However, it is worth keeping an eye on the news in the second half of this week...
Best regards, R. Linda!

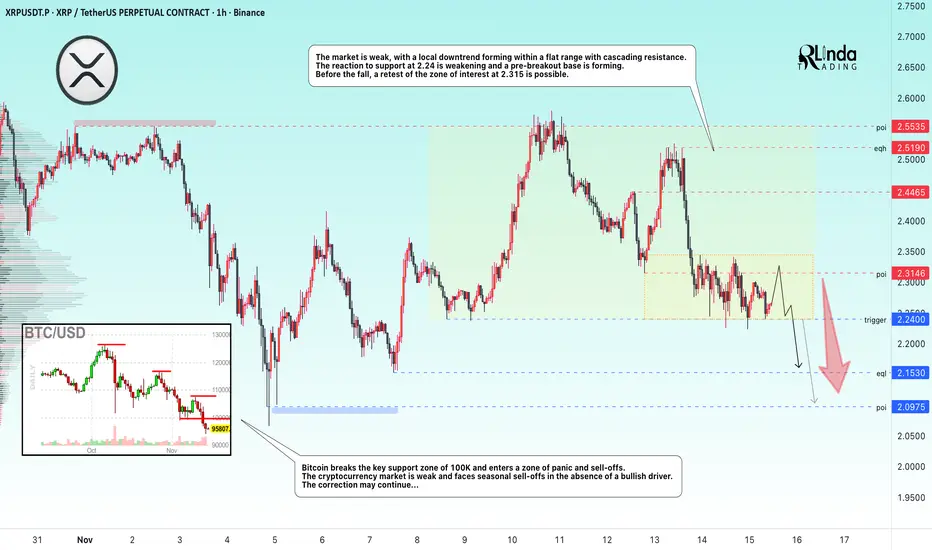
XRPUSDT → Consolidation before breaking through support BINANCE:XRPUSDT continues to storm the 2.24 support level amid a downtrend and a weak market. There is no bullish driver, and the fundamental background is also weak...
Bitcoin breaks through the key support zone of 100K and enters a zone of panic and sell-offs. The cryptocurrency market is weak and facing seasonal sell-offs in the absence of a bullish driver. The correction may continue...
XRP is forming a local downtrend with cascading resistance within a flat. The reaction to the 2.24 support is weakening and a pre-breakout base is forming. Before the fall, a retest of the 2.315 zone of interest is possible.
Resistance levels: 2.315, 2.4465
Support levels: 2.24, 2.153, 2.097
A false breakout of 2.3146 could trigger a further decline, but a close below 2.153 could trigger a sell-off and a subsequent decline to the 2.153-2.097 zone.
Best regards, R. Linda!
GOLD → The battle for the $4,000 zone. Are the bulls here?FX:XAUUSD is gradually recovering. The price is breaking through $4,000 and trying to stay above the key psychological level. Focus on 4,030–4,050...
Weak employment data, namely a sharp increase in layoffs in October, has heightened fears of an economic slowdown, a decline in government bond yields, and the ongoing correction of AI assets is fueling demand for safe havens.
The probability of a Fed rate cut in December has risen to 69%. The situation is stabilizing somewhat, there is no strong news today, and the market may try to maintain the current backdrop...
Gold retains its upside potential while macro risks remain. The $4000 level is currently acting as key support. Closing the week above this mark will open the way to test $4050.
Resistance levels: 4030 - 4050
Support levels: 4000, 3975, 3956
The dollar and gold are rising, and the inverse correlation is decreasing, indicating that bulls are still trying to keep the market from falling sharply. However, given the lack of drivers, strong news, and a clear fundamental backdrop, I would say that gold is not yet ready to break out of its current range. Consolidation above 4K could lead to a retest of 4030-4050, which in turn could trigger a pullback to local support.
Best regards, R. Linda!

ETHUSDT → Breakdown of the global trend. Distribution to 3360BINANCE:ETHUSDT is entering a distribution phase after breakdown of a consolidation formed against the backdrop of a bearish trend (correction). Sentiment, like the fundamental background, is changing...
Bitcoin is falling, which is putting pressure on the market. The reasons are weak fundamentals, index correction, and the rise of the dollar (outflow of funds from the market). On the daily ETH timeframe, we see a break in the uptrend. Monday's candle closed below the trend line, and since the opening of the session, the price has rallied (panic???)
Ethereum is coming out of consolidation (breakthrough of 3671). A distribution phase is forming, directed towards 3366 (liquidity pool). Technically, a false breakdown of support could trigger a pullback to 3600 (retest of the previously broken upward support line).
Support levels: 3366, 3150, 3000
Resistance levels: 3600, 3670, 3916
Despite the breakdown of the trend structure, we have strong support ahead. If the bulls hold 3366, the market may form a wider trading range. But if the overall background does not change, the decline may continue after the correction...
Best regards, R. Linda!

GOLD → Consolidation is narrowing... Price is weakening FX:XAUUSD is trading near $4,000, consolidating after the Fed's statements and awaiting new macro data. The trading range has narrowed to $3,886–4,046, forming a symmetrical triangle (unpredictability)
Fed caution: Powell ruled out guarantees of a rate cut in December, which supported the dollar and limited gold's growth.
US shutdown: Could become the longest in history, causing economic concerns, but is expected to end this week.
Weak data: ISM Manufacturing PMI (48.7) pointed to contraction in the sector, which is holding back the dollar's strengthening.
This week, attention is focused on ADP and ISM Services — assessing the impact on Fed rates.
NFP (if published) — a key benchmark for the labor market.
Accordingly, gold is in wait-and-see mode. Clear signals from the data or the Fed will be needed to break out of the range. The $4000 level remains a psychological equilibrium point.
Resistance levels: 4000, 4030, 4050
Support levels: 3956, 3915, 3900
At the moment, the price is far from the key consolidation boundaries, and the market is uncertain. In this case, we are considering trading within the channel. I expect to see a retest of the flat resistance or the triangle boundary and a rebound.
Best regards, R. Linda!

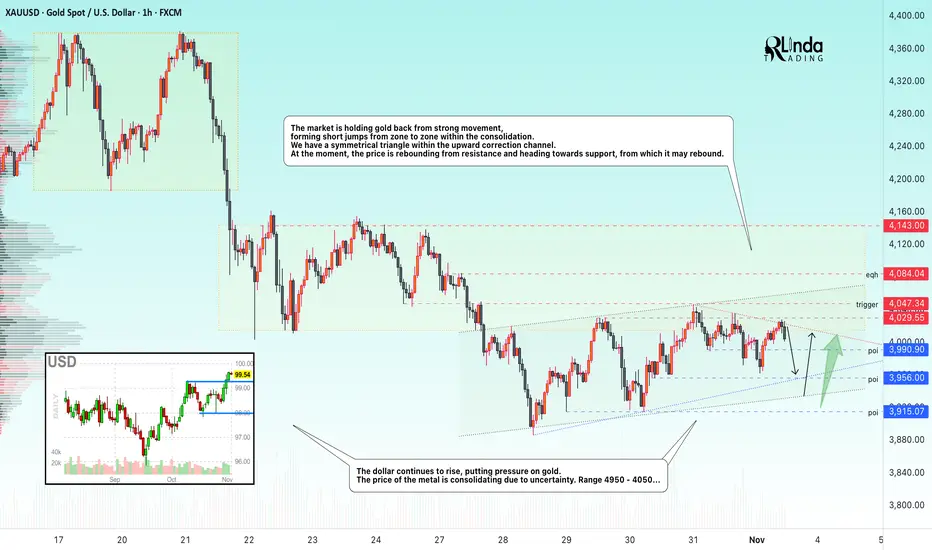
GOLD → Consolidation within a symmetrical triangle The market is holding gold back from strong movement, forming short jumps from zone to zone within consolidation. We have a symmetrical triangle within an upward correction channel.
Key supporting factors:
The US shutdown is becoming the longest in history, increasing economic risks.
China is canceling tax breaks for retailers. Trump may announce new tariffs related to China.
ISM Manufacturing PMI data (US) is ahead - a rare indicator during the shutdown.
The probability of a Fed rate cut in December has fallen to 69% (from 91.7% a week ago).
Technically, consolidation may continue until the price breaks one of the boundaries of the symmetrical triangle.
Support levels: 3990, 3956, 3915
Resistance levels: 4030, 4047, 4085
Traders are uncertain about the future direction, and as a result, the market is consolidating. There are limit levels both below and above that are holding back movement. Accordingly, until there is a clear fundamental background, it is possible to focus on trading within the channel. I expect a rebound from 3960 for a retest of resistance. However, a close above 4030 could trigger growth, while a close below 3956 would confirm the weakness of the market and trigger a fall to 3900.
Best regards, R. Linda!
LINKUSDT → A trap? Grabbing liquidity before the fall...BINANCE:LINKUSDT is forming a correction after a bearish run. A false breakdown of support is triggering a correction before a possible continuation of the decline.
The coin is testing the support of the trading range within the downtrend. The reaction to the false breakdown of support is a pullback to the zone of interest. After a strong downward distribution, a correction to the break-even zone is forming. A false breakout of resistance at 17.45 could trigger a continuation of the decline due to a weak market and a liquidity pool formed above 17.450, which is likely to stop the pullback on the bearish trend.
Resistance levels: 17.450
Support levels: 16.53, 15.77
The downtrend may continue. A retest of resistance may end in a fall and an update of the local minimum, as well as reaching the zone of interest at 15.77.
Best regards, R. Linda!

GOLD → Consolidation. The fundamental backdrop is changing...FX:XAUUSD stabilizes after a week-long decline, failing to consolidate above $4050. The market is taking a pause before new impulses. Focus on 4030 and 3980...
Investors are closing positions before the end of the week and month, the reason being the uncertainty surrounding the deal with China and Powell's less dovish stance on policy: a 25 bp rate cut is already priced in. The probability of a December cut has fallen to 72.8% (from 91.1% a week ago). Powell emphasized that decisions depend on data, which is not available due to the shutdown.
The strong dollar (2-month highs) is putting pressure on gold. Weak data from China (PMI fell to 49.0) is reducing demand from the largest consumer.
The balance is tipping towards weak fundamentals...
Resistance levels: 4030, 4085
Support levels: 3982, 3955, 3915
Technically, bears are keeping the market below 4030 - strong resistance. If buyers enter the market (there are currently no fundamental reasons for this) and the bulls are able to break through 4030 and keep the price above this level, we will have a chance for growth. But under the current circumstances, I expect a correction to support before a possible rise.
Best regards, R. Linda!

GOLD → Sell-off due to uncertainty FX:XAUUSD is falling, the trend is downward, and we have confirmation of this. Profit-taking is leading to a decline, which is causing buyers to exit the market...
Caution ahead of the Fed: Markets are pricing in a 25 bp rate cut, but the main thing is the tone of the statement and Powell's comments on further steps. The USD is not ready to continue its growth and is starting to look downwards. The US government shutdown continues, adding uncertainty, which supports gold.
However, an important issue is the trade deal between the US and China; a positive outcome could put pressure on gold.
Gold is balancing between hopes for a trade truce and risks from Fed policy.
Support levels: 3895, 3820
Resistance levels: 3943, 3975, 4015
Since the opening of the session, the price has fallen by 2.3%, which is an intraday range. The 3900-3895 area may see a reaction in the form of a false breakdown and a correction to the imbalance zone before a possible further decline.
Best regards, R. Linda!

GOLD → A psychologically important level of $4,000 lies aheadFX:XAUUSD continues to correct, unable to consolidate above $4,100, with the 4K mark ahead. Pressure is intensifying due to hopes for a trade deal between the US and China, as well as profit-taking ahead of the Fed's decision on interest rates...
Key factors:
Progress in trade negotiations: the US has withdrawn the threat of 100% tariffs, and China may support the situation. Thursday's meeting between Trump and Xi Jinping increases the chances of a deal.
Bets on two rate cuts in 2024 are almost fully priced in. US inflation (3% y/y) was lower than forecast (3.1%), but did not change expectations.
The correction may continue if the positive backdrop for the trade deal remains. The Fed's decision on Wednesday will be a key catalyst.
Technically, the 4K zone is ahead, and it is too early to talk about a break of this support, as we do not know how the market will react. However, at the moment, the price is in the range of 4000-4163, and from a technical analysis point of view, it is logical to consider a false breakdown and a pullback.
Support levels: 4000, 3975, 3944
Resistance levels: 4060, 4090, 4163
As part of the decline, the market may test one of the specified zones: 4000, 3975, 3944. However, since a liquidity pool has formed below 4K, the reaction to the psychological support level may be aggressive. It is important to monitor the situation, as closing below 4K and consolidating below a strong level could trigger a further decline. Otherwise, if the bulls manage to hold their ground above 4K and bring the price back above 4050, the market may have a chance to grow.
Best regards, R. Linda!

ETHEREUM → Manipulation before a possible fall BINANCE:ETHUSDT , as part of manipulation and updating the local maximum to 4108, confirms strong resistance, forms a false breakout, and falls, testing key support.
Bitcoin, as part of yesterday's rally in the US trading session, is trying to turn the tide, but after encountering resistance at 113600, it forms a false breakout and sells off all the growth, which is generally a signal of readiness for a decline. This could have a negative impact on the entire market...
Ethereum is testing support - trigger 3822.5. After a sharp drop, there is no rebound, which indicates buyer weakness. Consolidation is forming near support, which only reinforces the pre-breakdown potential.
Resistance levels: 3963, 4030, 4090
Support levels: 3822, 3660, 3366
The classic implementation of the “liquidity hunt” scenario led to a rally to resistance, and a false breakout at 4090 led to heavy selling. As part of the current consolidation, the market is reducing volatility ahead of support, which only increases the chances of a breakdown. A close below 3822 could trigger a further decline. Key liquidity zones are 3658 - 3366.
Best regards, R. Linda!

AUDUSD Descending triangle breakout bullish move 📉 AUD/USD Technical Setup (1H Timeframe)
The pair has broken out of a descending triangle pattern 🔺 showing strong bullish momentum from the 0.6490 level 💪
🎯 Upside Targets:
1️⃣ 0.6520
2️⃣ 0.6570
3️⃣ 0.6600
Momentum remains bulls-in-control as long as price holds above 0.6490 support zone ⚡
💡 Watching for continuation moves toward upper resistance levels if buying pressure sustains.
#AUDUSD #Forex #PriceAction #TechnicalAnalysis #TradingSetup 💹

EURUSD → Bearish distribution to 1.1400FX:EURUSD continues its downward trend. The market structure is bearish (locally), and a breakdown of the nearest support level could intensify the sell-off, leading to new lows
The dollar is rising, and the currency pair is changing its medium-term direction after breaking out of consolidation. The structure is weak, and the decline may continue to 1.14.
The focus is on the current consolidation, which is forming against the backdrop of a downtrend. Consolidation below 1.1588 and a close below 1.1557 will confirm the strength of the sellers and, in turn, may trigger a decline to the liquidity zone of 1.146 - 1.1400
Resistance levels: 1.1588, 1.1630
Support levels: 1.1557, 1.1461
On D1, the market confirmed the trend reversal, with a bearish distribution forming locally. The liquidity zone that may be of interest to the market is below 1.140, so a medium-term move in this direction can be considered if the price closes below 1.1557
Best regards, R. Linda!

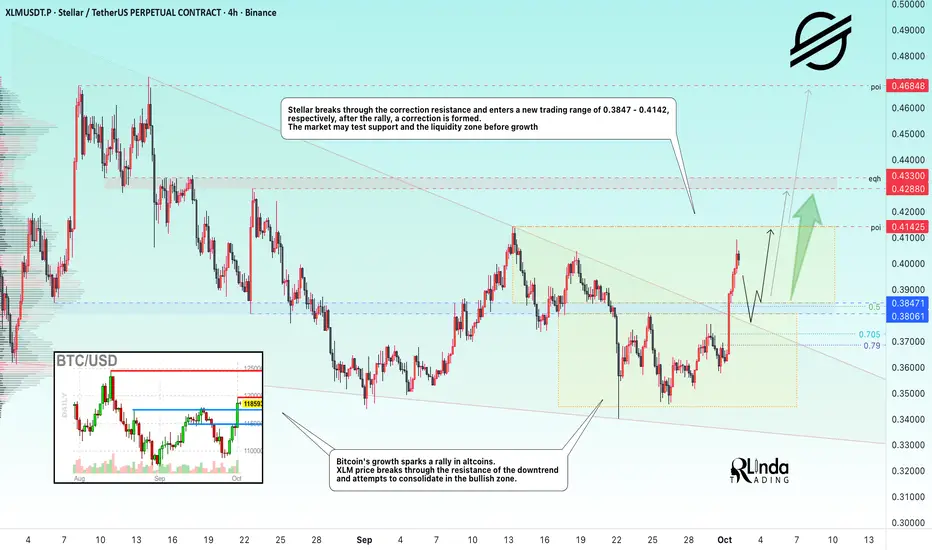
XLMUSDT → End of correction. One step away from a rally BINANCE:XLMUSDT follows the flagship currency in forming a rally and breaking out of the correction. The trend is bullish, but news is ahead. Will the bulls be able to keep the price above the risk zone?
Bitcoin's growth is provoking a rally in altcoins. The price of XLM is breaking through the resistance of the downtrend and trying to consolidate in the bullish zone.
Stellar is breaking through the resistance of the correction and entering a new trading range of 0.3847 - 0.4142, respectively, after the rally, a correction is forming. The market may test support and the liquidity zone before rising.
Resistance levels: 0.4142, 0.4288, 0.433
Support levels: 0.3847, 0.3806
As part of the correction, I expect a retest of the 1/2 zone of the formed impulse or the support zone of 0.385 (previously broken consolidation and descending wedge border).
If the bulls keep the price from falling even after the news, the coin may continue its medium-term bullish run to 0.4685.
Best regards, R. Linda!
NZDJPY → Consolidation amid a downtrend. What next?FX:NZDJPY is ending its correction and returning to the downward trend. The price is consolidating for a possible continuation of the downward movement...
The price breaks the support of the upward channel (countertrend correction). The movement occurs in a “step” format, which generally indicates weak demand. Clear consolidation boundaries are forming on the chart. The global trend is downward, and the local trend has also resumed its downward movement. Focus on two zones: 86.5 - 86.96. Within the framework of trading strategies, a false breakout of resistance or a breakout of support can be considered with the aim of continuing the decline.
Resistance levels: 86.96, 87.16
Support levels: 86.5
As part of consolidation, MM may form a liquidity trap on the resistance side, and a false breakout may trigger a further decline. However, if the bears increase pressure, the formation of a pre-breakdown base relative to the 86.5 support may trigger a breakout and a continuation of the downward movement.
Best regards, R. Linda!

XRPUSD → Will the rate meeting be a bullish driver for altcoins?BINANCE:XRPUSDT.P is consolidating above the previously broken boundary of the descending triangle formed within the bullish trend. Important news is ahead—the Fed's meeting on interest rates, which is highly likely to become a bullish driver for the cryptocurrency market.
The daily structure of the XRP market looks promising. The price is not updating global lows, is staying within the boundaries of the uptrend, and at the same time is breaking through the resistance of the downward correction, trying to consolidate above the fairly strong support level of 2.9535. But the market is waiting for a driver, namely fundamental background. If this background strengthens after Powell's speech, Bitcoin and altcoins may strengthen, including XRP. However, the fundamental background largely depends on the overall mood of the Fed and its comments. The market has already priced in an interest rate cut, as this is predictable given the economic data. But traders will be watching Powell's tone and how dovish or hawkish his view of the situation is.
Support levels: 2.9535, 2.8853
Resistance levels: 3.0577, 3.155, 3.359
Technically, at the moment, I am considering a scenario of a retest of support and the formation of a long squeeze at 2.9535 - 2.8853 against the backdrop of increased news volatility (manipulative nature). However, if this does not happen, the focus will be on 3.0577, and a close above this level could trigger further growth.
Best regards, R. Linda!
