#DEXEUSDT : The Calm Before the Squeeze Storm#DEXE
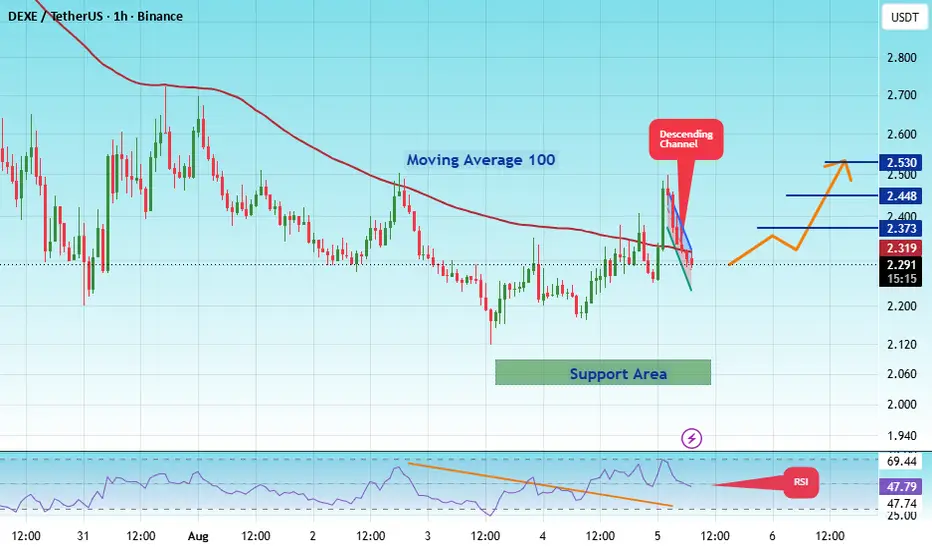
The price is moving within a descending channel on the 1-hour timeframe and has reached the lower boundary. It is now poised for a bounce and is expected to retest this boundary.
The Relative Strength Index (RSI) indicates a downward trend, which is likely to continue given the overbought conditions.
There is a key support zone in green at 1.75, and the price has bounced off this zone several times, making it a strong support level.
The price is trending towards the 100-period moving a
Dexeusdtbuy
#DEXEUSDT : The Calm Before the Squeeze Storm
#DEXE
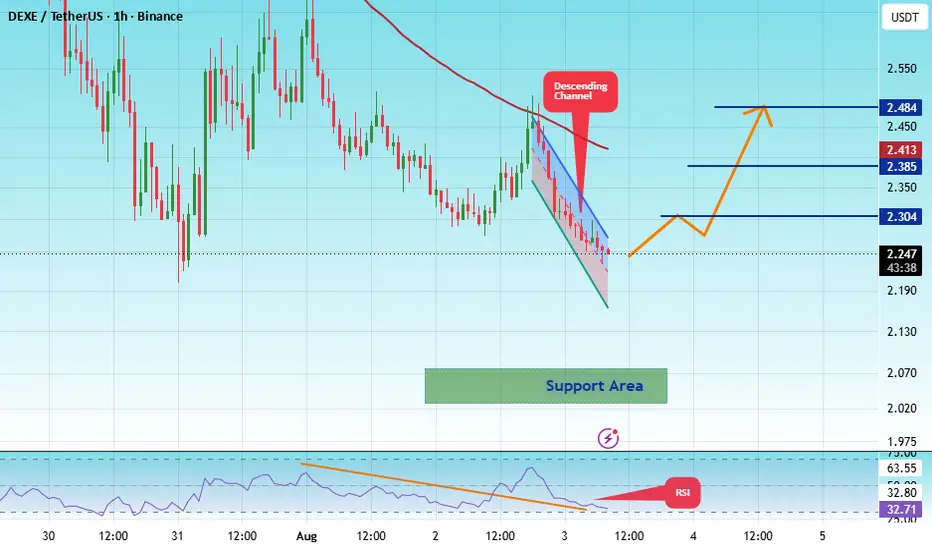
The price is moving within a descending channel on the 1-hour timeframe; it has reached the lower boundary and is poised for a rebound, suggesting a potential upward move upon retesting this level.
The Relative Strength Index (RSI) indicates a bearish trend, yet a bullish breakout is likely given that the price has reached "oversold" levels on the 1-hour chart.
An orange trendline supports the likelihood of a bullish rebound.
There is an initial support level at 1.75, acting as a prel
#DEXEUSDT : The Calm Before the Squeeze Storm#DEXE
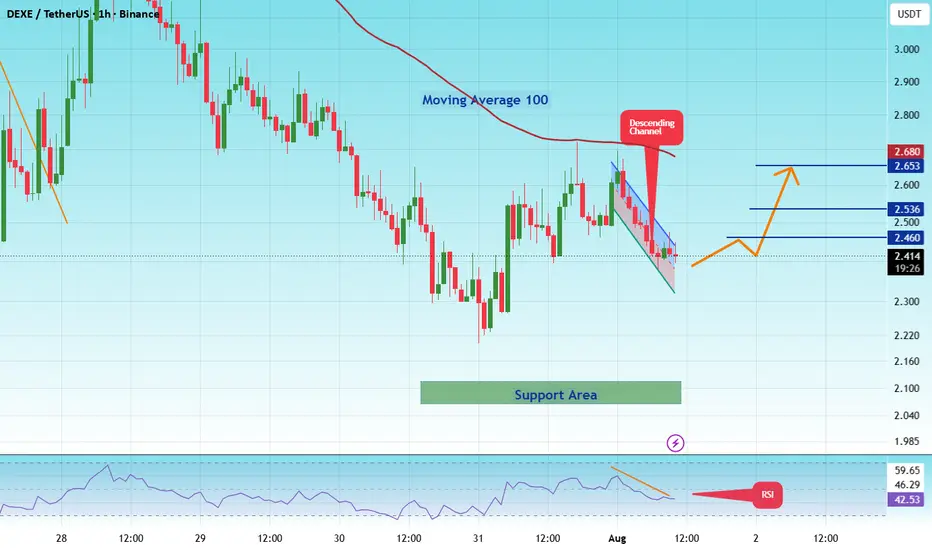
The price is moving within a descending channel on the 1-hour timeframe; it has reached the lower boundary and is poised for a rebound. A retest of this boundary is expected, supporting an upward move.
The Relative Strength Index (RSI) indicates a bearish trend, but an upward breakout is likely due to oversold conditions on the 1-hour timeframe.
An orange trend line supports the potential upward rebound.
There is initial support at the 1.75 level, acting as a primary support zone.
A k
#DEXEUSDT : The Calm Before the Squeeze Storm#DEXE
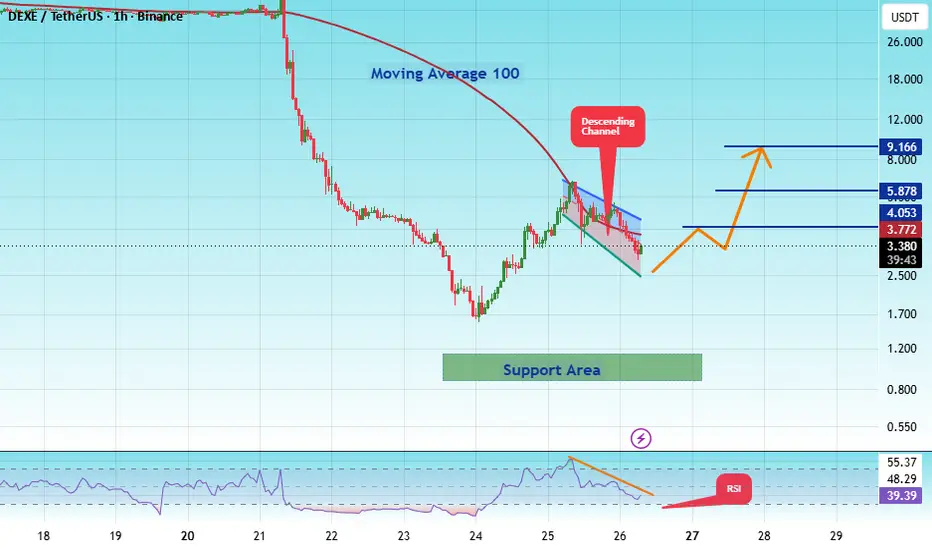
The price is moving within a descending channel on the 1-hour timeframe and has reached the lower boundary. It is now poised for a bounce and is expected to retest this boundary.
The Relative Strength Index (RSI) indicates a downward trend, which is likely to continue given the overbought conditions.
There is a key support zone in green at 2.04, and the price has bounced off this zone several times, making it a strong support level.
The price is trending towards the 100-period moving a
#DEXEUSDT : The Calm Before the Squeeze Storm#DEXE
The price is moving within a descending channel on the 1-hour timeframe and has reached the lower boundary. It is now poised for a bounce and is expected to retest this boundary.
The Relative Strength Index (RSI) indicates a downward trend, which is likely to continue given the overbought conditions.
There is a key support zone in green at 1.70, and the price has bounced off this zone several times, making it a strong support level.
The price is trending towards the 100-period moving a
#DEXEUSDT : The Calm Before the Squeeze Storm#DEXE
The price is moving within a descending channel on the 1-hour timeframe and has reached the lower boundary. It is now poised for a bounce and is expected to retest this boundary.
The Relative Strength Index (RSI) indicates a downward trend, which is likely to continue given the overbought conditions.
There is a key support zone in green at 2.02, and the price has bounced off this zone several times, making it a strong support level.
The price is trending towards the 100-period moving a
#DEXEUSDT : The Calm Before the Squeeze Storm#DEXE
The price is moving within a descending channel on the 1-hour timeframe and has reached the lower boundary. It is now poised for a bounce and is expected to retest this boundary.
The Relative Strength Index (RSI) indicates a downward trend, which is likely to continue given the overbought conditions.
A key support zone (in green) has been identified at 2.06. The price has bounced off this zone several times, making it a strong support level.
The price is trending towards the 100-period
#DEXEUSDT : The Calm Before the Squeeze Storm#DEXE
The price is moving within a descending channel on the 1-hour timeframe and has reached the lower boundary. It is now poised for a bounce and is expected to retest this boundary.
The Relative Strength Index (RSI) indicates a downward trend, which is likely to continue given the overbought conditions.
There is a key support zone in green at 0.920, and the price has bounced off this zone several times, making it a strong support level.
The price is trending towards the 100-period moving
DEXEUSDT - Testing Key Resistance, Is Massive Breakout Imminent?📊 DEXE is currently trading on the 1W (Weekly) timeframe and is once again testing its strongest resistance zone, which has repeatedly capped price advances since 2021. The highlighted yellow area represents a major 🟨 Key Resistance that has rejected price multiple times over the years.
💪 More importantly, after forming a strong Higher Low from the $2 region, DEXE has delivered an impressive bullish impulse back into this major resistance zone. This indicates that buyers are gradually taking co
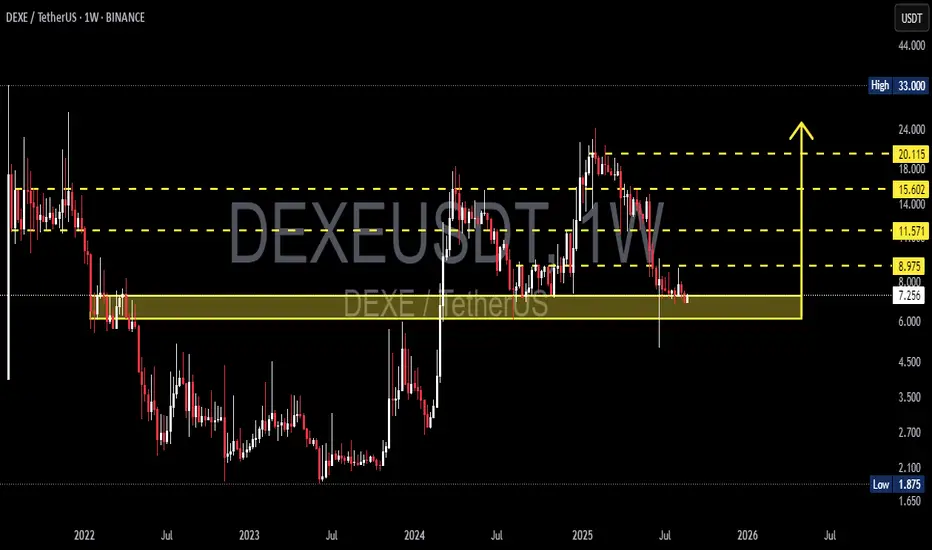
DEXE/USDT — Demand Zone Retest: Bullish Reversal or Breakdown?🔎 Overview
DEXE/USDT is currently retesting the weekly demand zone ($6–8) which has historically acted as a strong accumulation area during 2022–2023. After a massive rally in 2024 followed by a strong correction in early 2025, price has formed a series of lower highs, showing clear selling pressure from smart money.
Now, the market is at a critical juncture: will this demand zone hold and spark a new bullish phase, or will it break down and send price back toward historical lows?
---
📌 Mark
#DEXE #DEXE
We have a bearish channel pattern on the 12-hour frame, within which the price moves and adheres to its limits well
We have a green support area at 11.30 after the price touched it and bounced from it
We have a tendency to stabilize above moving average 100
We have a downtrend on the RSI indicator that supports the price higher with a breakout
Entry price is 12.30
First goal 14.28
The second goal is 15.42
the third goal is 16.90
DeXe token formed bullish Cypher | A good buying opportunityHi dear friends, hope you are well and welcome to the new trade setup of the DeXe token with US Dollar pair.
Previously we caught a nice pump of DEXE in the below trade:
Now on a 2-hr frame, DEXE has formed a bullish Cypher pattern.
Note: Above idea is for educational purpose only. It is advised to diversify and strictly follow the stop loss, and don't get stuck with trade.