UNH: adding into fear after a completed ABC correctionThesis
NYSE:UNH has completed its corrective ABC structure and is stabilizing within Wave 2, offering long-term accumulation opportunities in a proven cash-flow compounder.
Context
- Daily and weekly timeframes
- Deep corrective phase already completed
- Long-term uptrend remains intact on the weekly chart
- Dividend-paying, high free-cash-flow defensive name
What I see
- Yesterday’s selloff was headline-driven, not structural
- Price is holding inside the Wave 2 retracement zone
- Volatility is shaking out weak hands, not breaking structure
- This behavior is typical at the end of corrective phases
- I added to my long-term position yesterday, bringing my average into the $270s
What matters now
- The priority is stabilization and base-building
- A reclaim of the 50-day MA improves short-term structure
- Reclaiming the 200-day MA confirms the next impulsive leg
- Gap-filling narratives are noise, not a strategy
Buy / Accumulation zone
- Accumulation remains valid inside the current Wave 2 range
- I have no issue adding again once price stabilizes
- Risk is defined against the recent correction lows
Targets
- First major structural reference: 200-week MA near $460
- Wave 3 target remains the 1.618 Fib extension around $540
- Dividend yield (~2.6%) pays while waiting
Execution note
- This game isn’t for everyone — pressure exposes conviction
- I added at $250 and $240 when sentiment was darkest
- Buffett added at higher prices, yet fear returned instantly
- NYSE:UNH is my current safe-haven: strong FCF, cash-rich, defensive
This is a 3–5 year hold for me, not a short-term trade
Dividendstocks

UPS – Weekly Structure | Wave 3 Breakout in ProgressThesis
NYSE:UPS is breaking out from a multi-month consolidation and transitioning into an impulsive Wave 3 structure, supported by improving price action and strong income characteristics.
Context
- Weekly timeframe
- Prolonged corrective phase followed by tightening consolidation
- Price has recently reclaimed key moving averages
- Dividend yield remains elevated, supporting longer-term positioning
What I see
- Price has broken above the 50-week moving average
- Psychological resistance at the $100 level has been cleared
- The upper boundary of the descending wedge has been breached
- Structure is consistent with the early stages of a Wave 3 advance
What matters now
- Holding above the $100 breakout zone is key to maintaining bullish structure
- Follow-through should remain controlled rather than impulsive, consistent with NYSE:UPS historical behavior
- Failure to hold the breakout would likely result in consolidation rather than trend failure
Buy / Accumulation zone
- Retests of the breakout area above $100 remain the primary zone of interest
- Risk is defined against the former wedge resistance
Targets
- Wave 3 reference aligns with the 1.618 Fibonacci extension near the $120 area
- Longer-term structure remains capped by the 200-week moving average overhead
Risk / Invalidation
- A sustained move back below the $100 level would weaken the breakout thesis

Why is $PG Procter & Gamble NOT good for Dividends nowFor dividends, companies need to have a relatively stable chart, or even some ups/downs are even better, but do NOT gamble (pun intended) on price.
P&G specifically MAY have reached the bottom of the fall, and get a short-term uptrend, but after that double-top and being within a descending channel, my feeling is that the downtrend will continue.
I would NOT get this risk for a little 3% dividend.
WHY?
I use dividends as an accelerator towards Financial Freedom.
FOLLOW me and check my profile if you want Templates and Reports to:
know the exact breakdown of your income to dedicate to Savings, Investments, Basic needs, etc.
Deep research of the best companies providing Dividends, 5-year Yields, with analytics and rationale.

ING - Critical Area of Interest This is a valid long setup with mixed cues. Price swept the 22 Sep lows and printed a clean hammer back inside the range, offering either a trade or a longer‑term dividend play. The Aug–Oct pullback came on rising volume (not ideal), but the silver lining is the narrowing candle spreads into the low with high volume, signaling demand stepping in and absorption rather than panic.
Liquidity and composite operator read
- Early reversal risk: It’s still early to call the low. The November sweep wasn’t deep, so the Composite Operator may engineer one more push to harvest liquidity.
- If another flush occurs: A sharp retest toward the yearly S2 pivot could set a monthly bullish hammer/doji, then rotate higher back into the range.
Trade Plan
Scenario 1 – Higher risk, price action led
• Initial target: Mid‑range EQ, aligning with the monthly FVG EQ and the local 50% level
• Extended target: $3.50 if price accepts above the range midpoint and holds retests
• Invalidation: November low (tight SL to respect the risk)
Scenario 2 – If November low breaks
• Entry: Look for a bullish hammer/doji close above the yearly S2 pivot
• Confirmation: Add to the position once price closes back inside the range
• Targets: Same as Scenario 1, but with improved risk‑reward if the flush plays out
Bottom Line
Conflicting signals remain, but the structure is tradable. Respect the downside via the November low, and let the chart dictate whether this is absorption turning into rotation.

14% Yield: Monthly Income or Ticking Time Bomb?AGNC Investment defies standard market logic. While the S&P 500 offers meager yields, AGNC delivers a staggering 14% . This payout is ten times the market average. Furthermore, the firm pays monthly, attracting income-focused investors globally. However, high yield often signals high risk. Investors must dissect the financial engineering behind this Real Estate Investment Trust (REIT) to determine its sustainability.
Business Models and Financial Innovation
AGNC operates differently from traditional landlords. The company does not own physical properties. Instead, it deploys a complex "Financial Engineering" model focused on Agency residential mortgage-backed securities (MBS).
Government-sponsored enterprises like Fannie Mae and Freddie Mac guarantee these pools of mortgages against credit loss. This structure makes the assets inherently low-risk. To generate double-digit returns from low-yielding assets, AGNC utilizes significant leverage. They fund operations primarily through repurchase agreements, amplifying both potential returns and volatility.
Macroeconomics and The "Alignment" Metric
Standard earnings metrics often fail to value Mortgage REITs (mREITs) accurately. The critical economic indicator for AGNC is the alignment between its Cost of Capital and Return on Equity (ROE) .
In the third quarter, AGNC achieved a critical equilibrium. The company’s cost of capital stood at 17% . Simultaneously, new MBS investments generated an ROE between 16% and 18% . This mathematical alignment suggests the current dividend is supported by actual cash flows, despite the net spread per share ($0.35) trailing the quarterly dividend payout ($0.36).
Management and Strategic Leadership
AGNC leadership is aggressively capitalizing on favorable industry trends. CEO Peter Federico maintains a "constructive outlook," citing manageable supply and growing demand for MBS.
Management proved this confidence by executing a massive capital raise in Q3. The firm completed a $345 million preferred stock issuance, the largest by an mREIT since 2021. Additionally, they issued over $300 million in common stock at a premium. This liquidity injection allows leadership to purchase high-yielding assets immediately, securing future revenue streams before market conditions shift.
Geostrategy and Market Risks
While the current environment is robust, the mREIT business model remains sensitive to broader geopolitical and economic shifts. Interest rate volatility, driven by Federal Reserve policy or global trade tensions, can disrupt the Repo market.
History serves as a warning. AGNC has cut dividends previously when borrowing costs spiked faster than asset yields, most recently in 2020. A sudden "misalignment" between funding costs and asset returns would threaten the payout again.
Investment Verdict
AGNC represents a high-reward play for risk-tolerant portfolios. The dividend rests on a stable foundation today, supported by strong capital alignment and aggressive management. However, this is not a "set it and forget it" stock. Investors must actively monitor interest rate spreads to ensure the dividend remains viable.

Kenvue Tylenol Turmoil: Does the 33% Drop Scream Undervalued?While many stocks (especially tech) are near all-time highs and have high PE ratios, I'm still hunting for bargains, and Kenvue seems to be relatively cheap. More recently, it came under fire because of Trump's remarks on Tylenol, and the stock lost over 10% in a few days.
Since May 2025, the stock has lost 33%, putting it, in my opinion, in an undervalued zone.
Kenvue is the manufacturer of a bunch of health-related products, including Tylenol, Neutrogena, Band-Aid, Listerine, Benadryl, Zyrtec, Motrin, Aveeno, Johnson's, Rogaine, and many more.
I like this kind of health-related beaten-down stocks because they exhibit good uncorrelation with the rest of the stock market, and in bear markets, they tend to hold up well because people always need to buy healthcare products.
WHY BUY KENVUE STOCK?
The stock has a strong moat, with excellent market penetration, top-of-mind brand recognition, and consumer loyalty, as well as economies of scale, worldwide.
They have great management, with Kirk Perry and Andy Dasgupta leading the company. This guy has a great track record in the consumer product sector.
Despite the decent performance, the stock price is now at an all-time low.
KEY NUMBERS AND FUNDAMENTALS
Where should I start... Since they spun off from Johnson & Johnson, the stock is now the cheapest when compared to their revenue, income, and other metrics.
Diluted EPS is now at $0.22. The same level as in 2023, when the stock was at $24. The difference is that the stock is now at $16 (33% cheaper).
The dividend ratio is now at 5%, the best level ever. The last time it was this close to the current level was in mid-2024, when the dividend yield reached 4.6%. After that, the stock rose by 38% in less than 6 months. If you like dividends, you should definitly take a look at Kenvue.
The PE ratio is 22, which is low compared to the sector and the company's historical data.
Similar story for the PB ratio, which is now at an all-time low.
This data is telling us that the stock is comparatively cheap. Of course, one needs to ask: Is it cheap because of poor prospects for the company, or because the market is overly fearful? I'd lean for the second.
It's also worth adding that their gross margin is 58%, the EBITDA margin is 24% (quite good), and the forward PE is at around 15.
Finally, the analyst's price targets average $22, giving it an upside of around 34%.
MY GAMEPLAN
I'm going to allocate close to 1% of my net worth to this stock. In case the price drops, I will average down my purchasing price, considering that this company is likely to continue having a very strong moat for the coming years.
I plan to hold it for the medium/long term, potentially selling part or the entirety of my holdings once I get over 30% return. I will re-evaluate it later this year.
Quick note: I'm just sharing my journey - not financial advice! 😊

Flowers Food | FLO | Long at $13.51Flowers Food NYSE:FLO . Maker of Nature’s Own (the top-selling bread brand in the US), Wonder Bread, Tastykake, and many others, has entered my "crash" simple moving average zone. While the fall has been steep since 2022, the company is trading at a price-to-earnings of 13x (typical food industry is around 20x) and offers and 7%+ dividend. It's not a play for future growth, however, which is expected to be mild to stagnant ( based on forward annual earnings and revenue . This position is a value / dividend play given the high likelihood of lower interest rates and a certain group of investors moving out of banks and into dividend / income stocks.
So, while I wouldn't be shocked if NYSE:FLO dips into the $12 rage in the near-term, I have created a starter position in the company at $13.51. My targets are modest, although there is a blaring gap in the $27-$28 range that will likely be filled... some time.
Targets into 2028:
$14.75 (+9.2%)
$16.25 (+20.3%)

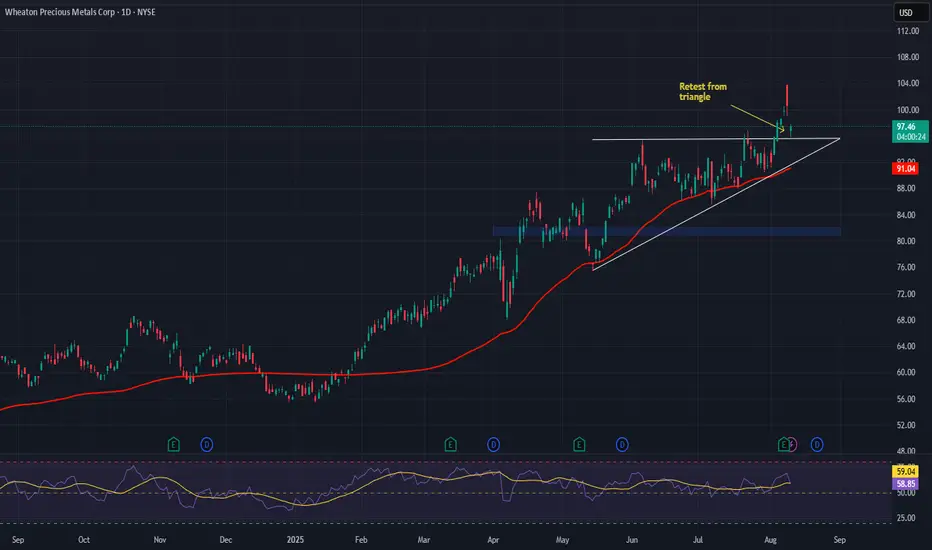
Wheaton (WPM) – Streaming Growth + Precious Metals TailwindsCompany Snapshot:
Wheaton Precious Metals NYSE:WPM is a top-tier precious metals streaming company, giving investors leveraged exposure to gold & silver while avoiding traditional mining risks.
Key Catalysts:
Production Growth Pipeline 🚀
Blackwater, Goose, Platreef, and Mineral Park all scheduled to begin production by late 2025.
Expected to meaningfully boost output, cash flow, and dividend capacity.
Commodity Tailwinds 📈
Rising gold & silver prices supported by central bank buying, geopolitical tensions, and persistent inflation.
Fixed-cost streaming model maximizes margin expansion in a bull metals market.
Earnings Acceleration 💵
Q2 2025 EPS forecast: $0.58 (+44% YoY).
Revenue forecast: $424M (+42% YoY).
Potential for valuation re-rating as growth trends materialize.
Shareholder Appeal 📊
$0.165 quarterly dividend offers both income and growth upside for investors.
Investment Outlook:
Bullish Entry Zone: Above $81.00–$82.00
Upside Target: $115.00–$120.00, driven by new mine ramps, commodity strength, and operational leverage.
#WPM #Gold #Silver #PreciousMetals #Mining #StreamingModel #Commodities #InflationHedge #DividendStocks #SafeHavenAssets
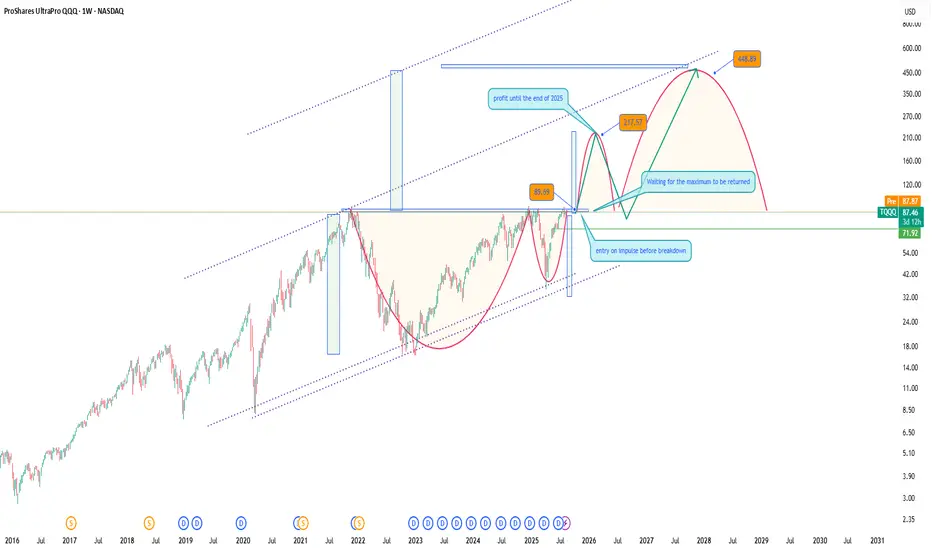
ProShares UltraPro QQQ (TQQQ) LONGThe Technology Sector Continues to Break Records
The tech sector keeps setting new highs, and alongside individual stocks, it's a great idea to consider investing in an ETF that mirrors the profits of the NASDAQ 100 index. One of the most attractive options is TQQQ - it’s more affordable than the index itself, yet offers similar growth potential aligned with the entire tech sector.
I expect continued growth through the end of the year, assuming the geopolitical landscape remains relatively stable.
From a technical standpoint, those looking to minimize risk might prefer to wait for a retest of previous highs. However, my approach is to gradually build a position both before the breakout and after the retest of the highs.
A classic technical analysis pattern -the cup formation, also supports the bullish case for entry. As George Soros wrote in his book: “What moves the market : our expectations or the events themselves?” I’d say it’s both. The key is not to miss the wave.
P.S. Don’t forget: with TQQQ, you also receive dividends - a nice bonus while riding the trend.
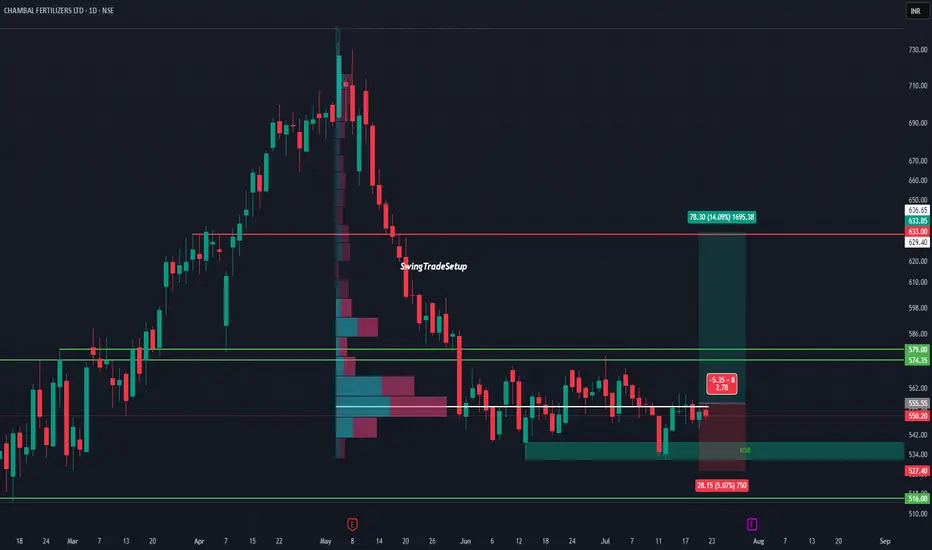
CHAMBAL FERTILISERS LTD – Potential Bottoming Out‽CHAMBAL at Demand Zone | Volumes story
After a steep fall from 730 to 516, Chambal is now consolidating in a critical demand zone backed by visible volume activity. This range has previously triggered price reversals, and now history might repeat.
The stock is respecting the support between 527–516, forming a potential base. On the upside, a clean breakout above ₹555.55 can unlock a near-term target of 633+, a move of over 14%.
The risk-to-reward ratio remains attractive with a tight invalidation below ₹527, while the volume profile suggests accumulation in this range.
Technical View :
• Major support: ₹516–527
• Breakout trigger: ₹555.55
• Upside target: ₹633–636
• Risk below: ₹527
• Volume profile: Dense node suggests buyer interest
Valuation :
• PE: ~10.3 (undervalued vs peers)
• Dividend Yield: ~6.5% (steady income potential)
• Promoter Holding: 60.62% (strong & stable)
• No recent equity dilution
• DII/FII: Activity neutral, could turn if technical align
A good mix of fundamentals, attractive valuation, and technical structure makes this a stock to keep an eye on. If it crosses ₹560 with volume, it may kick off a short-term trend reversal.
This chart is for educational use only and not a buy/sell recommendation.
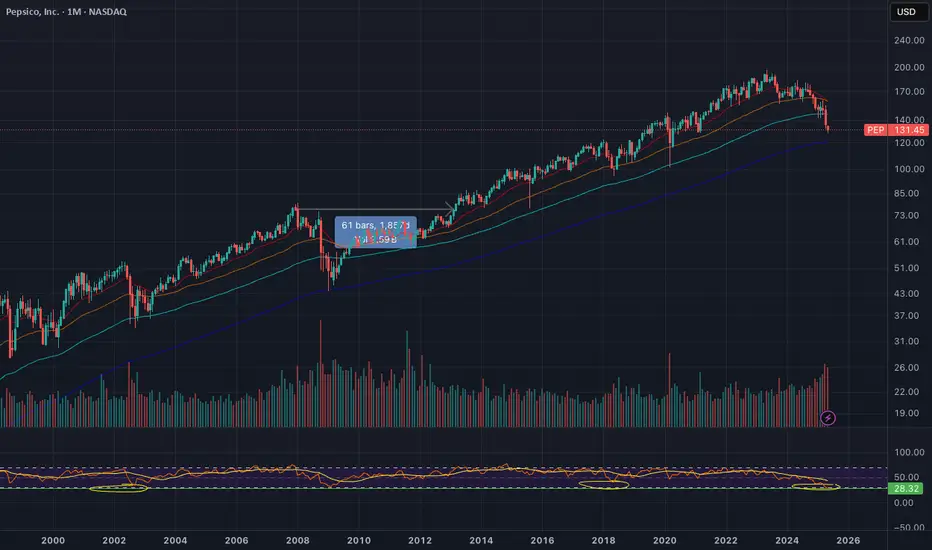
PEP: Long Buy OpportunityPEP is about to touch the 200 Monthly Moving Average. This last 2009.
The RSI is touching less than 30, which last happened in 1973.
PEP is a Dividend King which has increased it's dividend for 53 years. Did Warren Buffett say compounding is the 8th wonder of the world? Oh no, it was Einstein.
Evidence suggests great Long Term BUY opportunity on the price and momentum signals. Compelling.
#PEPSICO (PEP)
Czech Republic: A Dividend HeavenThe Prague Stock Exchange (PSE) PSECZ:PX is characterized by a concentration of mature, dividend-paying companies, particularly in sectors such as energy, banking, and heavy industry. Unlike growth-focused exchanges in the U.S. or Asia, the Czech market offers relatively few stocks with high reinvestment or expansion trajectories.
Preference for Payouts
Over the past two decades, Czech listed companies have consistently distributed a significant share of profits as dividends. This reflects both limited reinvestment opportunities in a relatively saturated domestic market and a shareholder preference for cash returns. For example, CEZ and Komercni banka have maintained payout ratios above 70% in most years.
Structural Support & Tax environment
The Czech Republic provides a structurally supportive environment for dividend-oriented investors. One key advantage is the tax framework. Czech residents are exempt from capital gains tax if they hold an investment for more than three years. This strongly favors long-term investing.
For non-residents, a 15% withholding tax on dividends applies—unless the investor resides in a country outside the EU/EEA that does not have a tax treaty or tax information exchange agreement with the Czech Republic.
Key Dividend-Paying Companies
CEZ (CEZ) PSECZ:CEZ
Industry: Energy (Electricity generation and distribution)
Dividend History (Gross per Share) / Dividend Yield (%)
2020: CZK 34 10.1%
2021: CZK 52 5.8%
2022: CZK 48 18.83%
2023: CZK 145 5.43%
2024: CZK 52 5.9%
Dividend Growth:
2020 to 2021: +52.9%
2021 to 2022: -7.7%
2022 to 2023: +202%
2023 to 2024: -64.1%
Komercni banka (KOMB) PSECZ:KOMB
Industry: Banking and financial services
Dividend History (Gross per Share) / Dividend Yield (%)
2020: CZK 23.9 3.63%
2021: CZK 99.3 10.62%
2022: CZK 60.42 9.22%
2023: CZK 82.7 11.41%
2024: CZK 91.3 10.76%
Dividend Growth:
2020 to 2021: +315.6%
2021 to 2022: -39.2%
2022 to 2023: +36.9%
2023 to 2024: +10.4%
Moneta Money Bank (MONET) PSECZ:MONET
Industry: Banking and financial services
Dividend History (Gross per Share) / Dividend Yield (%)
2020: CZK 0 (dividend suspended)
2021: CZK 3 10.67%
2022: CZK 7 10.53%
2023: CZK 8 12.82%
2024: CZK 9 8.08%
Dividend Growth:
2020 to 2021: N/A
2021 to 2022: +133.3%
2022 to 2023: +14.3%
2023 to 2024: +12.5%

Unipro UPRO Stock Technical Analysis and Fundamental Analysis📊 Technical Analysis of Unipro ( RUS:UPRO ) Stock
Current Price: 2.043 RUB (+2.46%)
Trend: The stock is in a growth phase, but signs of overbought conditions are emerging.
RSI (14): 78.91 (overbought, possible correction ahead)
MACD (12,26,9): +0.13 (bullish signal, but a reversal is possible)
Support Levels: 1.95 RUB and 1.80 RUB
Resistance Levels: 2.10 RUB and 2.30 RUB
Entry Points:
A pullback to 1.95 RUB may be a good opportunity for long positions.
If the price consolidates above 2.10 RUB, further growth toward 2.30 RUB is likely.
Stop-Loss: 1.85 RUB (if breached, the trend could reverse downward)
📈 Fundamental Analysis
Financial Performance:
Revenue remains stable, but growth rates are slowing.
Net profit declined in 2024 due to rising operating expenses.
Debt burden is low, ensuring resilience to macroeconomic shocks.
Impact of the Russian Central Bank:
The high key interest rate is limiting market capitalization growth.
Investors are waiting for rate decisions—any cuts could accelerate stock growth.
Dividends:
Expected to remain at 6 RUB per share.
Dividend yield remains attractive for long-term investors.
Macroeconomic Factors:
External sanctions and political risks may influence business growth.
A potential IPO of RTK-DPC (a Unipro subsidiary) could strengthen the company’s financial position.
🔍 Conclusion
Short-term: The stock may experience a correction due to overbought conditions. The best entry point is around 1.95 RUB.
Mid-term: If the price consolidates above 2.10 RUB, growth toward 2.30 RUB is likely.
Long-term: Unipro remains attractive for investors focused on dividends and stability.
❗ Keep an eye on Russian Central Bank decisions and overall market sentiment.

HOME DEPOT ($HD) Q4—HOME FIXES SPARK A SURGEHOME DEPOT ( NYSE:HD ) Q4—HOME FIXES SPARK A SURGE
(1/9)
Good afternoon, TradingView! Home Depot ( NYSE:HD ) is buzzing—$ 39.7B Q4 sales, up 14.1% 📈🔥. Extra week and SRS deal fuel zing—let’s unpack this retail giant! 🚀
(2/9) – REVENUE RUSH
• Q4 Sales: $ 39.7B—14.1% up from $ 34.8B 💥
• Full ‘24: $ 159.5B—4.5% rise from $ 152.7B 📊
• Boost: $ 4.9B from 14th week
NYSE:HD ’s humming—fixer-uppers unite!
(3/9) – EARNINGS GLOW
• Q4 EPS: $ 3.13—beats $ 3.03 est. 🌍
• Net: $ 3.0B—up from $ 2.8B 🚗
• Dividend: $ 2.30—up 2.2%, juicy 🌟
NYSE:HD ’s profit shines—steady cash!
(4/9) – BIG PLAYS
• SRS Buy: Pro segment zaps growth 📈
• Comp Sales: +0.8%—first up in 2 yrs 🌍
• Stores: 12 newbies—expansion zip 🚗
NYSE:HD ’s flexing—home king reigns!
(5/9) – RISKS IN VIEW
• Housing: Rates, $ 396.9K homes—yikes ⚠️
• Inflation: Wallets tighten—sting 🏛️
• Comp: Lowe’s nips—tight race 📉
Hot run—can it dodge the bumps?
(6/9) – SWOT: STRENGTHS
• Lead: $ 159.5B—top dog 🌟
• Comp: +0.8%, 7.6% trans. jump 🔍
• SRS: Pro cash flows—steady juice 🚦
NYSE:HD ’s a retail beast—rock solid!
(7/9) – SWOT: WEAKNESSES & OPPORTUNITIES
• Weaknesses: Housing drag—boo 💸
• Opportunities: Rate cuts, SRS lift—zing 🌍
Can NYSE:HD zap past the risks?
(8/9) – NYSE:HD ’s Q4 surge—what’s your vibe?
1️⃣ Bullish—Growth shines bright.
2️⃣ Neutral—Solid, risks hover.
3️⃣ Bearish—Housing stalls it out.
Vote below! 🗳️👇
(9/9) – FINAL TAKEAWAY
NYSE:HD ’s $ 39.7B Q4 and SRS spark zing—$ 159.5B year hums 🌍🪙. Premium P/E, but grit rules—gem or pause?

AT&T setup is wired!AT&T - NYSE:T
5% Dividend yield and about to pop higher?!
Setup looks wired 🛜
Breakout = 🎯$24🎯25.38
Not financial advice

MBSB Cup & Handle Formation in the MakingShort term MBSB could be heading to support area around 0.700
If Cup and Handle pattern forms, TPs are the greenline marked on the chart.
Dividends have been good from this stock, plus it's a Banking stock.. with interest rates stable and potentially going down from here, loans are going to be cheaper and banks profit will grow Q-on-Q. It's also one of the only two Banking stocks that are Shariah Compliant.
I am looking to add position at 0.690 (support area) and keep it on my portfolio long term.

Continuation of the Trend Bullish Divergence on the annual time frame indicating a continuation of the annual trend targeting $300.
Oversold stochastic showing that bears are loosing control and bulls are entering the market gaining the opportunity to earn some sweet dividend pay outs.
RSI indicating Market exhaustion the the downside is over and a bull run is beginning and will continue for the weeks and months ahead.
Enter: $206
SL: $180
Target 1:$250
Target 2: $300

BOUNCE FOLLOWED BY LOWER PRICES FORECASTEDWhile the higher degree long-term outlook for this dividend giant is bullish, the short-term outlook is not likely to bring new all-time highs. Earlier this year we anticipated new all-time highs, but that changed when KO hit it’s 63.18 low last week. What changed the forecast was the technicals surrounding that low. While the price action is currently cooked to the downside, there are no clear indications of a reversal, with the weekly RSI indicating more room to the downside, and the MACD supporting that theory. This tells us to turn to the most telling indicator, which is volume, which indicates there is still strength to the downside. That said, we know the market does not move in straight lines and a strong bounce off the 63.18 low is likely. We currently forecast that bounce to target the round number zone of 70, forming a B-Wave rejection of higher prices, that will be followed by a C-wave, which will likely target the weekly point of control around 60. With that in mind, C-waves can truncate their targets, especially when the ticket involved is a popular long-term dividend target like KO, and we are talking about a long-term low that will create a significant buying opportunity. That said, if you can deal with the near-term volatility, the 63 zone may not be a bad entry zone.

LANKEM DEVELOPMENTS PLC : LDEV.N0000 : CSEOverview
LDEV is the parent company of AGARAPATANA PLANTATIONS PLC (AGPL.N0000) and 98% of group revenue of LDEV is from AGPL.
Strategy
1. Getting exposure to a probable interim dividend expected to be LKR 2.00.
LDEV subsidiary AGPL declared an interim dividend of LKR 1.00 payable on 28th Oct. 2024 which will generate LKR 239M as net dividend (after tax) proceeds for LDEV. As LDEV doesn't have bank borrowings we can assume this dividend receipt will be re-distributed as a dividend to LDEV shareholders. If the board decided to distribute the entire amount, it can be an interim dividend of LKR 2.00.
Assumption: Not deciding to utilize the proceeds in settling intercompany balances.
2. Getting exposure to a continuous dividend stream and exposure to one of the best performing plantation companies in CSE.
AGPL is currently with almost zero net borrowings. If tea prices remain @ current levels, we can expect the dividend stream will continue with enhancements.
EPS FY 2023 = LKR 1.20
EPS 1Q 2024 = LKR 0.71 (If tea prices remain @ current levels with current yields, we can assume a FWD EPS for FY 2024 = LKR 2.84)
Fundamentals
1. FY 2023 earnings
* FY 2023 EPS LKR 1.90
2. Q1 2024 earnings
* 1Q 2024 EPS LKR 1.52
* Assuming AGPL managed to maintain current earnings we can assume a FWD EPS of LKR 6.00 for LDEV. (FWD PE 3)
52 Week Price Range
High : LKR 23.90
Low : LKR 13.80
All time high LKR 38.90
Technical Analysis (Chart Patterns)
* LDEV had created a Descending Wedge pattern during the 2-year price correction and another wedge pattern during last 10 months of consolidation process. During last week both of these patterns recorded break outs.
Potential Pattern Targets
* 10-month consolidation wedge pattern target LKR 22.80
* 2-year descending wedge pattern target LKR 35.30

This is what Winner Stocks looks likeGreat stock for good returns. ADP's moat stems from its dominant position in the payroll and human capital management industry, which is bolstered by its extensive scale and network effects. The company's large customer base and integrated services create a significant barrier to entry for competitors, enhancing its value proposition. ADP's long-standing reputation for reliability and accuracy has built substantial customer loyalty, making it difficult for new entrants to challenge its market share. Additionally, ADP’s comprehensive suite of services, including payroll, benefits administration, and tax compliance, increases switching costs for clients. The company's ongoing investment in technology and data security helps it maintain a competitive edge, driving sustained financial performance and contributing to its high stock valuation.

CSCO Layoffs Positive for the StockNASDAQ:CSCO gapped up on its earnings report even though the company has failed to reinvent and failed to change to HyperAutomation in its IT departments quickly enough.
News of layoffs is considered a positive action on the part of the officers of the corporation who are responsible first and foremost to INVESTORS and cutting costs so that the company can slowly regain revenues and earnings for dividends for INVESTORS.
Delaying layoffs, which may be kind and thoughtful for employees, is a negative for INVESTORS, namely the giant Buy-Side Institutions, because it extends and worsens the financial condition of the company.
As more and more companies buy robots/robotics and AI technology, these will reduce payroll expenses and help to control internal business inflation, which is caused mostly by rising payroll expenses with declining productivity from the workforce of the company.
This is always misunderstood by retail groups who believe layoffs are a bad thing for the "economy." The world of commerce and the financial markets is not a fair or kind place.

GIS - Conservative Income PlayGeneral Mills has been gaining a bit of strength crossing above it's 20 week moving average. Volatility is dead flat.
Transacting a June 25 67.5 buy/write, in addition to a 3.5% dividend results in this play producing in annualized rate of return in excess of 12%.
I do this kind of strategy in a qualified account as dividends received in a buy/write transaction may not be considered qualified dividends. Be sure to seek the advice of an investment adviser before trading any of my ideas.

SUPREME INDUSTRIES TRADING IDEACup & Handle Breakout with good volume.
Stock can go as marked on the chart
Technicals
—Bullish Crossover
—Above 20 EMA
—Higher High breakout
—RSI 71
Fundamental
Stock P/E 44.2
ROCE 26.8%
ROE 21.0 %
Market Cap ₹38,226Cr.
educational purpose only!✨
Do your research before making any investment🥂
