Update on the key supports to watch for the S&PDisclaimer:
The information posted on Trading View is for informative purposes and is not intended to constitute advice in any form, including but not limited to investment, accounting, tax, legal or regulatory advice. The information therefore has no regard to the specific investment objectives, financial situation or particular needs of any specific recipient. Opinions expressed are our current opinions as of the date appearing on Trading View only. All illustrations, forecasts or hypothetical data are for illustrative purposes only. The Society of Technical Analysts Ltd does not make representation that the information provided is appropriate for use in all jurisdictions or by all Investors or other potential Investors. Parties are therefore responsible for compliance with applicable local laws and regulations. The Society of Technical Analysts will not be held liable for any loss or damage resulting directly or indirectly from the use of any information on this site.
DMI

Bitcoin dominance on bullish descending wedgeDominance is about to break the wedge.
There is also a bullish divergence in the DMI indicator signaling an upward reversal.

What to look out for now S+P failing at its 200 dmaIn this video I show the major resistance that the S+P faces and is currently stalling at, I talk about the support levels which need to break which should trigger further weakness. But I also talk about confirmed buy and sell signals on the DMI, One that needs to go back on the radar.
The Society of Technical Analysts' next course starts in October. Those wishing to learn more about technical analysis can take a look at the Route to Diploma - Society of Technical Analysts, www.technicalanalysts.com
The STA is also offering a 10% discount on the first year of membership with the following code: STALINK
Disclaimer:
The information posted on Trading View is for informative purposes and is not intended to constitute advice in any form, including but not limited to investment, accounting, tax, legal or regulatory advice. The information therefore has no regard to the specific investment objectives, financial situation or particular needs of any specific recipient. Opinions expressed are our current opinions as of the date appearing on Trading View only. All illustrations, forecasts or hypothetical data are for illustrative purposes only. The Society of Technical Analysts Ltd does not make representation that the information provided is appropriate for use in all jurisdictions or by all Investors or other potential Investors. Parties are therefore responsible for compliance with applicable local laws and regulations. The Society of Technical Analysts will not be held liable for any loss or damage resulting directly or indirectly from the use of any information on this site.

Bitcoin dominance defined in JanuaryBitcoin dominance defines the market capitalization of BTC versus the total crypto market capitalization.
When the dominance of BTC goes up, it means that the price of BTC performs better than altcoins.
Otherwise, when it goes down, altcoins perform better.
According to vertical lines, January is a definition month.
The red lines indicate when there has been a decline in dominance, and the green lines when there has been a rise.
In the last month of January, we have an indication of a rise.
The question is whether in January 2023 dominance will continue to rise or decline.

RNEabove emas recently broke the 200, ADX @ 38 with bullish PDI momentum - looking for breakout and use the 200
as support

RESISTANCE TESTInteresting test of March highs while DMI is signaling a potential bullish pressure is
yet to be ended, we expect here some volatility due to profit takings of shorter term traders, however until the middle of the range is below prices we could wait for a weekly close above the resistance in order to trigger our longs over a bullish breakout momentum strategy.


Forecasts for QQQ (Nasdaq ETF)The further the price drops, the closer to the end of the drop we are, and the riskier it is to open a short position.
The risk-return relationship begins to not pay off.
Despite all this bad news out there, I still see the sun shine and I still see children playing in the park...

Will SPY fill the gap or make a short squeeze?I would bet on the short squeeze... sometimes the market doesn't follow logic, but I could be wrong, obviously.
1. Price testing long pandemic retracement of 21.4% at $ 405.49.
It broke 38.2% short retracement from the last top.
Stochastic DMI in dangerous region.
2. Is there still room to go up?

Stellar Lumens waiting for a pullbackAfter breaking through a diagonal resistance line, the price is testing another diagonal mini resistance.
I would expect a return on the support in red for a good entry, unless it gives indications that it won't go back there anymore.

Nikkei filling a gapI think the Japanese and Asian markets will anticipate what will happen this week.
After a false breakout of a diagonal resistance marked in blue, there is a high chance of filling the gap that was left open, reaching at least as far as the correction of 0.618.
Then we will have a better definition.

Zcash with a shoulder-head-shoulder indicationThis is another privacy-focused crypto asset.
The DMI signaled a divergence.
Just as Monero is indicating a bullish reversal.

Cello/USDT AnalysisHello traders.
1. Weekly chart
Stochastic RSI pointing up.
The price has reached the 1.68 target of the projection and also the diagonal Fibo channel, a well-known target.
2. Daily chart
I plotted two possible scenarios, an optimist with a green arrow and a pessimist with a red arrow.
The price apparently corrected on the 50% retracement:
The correction also respected the Arnaud Legoux moving average of 89:
And it stayed above the exponential moving averages of 8 and 21:
Analyzing 21-period Bollinger Bands, with regularized exponential mean and Extreme Stochastic DMI:
The price tried to stay above the average for 3 times as per the red circles.
It's testing again, to see if it goes back down to the green circle.
The Extreme Stochastic DMI indicates bullish continuation pointing up.
3. 4-hour chart
Price appears to be undefined in the range between the 200 exponential and simple moving averages
The price needs to stay above 1,272 Fibo channel, otherwise it will test the next level at 1,382.

Buy opportunity in RECSwing buy REC
DMI Crossover and EMA golden crossover together make the buy signal in this set up.
Today's bullish candle with higher volume support provides the confirmation we need. Next session, the trigger to buy is above today's high.
Will update levels when its triggered

BAKE Long, shows signs of recovery. Many days of supportHello,
This is our second signal after we improved our trading system. BAKE is already up 70% + from the lowest point and is holding support and rising the last 12 days.
Possibility of continuation as just today we received our signal to enter, and after a long downtrend the price has broken the lip of the alligator and is going up.
Enter with caution on the hourly timeframe and set stop loss @ 0.267
Hold until doji candle appears or SAR ball appears or a combination of the two.
Take care

Bitcoin in good price to buy for next week!Hello friends,
I have examining the bitcoin chart and I have seen that is in support area and below the VWAP band that signals to buy!
Also SAR balls are there, and looks like that its trying to recover.
Stop loss at 29300
TP 1 30600
TP 2 31400
Good luck

XRP On the move!Hello friends,
Our system just gave us a signal for xrp. After examining the chart I saw that is holding for hours the support, the sar balls created a long support line that was unbreached, heikin ashi candles are bullish, price broke out of alligator jaw and dmi just did a crossover.
enter now , set up stop loss @ 0.3936
take profit on the next reversal sar ball or how you find convenient.
good luck

Hopium?Inverse head and shoulders. Rejected the neckline, wait for a clear break out of the 775. Crossed up the 20ema and when TSLA does this it tends to go ballistic. I would see it run to the area of resistance of the 20ema. In addition to that DMI is bullish right now

BEL Probably Starting TrendHello guys, I am back after a very long time. This is our first prediction, our signal was given few hours ago and already is up, please wait before enter. Looks like price is going to reverse and start a positive trend. If you enter soon go out when doji candle appear.
Follow me for more free signals and analysis!

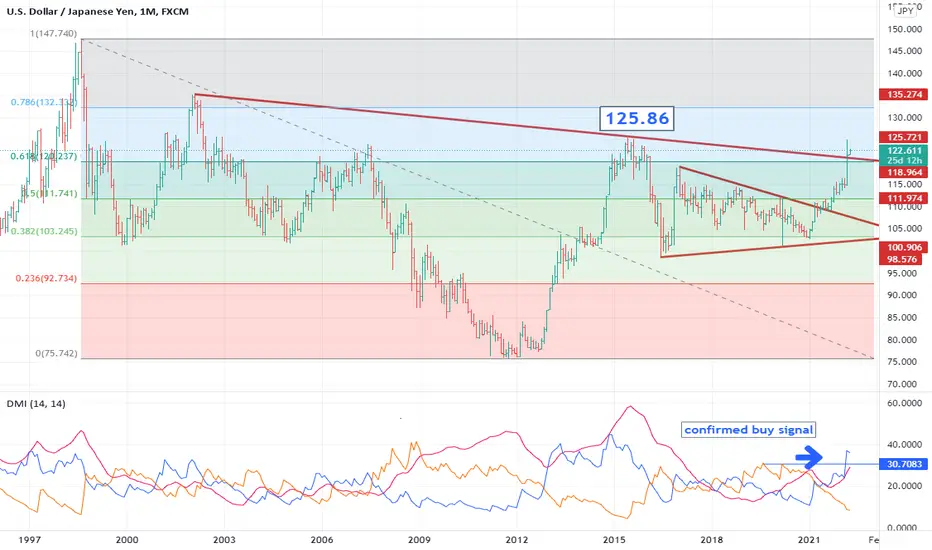
My twist on using the DMI indicatorWe have been talking for months now about the US Dollar going higher and with another strong month for jobs growth last week fundamental data and the technical view remain aligned.
We thought that we would take a look at the USD/JPY chart this morning, which has recently broken above the 20-year resistance line and looks well placed for further gains to the 125.86 2015 peak. We are going to discuss why we think that this will break for a move to the 78.6% retracement (of the move down from 2002 to the 2012 low) at 132.33.
Firstly we note price itself, the strength of the move prior to breaking the 20-year resistance line – the market rallied almost 10 big figures last month and secondly we have what I like to refer to as a ‘confirmed BUY signal’ on the DMI indicator (Directional Movement Index). These occur when the blue line breaks above previous blue peaks (the +DI line) and the previous sell peaks of the indicator (the -DI line) – see chart. Ideally ADX is also above 25.
As a side note, I only use it when it gives these ‘confirmed’ signals.
What Is the Directional Movement Index (DMI)?
The directional movement index (DMI) is an indicator developed by J. Welles Wilder that identifies in which direction the price of an asset is moving. The indicator does this by comparing prior highs and lows and drawing two lines: Positive and negative directional movement form the backbone of the Directional Movement System.
The Plus Directional Indicator (+DI) and Minus Directional Indicator (-DI) are derived from smoothed averages of these differences and measure trend direction over time. These two indicators are often collectively referred to as the Directional Movement Indicator (DMI).
The Average Directional Index (ADX) is in turn derived from the smoothed averages of the difference between +DI and -DI; it measures the strength of the trend (regardless of direction) over time.
Using these three indicators together, chartists can determine both the direction and strength of the trend.
When +DI is above -DI, there is more upward pressure than downward pressure in the price. Conversely, if -DI is above +DI, then there is more downward pressure on the price. This indicator may help traders assess the trend direction. Crossovers between the lines are also sometimes used as trade signals to buy or sell.
KEY TAKEAWAYS
• The directional movement index (DMI) is a technical indicator that measures both the strength and direction of a price movement and is intended to reduce false signals.
• The DMI utilizes two standard indicators, one negative (-DI) and one positive (+DI), in conjunction with a third, the average directional index (ADX), which is non-directional but shows momentum.
• The larger the spread between the two primary lines, the stronger the price trend. If +DI is way above -DI the price trend is strongly up. If -DI is way above +DI then the price trend is strongly down.
• ADX measures the strength of the trend, either up or down; a reading above 25 indicates a strong trend.
• I find this works better when using the ‘confirmed buy or sell’ and this only occurs when the +DI or -VE breaks above its previous peaks.
Disclaimer:
The information posted on Trading View is for informative purposes and is not intended to constitute advice in any form, including but not limited to investment, accounting, tax, legal or regulatory advice. The information therefore has no regard to the specific investment objectives, financial situation or particular needs of any specific recipient. Opinions expressed are our current opinions as of the date appearing on Trading View only. All illustrations, forecasts or hypothetical data are for illustrative purposes only. The Society of Technical Analysts Ltd does not make representation that the information provided is appropriate for use in all jurisdictions or by all Investors or other potential Investors. Parties are therefore responsible for compliance with applicable local laws and regulations. The Society of Technical Analysts will not be held liable for any loss or damage resulting directly or indirectly from the use of any information on this site.
MicroStrategy testing FibonacciWe can see a high correlation between the company and BTC since the pandemic.
Looking at the monthly chart, the fact is that the price is now in an important Fibonacci region at 50%.
On the 1-hour chart, on the ADX indicator, we can see a decrease in the selling force (red arrows), and an increase in the buying force (green arrows),
forming a kind of symmetrical triangle, signaling a temporary indefiniteness.
I'm waiting in the cabin to see what happens.

Strong Support area for ETH !Prices could stop downward movement near this area.
Stay alert for reversal candles and new high swings at this area
If do so, first resistence level near $4300
Didi Index give us Buy alert
DMI remains indicating sells
BINANCE:ETHUSD

Is DXY topping...for now...Besides the illustrated Indicator signals, CoT Data on DXY shows Commercials at a (typical) turning point extreme.
Nov '18, Oct '19 both previous times where Commercials were more than 40k Net Short...Extremes in the Commercials tend to correspond with turning points in the market.
This is a BIG SHIP steering though, it's not a turn-on-a-dime kind of move. It's just saying, if you're in good profits Long DXY, maybe take a chunk off the table. Certainly we can get another push higher, I'll likely be looking to short the market if we do.
